Market Overview
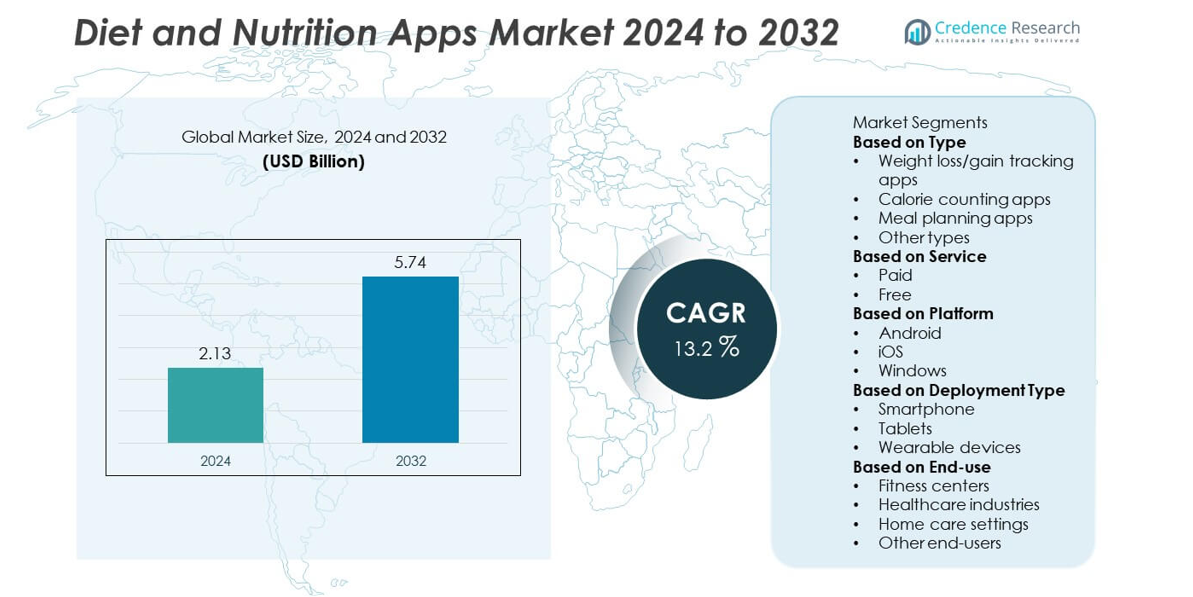
The global diet and nutrition apps market was valued at USD 2.13 billion in 2024 and is projected to reach USD 5.74 billion by 2032, growing at a CAGR of 13.2% during the forecast period.
| REPORT ATTRIBUTE |
DETAILS |
| Historical Period |
2020-2023 |
| Base Year |
2024 |
| Forecast Period |
2025-2032 |
| Diet and Nutrition Apps Market Size 2024 |
USD 2.13 billion |
| Diet and Nutrition Apps Market, CAGR |
13.2% |
| Diet and Nutrition Apps Market Size 2032 |
USD 5.74 billion |
The diet and nutrition apps market is led by major players including MyNetDiary Inc., PlateJoy LLC, Lifesum AB, Ovia Health, MyPlate Calorie Counter, Noom, Inc., SPOKIN, INC, mySugr GmbH, HealthifyMe Wellness Private Limited, and MyFitnessPal, Inc. These companies dominate through advanced AI-based nutrition tracking, personalized meal planning, and seamless integration with wearable devices. Asia-Pacific emerged as the leading regional market with a 31% share in 2024, driven by rising smartphone penetration and growing health awareness. North America followed with a 33% share, supported by strong adoption of digital wellness platforms and high consumer spending on preventive healthcare solutions.
Market Insights
- The diet and nutrition apps market was valued at USD 2.13 billion in 2024 and is projected to reach USD 5.74 billion by 2032, growing at a CAGR of 13.2% during the forecast period.
- Rising health awareness, smartphone penetration, and demand for personalized diet management are driving market expansion across all major economies.
- Trends such as AI-based nutrition insights, wearable integration, and subscription-based models are enhancing user engagement and app functionality.
- The market is moderately competitive, with players like MyFitnessPal, Noom, HealthifyMe, and Lifesum focusing on data-driven personalization, partnerships, and global app reach.
- North America held a 33% share in 2024, followed by Asia-Pacific at 31% and Europe at 29%, while calorie counting apps dominated the type segment with a 37% share due to their effectiveness in daily nutrition tracking and weight management.
Access crucial information at unmatched prices!
Request your sample report today & start making informed decisions powered by Credence Research Inc.!
Download Sample
Market Segmentation Analysis:
By Type
Calorie counting apps dominated the diet and nutrition apps market in 2024 with a 37% share, driven by their ease of use and strong demand for personalized health management. These apps enable users to monitor calorie intake, macronutrients, and exercise routines, supporting weight management goals. Integration with wearable fitness devices and real-time data tracking further enhance user experience. The growing trend of self-monitoring and preventive healthcare continues to strengthen the adoption of calorie tracking platforms across both developed and emerging markets.
- For instance, MyFitnessPal, Inc. integrates with over 35 connected fitness partners, including devices from Fitbit and Garmin. The app allows its community of over 280 million members in over 120 countries to log food intake and record exercise activity, relying on a database that contains over 20 million foods.
By Service
The free service segment led the market with a 62% share in 2024, supported by the availability of ad-supported applications and basic health tracking tools at no cost. Free versions attract a large user base, especially in developing regions, where cost sensitivity remains high. These apps often serve as entry points to premium paid versions offering advanced features such as AI-based meal planning and personalized coaching. The paid segment is expected to grow steadily as consumers seek customized, data-driven nutrition guidance and ad-free experiences.
- For instance, HealthifyMe Wellness Pvt. Ltd. operates with over 40 million users and offers free calorie tracking supported by its AI nutritionist, Ria. Lifesum AB reported over 65 million users globally, with its free tier allowing users to log food and hydration, while its paid users access tailored diet and meal plans powered by proprietary AI algorithms.
By Platform
The Android platform accounted for a 58% share of the market in 2024, owing to its widespread adoption and affordability across global users. The dominance of Android-based smartphones in Asia-Pacific, Africa, and Latin America drives app downloads and usage. Developers focus on optimizing app performance and interface compatibility for diverse Android devices. Meanwhile, the iOS segment continues to attract health-conscious consumers in developed regions, supported by strong integration with Apple HealthKit and advanced data analytics for personalized nutrition tracking.
Key Growth Drivers
Rising Health Awareness and Lifestyle Diseases
Growing global awareness about preventive healthcare and the increasing prevalence of obesity and lifestyle-related illnesses are major factors driving the adoption of diet and nutrition apps. These platforms help users monitor calorie intake, track fitness goals, and maintain balanced diets. Governments and health organizations are also promoting digital health tools to encourage healthier lifestyles. The trend toward self-managed wellness and personalized nutrition continues to strengthen market growth across both developed and developing regions.
- For instance, Noom, Inc. is a digital healthcare company that has developed behavioral wellness programs to assist users in weight management. esearch has indicated that users who engage regularly with the app’s features, like logging meals and weighing in, are more likely to lose weight.
Expansion of Smartphone and Internet Penetration
Rapid smartphone adoption and improved internet connectivity are expanding the user base for diet and nutrition apps. Affordable data plans and user-friendly interfaces have made health tracking accessible to a wide audience. Enhanced 5G networks and cloud integration improve data synchronization and app performance. Compatibility with wearable devices also enables real-time health monitoring. These technological advancements are making nutrition apps more reliable and convenient, accelerating their penetration in both urban and rural markets.
- For instance, Lifesum AB, the digital health platform, offers an AI-powered multimodal tracker for logging meals and integrates with wearable devices like the Apple Watch and Google Health for syncing data. A 2025 study examining the app’s intervention design notes that it collects data on biometrics, goals, and daily tracking to generate statistics and guidance for users.
Integration of AI and Personalized Nutrition Insights
Artificial intelligence and machine learning are transforming how users interact with diet and nutrition platforms. AI-powered algorithms analyze eating habits, physical activity, and user preferences to generate personalized meal plans and nutritional advice. Predictive analytics and adaptive goal tracking improve user engagement and retention. Developers are incorporating intelligent features such as barcode scanning, voice input, and automatic nutrient calculation to enhance accuracy. This focus on personalization and automation continues to drive innovation in the market.
Key Trends and Opportunities
Integration with Wearables and Health Platforms
The growing integration of diet and nutrition apps with smartwatches, fitness trackers, and health platforms is reshaping the user experience. These integrations allow real-time tracking of calorie expenditure, heart rate, and physical activity. Partnerships between app developers and telehealth providers further enhance service capabilities. Data sharing across connected devices helps users achieve more accurate and holistic health monitoring. This trend is increasing engagement levels and promoting long-term usage among fitness-conscious consumers.
- For instance, Cronometer connects with Apple Watch and Fitbit and supports a food database of over 1,200,000 verified foods, enabling precise nutrient and calorie logging.
Expansion of Subscription-Based and Corporate Wellness Programs
The rise of subscription-based app models and corporate wellness programs presents new business opportunities. Paid app versions offer advanced features such as personalized meal plans, professional consultations, and ad-free access. Corporations are adopting these apps as part of employee wellness initiatives to promote health and reduce medical expenses. This trend ensures steady revenue for developers while enhancing user loyalty. The expansion of wellness-focused digital platforms continues to strengthen market growth globally.
- For instance, HeiaHeia is a Finnish company with a social wellbeing app that logs more than 600 different activities. It offers free and paid versions for individuals and organizations to track exercise and hobbies. The platform also includes challenges and peer support to motivate users.
Key Challenges
Data Privacy and Security Concerns
Data privacy remains a major concern as diet and nutrition apps collect sensitive health-related information. Unauthorized access or data breaches can damage user trust and brand reputation. Developers must comply with data protection laws such as GDPR and HIPAA to ensure transparency and security. Investing in encryption, authentication systems, and secure cloud infrastructure is essential to maintain compliance and protect user data. Strengthening privacy frameworks is vital for sustainable market growth.
Limited Accuracy and User Engagement Retention
Ensuring consistent data accuracy and maintaining user engagement are persistent challenges in the market. Manual food logging, incomplete nutritional databases, and inconsistent entries can compromise tracking accuracy. Many users also lose interest over time due to repetitive input requirements. Developers are addressing these issues through AI automation, gamified features, and timely reminders to improve engagement. Expanding verified food databases and enhancing app interactivity will help retain users and ensure reliable tracking experiences.
Regional Analysis
North America
North America held a 33% share of the diet and nutrition apps market in 2024, driven by rising health awareness and widespread smartphone adoption. The United States leads the region, supported by high consumer spending on digital health and fitness solutions. The growing trend of personalized nutrition, along with strong integration of wearables and AI-based tracking, continues to enhance app engagement. Canada contributes through increasing use of wellness apps among younger demographics. High obesity rates and government-backed wellness initiatives further encourage users to adopt nutrition-tracking platforms for preventive healthcare.
Europe
Europe accounted for a 29% share of the global diet and nutrition apps market in 2024, supported by growing demand for preventive healthcare and digital wellness solutions. Countries such as Germany, the United Kingdom, and France are leading adopters, driven by health-conscious lifestyles and advanced mobile infrastructure. The integration of AI-driven meal planning and calorie tracking supports personalized nutrition management. Expanding collaborations between app developers and fitness centers are promoting user engagement. The European Union’s focus on digital health innovation and strict data privacy regulations is shaping steady market growth across the region.
Asia-Pacific
Asia-Pacific dominated the diet and nutrition apps market with a 31% share in 2024, fueled by rapid urbanization, smartphone penetration, and growing health awareness among younger populations. China, India, and Japan are major contributors, with increasing adoption of mobile health technologies and online fitness communities. The rising burden of lifestyle diseases, including diabetes and obesity, is boosting demand for nutrition management solutions. Affordable app subscriptions and localization of content in regional languages further enhance user accessibility. Expanding digital ecosystems and government health initiatives continue to strengthen regional market growth.
Latin America
Latin America captured a 4% share of the global diet and nutrition apps market in 2024, supported by growing smartphone adoption and increased focus on personal wellness. Brazil and Mexico lead the region due to their expanding fitness and health-conscious populations. The availability of free nutrition-tracking apps and influencer-led health campaigns has accelerated consumer interest. Rising prevalence of obesity and lifestyle-related illnesses is encouraging users to adopt digital solutions for diet management. The ongoing expansion of mobile internet coverage and health education programs continues to support market penetration across the region.
Middle East and Africa
The Middle East and Africa region held a 3% share of the diet and nutrition apps market in 2024, driven by increasing digital transformation and rising health awareness. The United Arab Emirates and Saudi Arabia are leading adopters, supported by government initiatives promoting fitness and wellness. Growing smartphone use and interest in weight management solutions are expanding user engagement. In Africa, improving internet infrastructure and affordable mobile access are encouraging gradual adoption. The regional market is expected to grow steadily as awareness of preventive health and digital nutrition tracking continues to rise.
Market Segmentations:
By Type
- Weight loss/gain tracking apps
- Calorie counting apps
- Meal planning apps
- Other types
By Service
By Platform
By Deployment Type
- Smartphone
- Tablets
- Wearable devices
By End-use
- Fitness centers
- Healthcare industries
- Home care settings
- Other end-users
By Geography
- North America
- Europe
- Germany
- France
- U.K.
- Italy
- Spain
- Rest of Europe
- Asia Pacific
- China
- Japan
- India
- South Korea
- South-east Asia
- Rest of Asia Pacific
- Latin America
- Brazil
- Mexico
- Rest of Latin America
- Middle East & Africa
- GCC Countries
- South Africa
- Rest of Middle East and Africa
Competitive Landscape
The competitive landscape of the diet and nutrition apps market includes key players such as MyNetDiary Inc., PlateJoy LLC, Lifesum AB, Ovia Health, MyPlate Calorie Counter, Noom, Inc., SPOKIN, INC, mySugr GmbH, HealthifyMe Wellness Private Limited, and MyFitnessPal, Inc. These companies lead the market through strong brand presence, advanced analytics, and personalized nutrition solutions. Competition is intensifying as players focus on AI-driven recommendations, wearable integrations, and subscription-based models to enhance user retention. Strategic collaborations with healthcare providers and fitness platforms are expanding market reach. Companies are also investing heavily in regional language support, gamified tracking, and community engagement features to attract diverse audiences. Continuous innovation in behavior-based nutrition coaching and mobile user experience is shaping the industry’s evolution toward holistic digital wellness solutions.
Shape Your Report to Specific Countries or Regions & Enjoy 30% Off!
Key Player Analysis
- MyNetDiary Inc.
- PlateJoy LLC
- Lifesum AB
- Ovia Health
- MyPlate Calorie Counter
- Noom, Inc.
- SPOKIN, INC
- mySugr GmbH
- HealthifyMe Wellness Private Limited
- MyFitnessPal, Inc.
Recent Developments
- In February 2025, Lifesum AB launched its AI-powered Multimodal Tracker, enabling users to log meals via photo, voice, text, or barcode scanning for seamless nutrition tracking.
- In December 2024, MyNetDiary Inc. launched its AI Meal Scan feature, enabling users to log meals via photos. The scanner recognizes food items, estimates portions, and maps them to nutrition data in seconds.
- In 2023, HealthifyMe Wellness Private Limited rolled out HealthifySnap, an AI-powered photo meal tracking tool, which allowed users to “snap a photo, and track food” automatically
Report Coverage
The research report offers an in-depth analysis based on Type, Service, Platform, Deployment Type, End-use and Geography. It details leading market players, providing an overview of their business, product offerings, investments, revenue streams, and key applications. Additionally, the report includes insights into the competitive environment, SWOT analysis, current market trends, as well as the primary drivers and constraints. Furthermore, it discusses various factors that have driven market expansion in recent years. The report also explores market dynamics, regulatory scenarios, and technological advancements that are shaping the industry. It assesses the impact of external factors and global economic changes on market growth. Lastly, it provides strategic recommendations for new entrants and established companies to navigate the complexities of the market.
Future Outlook
- The market will continue to grow as health awareness and digital adoption increase globally.
- AI and machine learning will enhance personalization and real-time nutrition recommendations.
- Integration with wearable devices will improve data accuracy and user engagement.
- Subscription-based premium features will generate consistent revenue for app developers.
- Corporate wellness programs will increasingly include diet and nutrition tracking solutions.
- Expansion in emerging markets will drive new user growth through affordable mobile access.
- Partnerships with healthcare providers will strengthen credibility and clinical relevance.
- Data privacy and compliance improvements will boost user trust and retention.
- Gamification and community features will enhance motivation and long-term usage.
- Continuous innovation in predictive analytics will enable customized meal and fitness planning.


