CHAPTER NO. 1 : GENESIS OF THE MARKET
1.1 Market Prelude – Introduction & Scope
1.2 The Big Picture – Objectives & Vision
1.3 Strategic Edge – Unique Value Proposition
1.4 Stakeholder Compass – Key Beneficiaries
CHAPTER NO. 2 : EXECUTIVE LENS
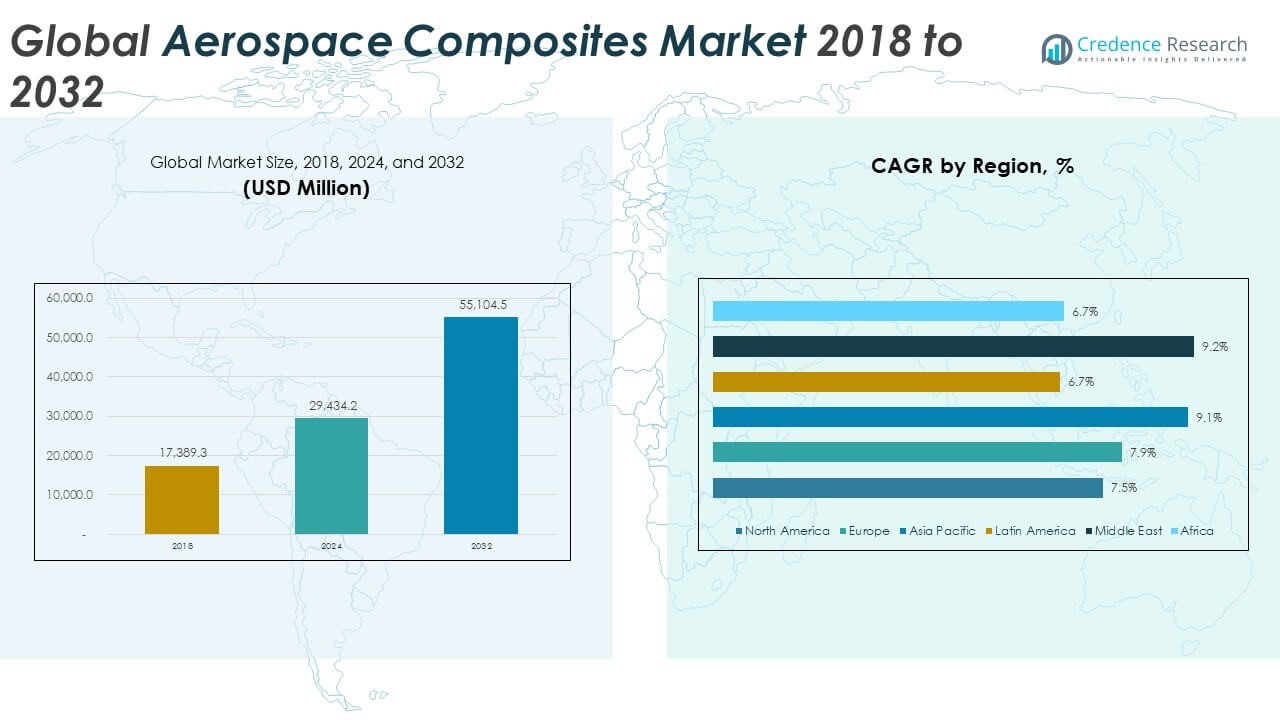
2.1 Pulse of the Industry – Market Snapshot
2.2 Growth Arc – Revenue Projections (USD Million)
2.3. Premium Insights – Based on Primary Interviews
CHAPTER NO. 3 : AIRCRAFT SEQUENCING SYSTEMS MARKET FORCES & INDUSTRY PULSE
3.1 Foundations of Change – Market Overview
3.2 Catalysts of Expansion – Key Market Drivers
3.2.1 Momentum Boosters – Growth Triggers
3.2.2 Innovation Fuel – Disruptive Technologies
3.3 Headwinds & Crosswinds – Market Restraints
3.3.1 Regulatory Tides – Compliance Challenges
3.3.2 Economic Frictions – Inflationary Pressures
3.4 Untapped Horizons – Growth Potential & Opportunities
3.5 Strategic Navigation – Industry Frameworks
3.5.1 Market Equilibrium – Porter’s Five Forces
3.5.2 Ecosystem Dynamics – Value Chain Analysis
3.5.3 Macro Forces – PESTEL Breakdown
3.6 Price Trend Analysis
3.6.1 Regional Price Trend
3.6.2 Price Trend by product
CHAPTER NO. 4 : KEY INVESTMENT EPICENTER
4.1 Regional Goldmines – High-Growth Geographies
4.2 Product Frontiers – Lucrative Product Categories
4.3 Application Sweet Spots – Emerging Demand Segments
CHAPTER NO. 5: REVENUE TRAJECTORY & WEALTH MAPPING
5.1 Momentum Metrics – Forecast & Growth Curves
5.2 Regional Revenue Footprint – Market Share Insights
5.3 Segmental Wealth Flow – Type of Aircraft & Application Revenue
CHAPTER NO. 6 : TRADE & COMMERCE ANALYSIS
6.1. Import Analysis by Region
6.1.1. Global Aircraft Sequencing Systems Market Import Revenue By Region
6.2. Export Analysis by Region
6.2.1. Global Aircraft Sequencing Systems Market Export Revenue By Region
CHAPTER NO. 7 : COMPETITION ANALYSIS
7.1. Company Market Share Analysis
7.1.1. Global Aircraft Sequencing Systems Market: Company Market Share
7.2. Global Aircraft Sequencing Systems Market Company Revenue Market Share
7.3. Strategic Developments
7.3.1. Acquisitions & Mergers
7.3.2. New Product Launch
7.3.3. Regional Expansion
7.4. Competitive Dashboard
7.5. Company Assessment Metrics, 2024
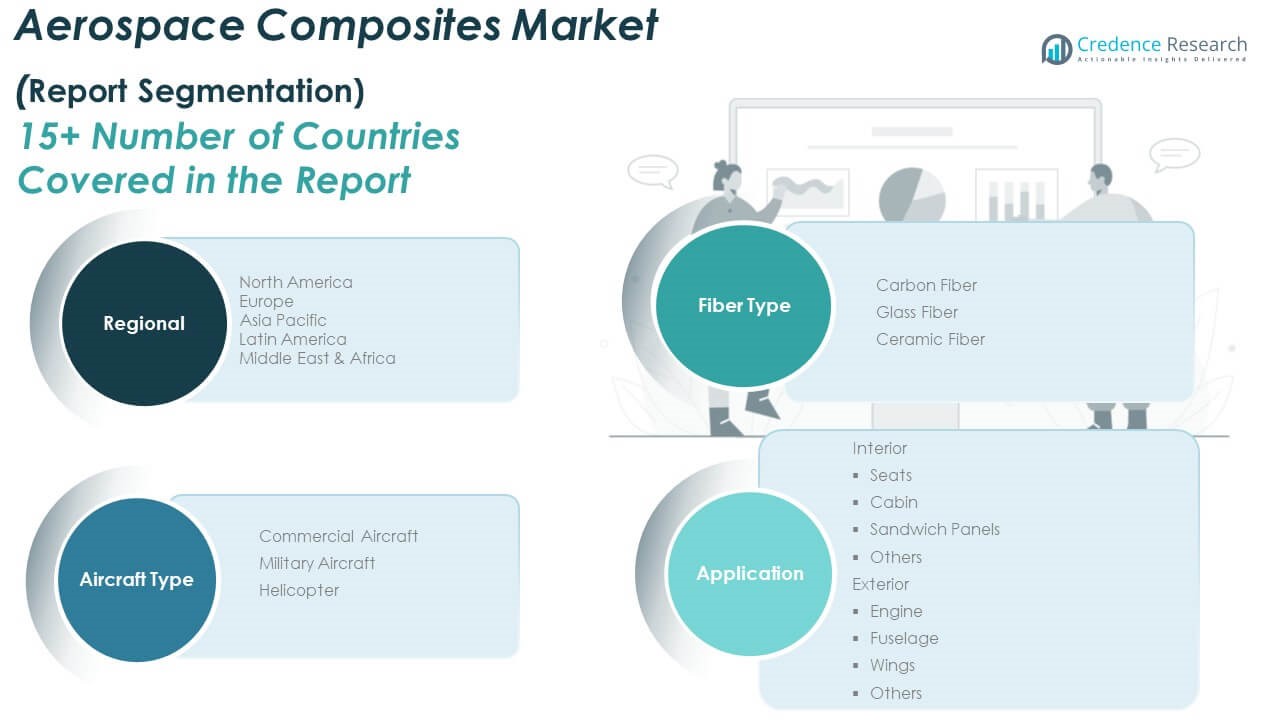
CHAPTER NO. 8 : AIRCRAFT SEQUENCING SYSTEMS MARKET – BY TYPE OF AIRCRAFT SEGMENT ANALYSIS
8.1. Aircraft Sequencing Systems Market Overview by Type of Aircraft Segment
8.1.1. Aircraft Sequencing Systems Market Revenue Share By Type of Aircraft
8.2. Commercial Aircraft
8.3. Military Aircraft
8.4. General Aviation Aircraft
8.5. Unmanned Aerial Vehicles (UAVs)
CHAPTER NO. 9 : AIRCRAFT SEQUENCING SYSTEMS MARKET – BY APPLICATION SEGMENT ANALYSIS
9.1. Aircraft Sequencing Systems Market Overview by Application Segment
9.1.1. Aircraft Sequencing Systems Market Revenue Share By Application
9.2. Flight Scheduling
9.3. Ground Operations Management
9.4. Air Traffic Control Support
9.5. Maintenance and Repair Scheduling
CHAPTER NO. 10 : AIRCRAFT SEQUENCING SYSTEMS MARKET – BY END-USER SEGMENT ANALYSIS
10.1. Aircraft Sequencing Systems Market Overview by End-user Segment
10.1.1. Aircraft Sequencing Systems Market Revenue Share By End-user
10.2. Airlines
10.3. Aerospace Manufacturers
10.4. Airport Authorities
10.5. Government and Defense Organizations
10.6. Others
CHAPTER NO. 11 : AIRCRAFT SEQUENCING SYSTEMS MARKET – BY TECHNOLOGY SEGMENT ANALYSIS
11.1. Aircraft Sequencing Systems Market Overview by Technology Segment
11.1.1. Aircraft Sequencing Systems Market Revenue Share By Technology
11.2. Artificial Intelligence and Machine Learning
11.3. Radio Frequency Identification (RFID)
11.4. Sensor-based Systems
11.5. Cloud-based Solutions
CHAPTER NO. 12 : AIRCRAFT SEQUENCING SYSTEMS MARKET – BY COMPONENTS SEGMENT ANALYSIS
12.1. Aircraft Sequencing Systems Market Overview by Components Segment
12.1.1. Aircraft Sequencing Systems Market Revenue Share By Components
12.2. Hardware
12.3. Software
12.4. Services
12.5. Integration Systems
CHAPTER NO. 13 : AIRCRAFT SEQUENCING SYSTEMS MARKET – REGIONAL ANALYSIS
13.1. Aircraft Sequencing Systems Market Overview by Region Segment
13.1.1. Global Aircraft Sequencing Systems Market Revenue Share By Region
13.1.2. Regions
13.1.3. Global Aircraft Sequencing Systems Market Revenue By Region
13.1.4. Type of Aircraft
13.1.5. Global Aircraft Sequencing Systems Market Revenue By Type of Aircraft
13.1.6. Application
13.1.7. Global Aircraft Sequencing Systems Market Revenue By Application
13.1.8. End-user
13.1.9. Global Aircraft Sequencing Systems Market Revenue By End-user
13.1.10. Technology
13.1.12. Global Aircraft Sequencing Systems Market Revenue By Technology
13.1.13. Components
13.1.14. Global Aircraft Sequencing Systems Market Revenue By Components
CHAPTER NO. 14 : NORTH AMERICA AIRCRAFT SEQUENCING SYSTEMS MARKET – COUNTRY ANALYSIS
14.1. North America Aircraft Sequencing Systems Market Overview by Country Segment
14.1.1. North America Aircraft Sequencing Systems Market Revenue Share By Region
14.2. North America
14.2.1. North America Aircraft Sequencing Systems Market Revenue By Country
14.2.2. Type of Aircraft
14.2.3. North America Aircraft Sequencing Systems Market Revenue By Type of Aircraft
14.2.4. Application
14.2.5. North America Aircraft Sequencing Systems Market Revenue By Application
14.2.6. End-user
14.2.7. North America Aircraft Sequencing Systems Market Revenue By End-user
14.2.8. Technology
14.2.9. North America Aircraft Sequencing Systems Market Revenue By Technology
14.2.10. Components
14.2.11. North America Aircraft Sequencing Systems Market Revenue By Components
14.3. U.S.
14.4. Canada
14.5. Mexico
CHAPTER NO. 15 : EUROPE AIRCRAFT SEQUENCING SYSTEMS MARKET – COUNTRY ANALYSIS
15.1. Europe Aircraft Sequencing Systems Market Overview by Country Segment
15.1.1. Europe Aircraft Sequencing Systems Market Revenue Share By Region
15.2. Europe
15.2.1. Europe Aircraft Sequencing Systems Market Revenue By Country
15.2.2. Type of Aircraft
15.2.3. Europe Aircraft Sequencing Systems Market Revenue By Type of Aircraft
15.2.4. Application
15.2.5. Europe Aircraft Sequencing Systems Market Revenue By Application
15.2.6. End-user
15.2.7. Europe Aircraft Sequencing Systems Market Revenue By End-user
15.2.8. Technology
15.2.9. Europe Aircraft Sequencing Systems Market Revenue By Technology
15.2.10. Components
15.2.11. Europe Aircraft Sequencing Systems Market Revenue By Components
15.3. UK
15.4. France
15.5. Germany
15.6. Italy
15.7. Spain
15.8. Russia
15.9. Rest of Europe
CHAPTER NO. 16 : ASIA PACIFIC AIRCRAFT SEQUENCING SYSTEMS MARKET – COUNTRY ANALYSIS
16.1. Asia Pacific Aircraft Sequencing Systems Market Overview by Country Segment
16.1.1. Asia Pacific Aircraft Sequencing Systems Market Revenue Share By Region
16.2. Asia Pacific
16.2.1. Asia Pacific Aircraft Sequencing Systems Market Revenue By Country
16.2.2. Type of Aircraft
16.2.3. Asia Pacific Aircraft Sequencing Systems Market Revenue By Type of Aircraft
16.2.4. Application
16.2.5. Asia Pacific Aircraft Sequencing Systems Market Revenue By Application
16.2.6. End-user
16.2.7. Asia Pacific Aircraft Sequencing Systems Market Revenue By End-user
16.2.8. Technology
16.2.9. Asia Pacific Aircraft Sequencing Systems Market Revenue By Technology
16.2.10. Components
16.2.11. Asia Pacific Aircraft Sequencing Systems Market Revenue By Components
16.3. China
16.4. Japan
16.5. South Korea
16.6. India
16.7. Australia
16.8. Southeast Asia
16.9. Rest of Asia Pacific
CHAPTER NO. 17 : LATIN AMERICA AIRCRAFT SEQUENCING SYSTEMS MARKET – COUNTRY ANALYSIS
17.1. Latin America Aircraft Sequencing Systems Market Overview by Country Segment
17.1.1. Latin America Aircraft Sequencing Systems Market Revenue Share By Region
17.2. Latin America
17.2.1. Latin America Aircraft Sequencing Systems Market Revenue By Country
17.2.2. Type of Aircraft
17.2.3. Latin America Aircraft Sequencing Systems Market Revenue By Type of Aircraft
17.2.4. Application
17.2.5. Latin America Aircraft Sequencing Systems Market Revenue By Application
17.2.6. End-user
17.2.7. Latin America Aircraft Sequencing Systems Market Revenue By End-user
17.2.8. Technology
17.2.9. Latin America Aircraft Sequencing Systems Market Revenue By Technology
17.2.10. Components
17.2.11. Latin America Aircraft Sequencing Systems Market Revenue By Components
17.3. Brazil
17.4. Argentina
17.5. Rest of Latin America
CHAPTER NO. 18 : MIDDLE EAST AIRCRAFT SEQUENCING SYSTEMS MARKET – COUNTRY ANALYSIS
18.1. Middle East Aircraft Sequencing Systems Market Overview by Country Segment
18.1.1. Middle East Aircraft Sequencing Systems Market Revenue Share By Region
18.2. Middle East
18.2.1. Middle East Aircraft Sequencing Systems Market Revenue By Country
18.2.2. Type of Aircraft
18.2.3. Middle East Aircraft Sequencing Systems Market Revenue By Type of Aircraft
18.2.4. Application
18.2.5. Middle East Aircraft Sequencing Systems Market Revenue By Application
18.2.6. End-user
18.2.7. Middle East Aircraft Sequencing Systems Market Revenue By End-user
18.2.8. Technology
18.2.9. Middle East Aircraft Sequencing Systems Market Revenue By Technology
18.2.10. Components
18.2.11. Middle East Aircraft Sequencing Systems Market Revenue By Components
18.3. GCC Countries
18.4. Israel
18.5. Turkey
18.6. Rest of Middle East
CHAPTER NO. 19 : AFRICA AIRCRAFT SEQUENCING SYSTEMS MARKET – COUNTRY ANALYSIS
19.1. Africa Aircraft Sequencing Systems Market Overview by Country Segment
19.1.1. Africa Aircraft Sequencing Systems Market Revenue Share By Region
19.2. Africa
19.2.1. Africa Aircraft Sequencing Systems Market Revenue By Country
19.2.2. Type of Aircraft
19.2.3. Africa Aircraft Sequencing Systems Market Revenue By Type of Aircraft
19.2.4. Application
19.2.5. Africa Aircraft Sequencing Systems Market Revenue By Application
19.2.6. End-user
19.2.7. Africa Aircraft Sequencing Systems Market Revenue By End-user
19.2.8. Technology
19.2.9. Africa Aircraft Sequencing Systems Market Revenue By Technology
19.2.10. Components
19.2.11. Africa Aircraft Sequencing Systems Market Revenue By Components
19.3. South Africa
19.4. Egypt
19.5. Rest of Africa
CHAPTER NO. 20 : COMPANY PROFILES
20.1. Harris
20.1.1. Company Overview
20.1.2. Product Portfolio
20.1.3. Financial Overview
20.1.4. Recent Developments
20.1.5. Growth Strategy
20.1.6. SWOT Analysis
20.2. Thales Group
20.3. United Technologies (Collins Aerospace)
20.4. Carlyle Group (ADB Safegate)
20.5. Amadeus IT Group
20.6. ATRiCS
20.7. Eurocontrol
20.8. Transoft Solutions
20.9. PASSUR Aerospace