
Aviation Fuel Market Overview:
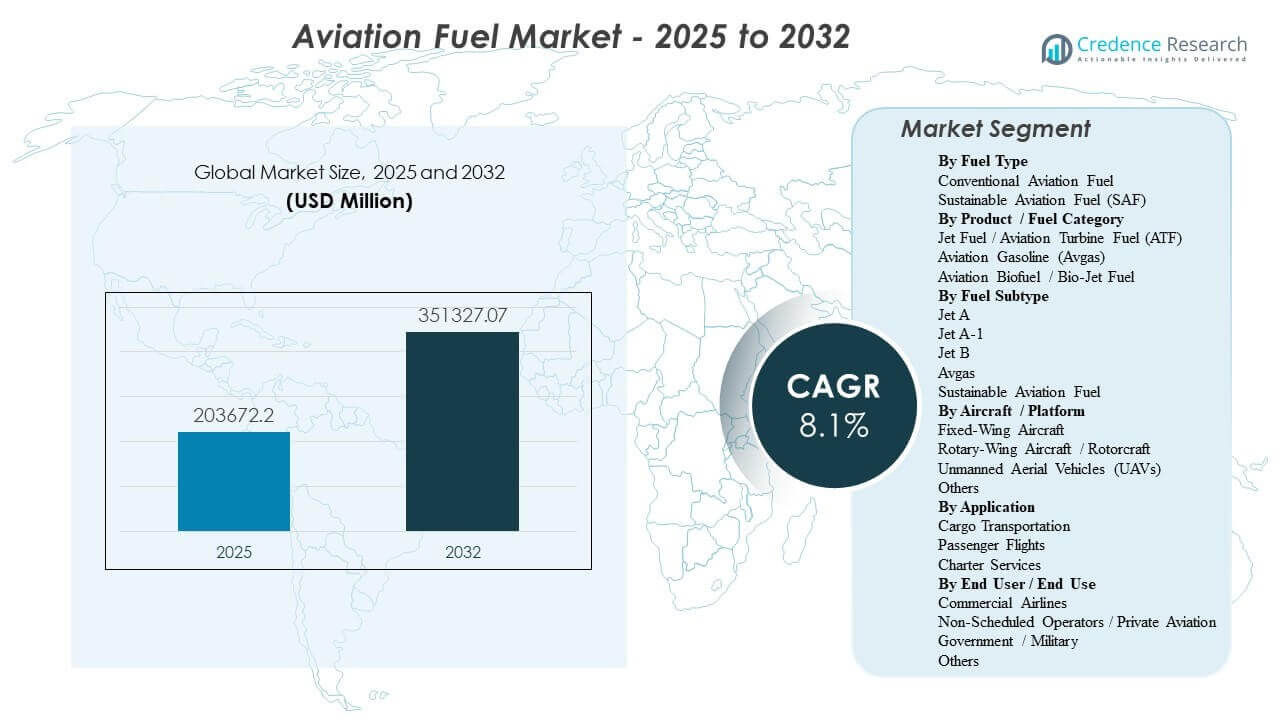
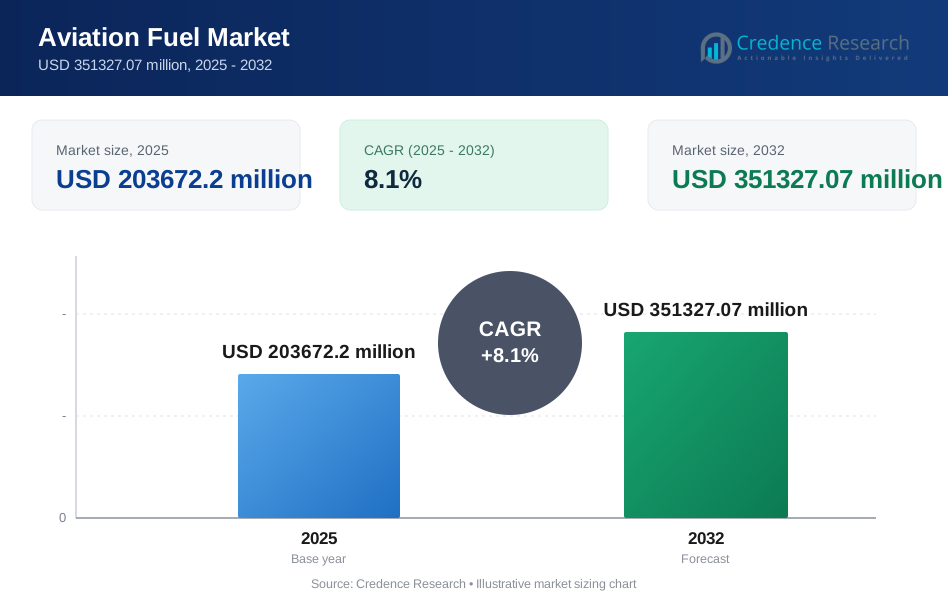
The global Aviation Fuel Market size was estimated at USD 203672.2 million in 2025 and is expected to reach USD 351327.07 million by 2032, growing at a CAGR of 8.1% from 2025 to 2032. Market expansion is primarily driven by sustained growth in passenger and cargo air traffic, which increases jet fuel uplift volumes across major airports and strengthens long-term supply contracting between airlines, fuel suppliers, and airport fuel farms. Asia Pacific remains a central demand engine as route density and fleet utilization rise across key aviation hubs, alongside capacity additions in refining, storage, and hydrant distribution that support higher throughput.
| REPORT ATTRIBUTE | DETAILS |
|---|---|
| Historical Period | 2020-2024 |
| Base Year | 2025 |
| Forecast Period | 2026-2032 |
| Aviation Fuel Market Size 2025 | USD 203672.2 Million |
| Aviation Fuel Market, CAGR | 8.1% |
| Aviation Fuel Market Size 2032 | USD 351327.07 Million |
Key Market Trends & Insights
- The Aviation Fuel Market is projected to expand from USD 203672.2 million in 2025 to USD 351327.07 million by 2032 at an 8.1% CAGR (2025–2032).
- Conventional Aviation Fuel accounted for the largest share of 97.6% in 2025, reflecting continued reliance on established refining and distribution systems.
- Sustainable Aviation Fuel adoption remains early-stage, with 2.4% implied share in 2025 as blending and procurement programs scale from a low base.
- Asia Pacific represented 40.8% of market revenue in 2025, supported by high flight activity growth and expanding airport fueling infrastructure.
- Jet A-1 accounted for the largest share of 70.9% in 2025 among fuel subtypes, supported by broad international standardization and availability.
Segment Analysis
Aviation fuel demand is shaped by a high-volume conventional base and a fast-evolving sustainability overlay. Conventional aviation fuel continues to dominate purchasing behavior because it is universally compatible with current aircraft fleets, supported by deep refinery capacity and standardized airport delivery systems. At the same time, SAF procurement is increasingly visible through long-term offtake agreements and targeted airport availability, though adoption is moderated by cost premiums, limited supply, and uneven blending logistics across regions.
Product and subtype dynamics reinforce this structure. Jet fuel remains the central consumption pool due to the scale of commercial passenger and cargo operations, whereas avgas is structurally limited to piston-engine aircraft in general aviation. Within turbine grades, Jet A-1 leads because it is widely used across international networks and is consistently available at major hubs. Platform and end-user factors further concentrate demand in fixed-wing fleets and commercial airline operations, where flight cycles, route length, and fleet utilization drive the highest fuel burn.
By Fuel Type Insights
Conventional Aviation Fuel accounted for the largest share of 97.6% in 2025. Conventional aviation fuel leadership is reinforced by universal fleet compatibility, established refinery outputs, and mature airport fueling infrastructure that supports reliable supply at scale. Airline procurement practices prioritize continuity and predictable quality standards, which keeps conventional fuel central to uplift planning. SAF growth is supported by decarbonization commitments and mandates, but limited production availability and price premiums constrain near-term penetration.
By Product / Fuel Category Insights
Jet Fuel / Aviation Turbine Fuel (ATF) accounted for the largest share of 98.3% in 2026. Jet fuel dominance is driven by the large installed base of turbine aircraft used in passenger and cargo aviation and the high fuel burn associated with long-haul and high-frequency routes. Airport infrastructure such as hydrant systems and fuel farms is primarily designed around jet fuel throughput, reinforcing operational preference. Avgas remains concentrated in general aviation, and aviation biofuel/bio-jet fuel scales mainly through blending and dedicated supply programs at select airports.
By Fuel Subtype Insights
Jet A-1 accounted for the largest share of 70.9% in 2025. Jet A-1 leadership reflects widespread global standardization and broad availability across international airports, which supports consistent airline operations across multi-country networks. Cold-weather performance and operational familiarity also reinforce Jet A-1 selection for many carriers. Sustainable aviation fuel is the key growth lever within subtypes, expanding as blending capabilities and procurement mechanisms mature.
By Aircraft / Platform Insights
Fixed-Wing Aircraft account for the largest share in the Aviation Fuel Market due to the concentration of passenger and cargo operations within fixed-wing fleets. High route density, longer stage lengths, and higher utilization rates make fixed-wing platforms the primary driver of jet fuel consumption. Rotary-wing demand is important in defense, emergency services, and offshore missions, but overall uplift volumes are smaller due to mission profiles and fleet size. UAV activity is expanding across defense and select commercial applications, but fuel consumption remains comparatively limited versus manned fixed-wing aviation.
By Application Insights
Passenger Flights account for the largest share of aviation fuel demand as scheduled commercial operations generate the highest flight frequency and uplift volumes across major hubs. Network carriers and low-cost carriers both contribute to consumption through high aircraft utilization and broad route coverage. Cargo transportation is a strong structural contributor supported by e-commerce, express logistics, and time-critical supply chains, increasing fuel demand for dedicated freighters and belly cargo on passenger routes. Charter services remain smaller but can show higher SAF participation in select premium corridors and business aviation programs.
By End User / End Use Insights
Commercial Airlines account for the largest share of aviation fuel demand due to high flight cycles, large fleet sizes, and the dominance of turbine aircraft in scheduled operations. Airline procurement models emphasize supply security, pricing discipline, and operational reliability, supporting long-term contracts and integrated airport fuel services. Non-scheduled and private aviation grows through fleet expansion and premium service demand, and it can act as an early adopter segment for SAF via targeted programs. Government and military consumption is shaped by strategic readiness, certification pathways, and fuel standard requirements.
Aviation Fuel Market Drivers
Rising passenger and cargo air traffic growth
Passenger travel recovery and route additions increase flight frequency, uplift volumes, and fuel throughput at large airports. Cargo demand expands alongside e-commerce and time-sensitive logistics, increasing utilization of freighters and belly cargo capacity. Higher fleet utilization tightens operational requirements for reliable fueling infrastructure and storage capacity. Fuel suppliers benefit from long-term contracts and recurring demand patterns tied to airline schedules. In addition, expanding airport slot utilization and higher load factors intensify uplift concentration at major hubs, raising the need for scalable storage and hydrant capacity.
Expanding airline fleets and higher utilization rates
Fleet modernization and capacity additions increase the number of aircraft cycles and total fuel burn, particularly in fast-growing aviation corridors. Wider deployment of fuel-efficient aircraft does not eliminate demand growth because traffic expansion offsets efficiency gains. Growth in narrowbody fleets supports short-haul route density, while widebody deployments sustain long-haul uplift volumes. Higher utilization also increases the importance of robust airport fuel farms and hydrant systems. Moreover, tighter turnaround times make fueling speed and reliability a direct operational performance lever for airlines and airports.
- For instance, Airbus states that the A321neo integrates new-generation engines and Sharklet wingtip devices to deliver 20% less fuel burn and CO2 emissions per seat, while offering a range of up to 4,000 nautical miles and capacity for as many as 244 passengers, enabling airlines to raise cycle counts and seat deployment on dense regional and medium-haul routes.
SAF policy support and decarbonization commitments
Government mandates, airline net-zero targets, and corporate travel programs push procurement of lower-carbon aviation fuels. SAF adoption is accelerated where airports enable blending, storage, and distribution without disrupting conventional fuel logistics. Offtake agreements and book-and-claim mechanisms help aggregate demand and improve purchasing flexibility. These factors support a measurable shift in procurement strategies even when supply remains constrained. Additionally, transparent sustainability reporting and lifecycle emissions accounting are increasing the strategic value of certified SAF volumes in airline procurement.
Upgrades in fueling infrastructure and supply-chain resilience
Investment in pipelines, fuel farms, and hydrant networks improves delivery efficiency, reduces congestion from trucking, and strengthens supply reliability. Integrated digital monitoring and quality assurance processes reduce operational risk and enhance compliance. Infrastructure upgrades also support higher peak throughput during seasonal demand spikes. Supply resilience becomes a competitive differentiator for fuel suppliers serving major hubs and defense customers. Further, redundancy planning and diversified sourcing reduce disruption risk from refinery outages and regional logistics constraints.
- For instance, Exolum said its Lima airport fuel facility includes four tanks with combined capacity of approximately 35,000 m³, seven reception islands with advanced filtration systems, six high-capacity pumps, and a 10-kilometre hydrant network connected to 130 aircraft stand positions, while increasing on-site fuel stock autonomy from two days to eight days.
Aviation Fuel Market Challenges
Aviation fuel markets remain exposed to crude oil volatility and refining margin swings, which can create rapid cost changes for airlines and complicate hedging strategies. Supply chain disruptions, including refinery outages and logistics bottlenecks, can tighten availability and raise spot prices, particularly during peak travel periods. Regulatory compliance requirements across jurisdictions add operational complexity for global suppliers and multi-airport airline networks. Infrastructure constraints at congested hubs can also limit throughput expansion and increase the cost of fueling operations. At the same time, tighter environmental compliance expectations can increase investment needs for suppliers and airports to sustain operational continuity.
SAF scale-up faces structural barriers that slow penetration despite strong policy and corporate momentum. Limited feedstock availability, higher production costs, and constrained refining capacity for SAF pathways can restrict consistent supply. Blending, certification, and accounting systems differ across regions, increasing transaction complexity for airlines operating globally. Price premiums remain a central adoption constraint, especially for cost-sensitive carriers and price-competitive routes. In addition, uneven airport-level availability can fragment sourcing, making it difficult for airlines to scale SAF use consistently across networks.
- For instance, Neste started SAF production at its Rotterdam renewables refinery in April 2025, adding up to 500,000 tons per year of SAF capacity and increasing its global SAF production capability to 1.5 million tons, or around 1.875 billion liters, per year, which shows that even major capacity additions still depend on a limited number of large-scale production assets.
Aviation Fuel Market Trends and Opportunities
Aviation fuel procurement is increasingly shifting toward multi-year agreements that bundle conventional supply, SAF access, and associated airport services under unified contracts. This trend supports predictable supply planning and helps airlines coordinate SAF sourcing across priority hubs. Airports and fuel suppliers are also expanding storage and distribution capabilities to accommodate blended fuels and higher throughput requirements. Greater integration of digital quality tracking improves compliance and reduces fueling delays. Additionally, book-and-claim models are gaining traction as a practical mechanism to expand SAF participation beyond locations with direct physical supply.
- For instance, Shell Aviation, Accenture, and Amex GBT reported that Avelia had enrolled more than 57 corporations and airlines by 31 March 2025, executed over 900 retirements, and enabled the injection of more than 33 million gallons of SAF across 17 airports, with blockchain-based tracking designed to improve transparency and help prevent double counting.
Investment opportunities are strengthening around SAF production capacity, blending logistics, and hub-based distribution readiness. Airlines and corporate travel buyers are expanding voluntary procurement programs that can accelerate early volumes where mandates are still developing. Business aviation and select premium routes can act as early demand pools, helping suppliers validate supply models. Regional infrastructure upgrades, including pipelines and fuel farms, further support market expansion and operational efficiency. Moreover, co-processing, modular SAF facilities, and diversified feedstock strategies can improve supply scalability and reduce unit costs over time.
Regional Insights
North America
North America represented 29.1% of market revenue in 2025, supported by a high frequency of domestic flights, strong cargo networks, and mature airport fueling infrastructure. Demand is reinforced by large hub-and-spoke systems and high aircraft utilization across commercial carriers. Infrastructure depth supports reliable fuel delivery and efficient throughput at major airports. SAF momentum is supported by corporate travel programs and the gradual expansion of supply availability at selected hubs.
Europe
Europe accounted for 19.2% of market revenue in 2025, underpinned by dense short-haul connectivity and strong long-haul linkages through major hub airports. Regional demand is influenced by structured decarbonization programs and increasing emphasis on sustainable aviation fuel integration within airport supply chains. Procurement strategies often reflect compliance readiness and network-wide sourcing consistency. Fuel suppliers compete on service integration, hub coverage, and SAF availability.
Asia Pacific
Asia Pacific led with 40.8% of market revenue in 2025, driven by expanding route networks, rising passenger volumes, and broad fleet growth across key aviation markets. Airport infrastructure development supports higher fuel throughput and improves supply reliability as traffic scales. Strong growth in intra-regional travel and expanding cargo activity reinforce uplift volumes across major hubs. The region’s scale creates significant demand pull for both conventional fuel and emerging SAF procurement programs.
Latin America
Latin America held 3.7% of market revenue in 2025, reflecting a smaller share of global flight activity compared with North America, Europe, and Asia Pacific. Demand is concentrated around leading national carriers and key hub airports that connect regional and long-haul routes. Infrastructure expansion and airline capacity growth support steady uplift increases over time. SAF adoption is emerging through pilot programs and early supply initiatives but remains limited by availability and economics.
Middle East & Africa
Middle East & Africa represented 7.2% of market revenue in 2025, shaped by the Middle East’s role as a global long-haul hub region and Africa’s comparatively smaller aviation base. Long-haul transit operations support high uplift volumes at major hub airports and reinforce demand for reliable fuel logistics. Refining capacity and integrated energy supply chains strengthen supply reliability in key markets. SAF readiness is developing through hub-focused programs and growing emphasis on lower-carbon fuel pathways.
Competitive Landscape
Competition in the Aviation Fuel Market is defined by supply reliability, airport network coverage, pricing discipline, and the ability to provide integrated fueling services across multiple geographies. Major suppliers differentiate through long-term contracts with airlines and airports, investments in storage and hydrant infrastructure, and operational capabilities that ensure consistent on-time fueling performance. The market is also seeing increased strategic focus on SAF access, blending logistics, and traceability frameworks that support compliance and corporate decarbonization requirements. As SAF scales, partnerships and offtake agreements increasingly shape competitive positioning across key hubs.
Exxon Mobil Corporation is positioned as a diversified energy supplier with capabilities spanning refining, distribution, and large-scale fuel supply contracting that supports consistent aviation fuel delivery. The company’s scale supports structured procurement engagement with airline and airport customers seeking long-term reliability. Strategic emphasis is increasingly placed on readiness for evolving fuel specifications and lower-carbon aviation pathways, supported by collaboration across supply chains. This approach aligns operational performance with emerging sustainability-linked procurement requirements in aviation fueling.
The industry research and growth report includes detailed analyses of the competitive landscape of the market and information about key companies, including:
- Exxon Mobil Corporation
- Chevron Corporation
- BP p.l.c. / Air bp
- Shell plc
- TotalEnergies SE
- Indian Oil Corporation Limited
- Bharat Petroleum Corporation Limited
- Abu Dhabi National Oil Company (ADNOC)
- Viva Energy Group
- Avfuel
Qualitative and quantitative analysis of companies has been conducted to help clients understand the wider business environment as well as the strengths and weaknesses of key industry players. Data is qualitatively analyzed to categorize companies as pure play, category-focused, industry-focused, and diversified; it is quantitatively analyzed to categorize companies as dominant, leading, strong, tentative, and weak.
Recent Developments
- In March 2026, Axens and Airbus signed a memorandum of understanding to strengthen cooperation on the development and deployment of sustainable aviation fuel, with the partnership focused on helping scale SAF solutions for the aviation sector.
- In September 2025, launch, Lootah Biofuels announced the introduction of Sustainable Aviation Fuel in the UAE market, making it one of the early local suppliers and marking a notable new product launch in the regional aviation fuel space.
- In February 2025, Boeing and Hindustan Petroleum Corporation Limited (HPCL) joined forces to advance sustainable aviation fuel development in India, highlighting collaboration across the aerospace and energy value chain.
Report Scope
| Report Attribute | Details |
| Market size value in 2025 | USD 203672.2 million |
| Revenue forecast in 2032 | USD 351327.07 million by 2032 |
| Growth rate (CAGR) | 8.1% (2025–2032) |
| Base year | 2025 |
| Forecast period | 2026-2032 |
| Quantitative units | USD million |
| Segments covered | By Fuel Type Outlook: Conventional Aviation Fuel, Sustainable Aviation Fuel (SAF); By Product / Fuel Category Outlook: Jet Fuel / Aviation Turbine Fuel (ATF), Aviation Gasoline (Avgas), Aviation Biofuel / Bio-Jet Fuel; By Fuel Subtype Outlook: Jet A, Jet A-1, Jet B, Avgas, Sustainable Aviation Fuel; By Aircraft / Platform Outlook: Fixed-Wing Aircraft, Rotary-Wing Aircraft / Rotorcraft, Unmanned Aerial Vehicles (UAVs), Others; By Application Outlook: Cargo Transportation, Passenger Flights, Charter Services; By End User / End Use Outlook: Commercial Airlines, Non-Scheduled Operators / Private Aviation, Government / Military, Others** |
| Regional scope | North America, Europe, Asia Pacific, Latin America, Middle East & Africa |
| Key companies profiled | Exxon Mobil Corporation; Chevron Corporation; BP p.l.c. / Air bp; Shell plc; TotalEnergies SE; Indian Oil Corporation Limited; Bharat Petroleum Corporation Limited; Abu Dhabi National Oil Company (ADNOC); Viva Energy Group; Avfuel |
| No. of Pages | 340 |
Segmentation
By Fuel Type
- Conventional Aviation Fuel
- Sustainable Aviation Fuel (SAF)
By Product / Fuel Category
- Jet Fuel / Aviation Turbine Fuel (ATF)
- Aviation Gasoline (Avgas)
- Aviation Biofuel / Bio-Jet Fuel
By Fuel Subtype
- Jet A
- Jet A-1
- Jet B
- Avgas
- Sustainable Aviation Fuel
By Aircraft / Platform
- Fixed-Wing Aircraft
- Rotary-Wing Aircraft / Rotorcraft
- Unmanned Aerial Vehicles (UAVs)
- Others
By Application
- Cargo Transportation
- Passenger Flights
- Charter Services
By End User / End Use
- Commercial Airlines
- Non-Scheduled Operators / Private Aviation
- Government / Military
- Others
By Region
- North America
- U.S.
- Canada
- Mexico
- Europe
- Germany
- France
- U.K.
- Italy
- Spain
- Rest of Europe
- Asia Pacific
- China
- Japan
- India
- South Korea
- South-east Asia
- Rest of Asia Pacific
- Latin America
- Brazil
- Argentina
- Rest of Latin America
- Middle East & Africa
- GCC Countries
- South Africa
- Rest of the Middle East and Africa
Request a Free Sample
Fill in your details and we'll send you a free sample report.
- Sample data tables & charts
- Research methodology
Need a Custom Version of This Report?
Tailor the scope, geography, or segments to your exact requirements.
- Custom geography or segment scope
- Direct access to our analyst team
Frequently Asked Questions
What is the market size of the Aviation Fuel Market in 2025 and what is the forecast for 2032?
What is the CAGR for the Aviation Fuel Market during 2025–2032?
Which fuel type segment is the largest in 2025?
What factors are driving growth in the Aviation Fuel Market?
Who are the leading companies in the Aviation Fuel Market?
Which region leads the Aviation Fuel Market in 2025?
Table of Content
Chapter 1. Report Introduction
- 1.1 Report Description & Purpose
- 1.1.1 Report Title & Market Definition
- 1.1.2 Unique Selling Propositions (USP) & Key Differentiators
- 1.1.3 Value Proposition for Stakeholders
- 1.2 Research Objectives
- 1.2.1 Market Sizing Objectives (Volume & Revenue)
- 1.2.2 Segmentation Objectives
- 1.2.3 Competitive Intelligence Objectives
- 1.2.4 Forecast & Scenario Objectives
- 1.3 Report Scope
- 1.3.1 Aviation Fuel Scope – Types & Subtypes Covered
- 1.3.2 Geographic Scope – Regions & Countries Covered
- 1.3.3 Historical Period, Base Year & Forecast Period (2025; forecast to 2032)
- 1.3.4 Inclusions & Exclusions
- 1.4 HS Code & Classification Framework
- 1.5 Currency, Units & Pricing Basis
- 1.6 Target Stakeholders
- 1.7 Limitations & Assumptions
Chapter 2. Executive Summary
- 2.1 Global Aviation Fuel Market Snapshot
- 2.1.1 Market Size – Historical (2025) & Forecast (2025-2032) (2025: USD 203672.2 million → 2032: USD 351327.07 million)
- 2.1.2 Volume & Revenue – Global Totals
- 2.1.3 Key Market Highlights – Top Five Facts
- 2.2 Aviation Fuel Market Segmentation Snapshot
- 2.2.1 Market Split by Region – 2025 vs. 2032
- 2.3 Competitive Snapshot
- 2.3.1 Top 10 Players by Revenue Share – 2025
- 2.3.2 Top 10 Players by Volume Share – 2025
- 2.3.3 Recent Strategic Developments (18-Month Summary)
- 2.4 Key Investment Highlights & Strategic Conclusions
Chapter 3. Aviation Fuel Market Dynamics & Industry Analysis
- 3.1 Market Overview & Context
- 3.1.1 Aviation Fuel Market Position in the Broader Automotive Value Chain
- 3.1.2 OEM vs. Replacement Market Dynamics
- 3.1.3 Market Maturity & Development Stage by Region
- 3.2 Aviation Fuel Market Drivers
- 3.3 Aviation Fuel Market Restraints & Challenges
- 3.4 Aviation Fuel Market Opportunities
- 3.5 Porter's Five Forces Analysis
- 3.5.1 Threat of New Entrants
- 3.5.2 Bargaining Power of Suppliers
- 3.5.3 Bargaining Power of Buyers
- 3.5.4 Threat of Substitutes
- 3.5.5 Competitive Rivalry – Intensity Assessment
- 3.6 Aviation Fuel Value Chain Analysis
- 3.6.1 Upstream – Raw Material/Input Suppliers
- 3.6.1.1 Raw Material/Input 1
- 3.6.1.2 Raw Material/Input 2
- 3.6.1.3 Raw Material/Input 3
- 3.6.2 Midstream – Production/Manufacturing/Service Delivery
- 3.6.2.1 Production/Process Overview
- 3.6.2.2 Key Facility Locations & Capacity by Manufacturer
- 3.6.3 Downstream – Distribution & End Consumer
- 3.6.3.1 Primary Channel – B2B/OEM
- 3.6.3.2 Secondary Channels – Dealer, Retail, Online, Direct
- 3.6.4 Value Chain Profitability Analysis
- 3.6.1 Upstream – Raw Material/Input Suppliers
- 3.7 PESTEL Analysis
- 3.7.1 Political Factors
- 3.7.2 Economic Factors
- 3.7.3 Social Factors
- 3.7.4 Technological Factors
- 3.7.5 Environmental Factors
- 3.7.6 Legal Factors
- 3.8 Aviation Fuel Supply Chain Analysis
- 3.8.1 Raw Material/Input Supply Risk Assessment
- 3.8.2 Manufacturing Concentration Risk (Geographic Exposure)
- 3.8.3 Trade Disruption Impact Analysis
- 3.9 Regulatory & Policy Landscape
Note: The regulatory and policy landscape section covers regulations based on their applicability to the market, Aviation Fuel category, geography, and scope of the study. Only regulatory frameworks with a material impact on operations, compliance, trade, sustainability, or market access are analyzed in detail.
Chapter 4. Key Investment Pockets & Opportunity Analysis
- 4.1 Aviation Fuel Market Attractiveness Analysis
- 4.1.1 By Region – Investment Attractiveness Matrix (Volume × CAGR)
- 4.2 Absolute Revenue Growth Opportunity
- 4.2.1 By Region – Absolute USD Growth Through 2032
- 4.3 Incremental Volume Opportunity
- 4.3.1 By Region – Incremental Volume Through 2032
- 4.3.2 Segment – Incremental Volume
- 4.4 Emerging Submarket Opportunity Deep Dive (Subject to Applicability)
- 4.5 Emerging Market Opportunity Scorecards
- 4.5.1 United States
- 4.5.2 Europe
- 4.5.3 Asia
- 4.5.4 Middle East & Africa
Note: Emerging Market Opportunity Scorecards will be included based on relevance and strategic importance. Regions listed are indicative and may vary depending on data availability and market dynamics.
Chapter 5. Aviation Fuel Import-Export Analysis & Trade Flows
- 5.1 Global Trade Overview
- 5.1.1 Global Export Value by Country (2025)
- 5.1.2 Global Export Volume by Country (2025)
- 5.1.3 Global Import Value by Country (2025)
- 5.1.4 Global Import Volume by Country (2025)
- 5.1.5 Net Trade Balance by Country (2025)
- 5.2 Export Analysis – Segment
- 5.2.1 Type 1 (HS Code)
- 5.2.2 Type 2 (HS Code)
- 5.2.3 Type 3 (HS Code)
- 5.2.4 Type 4 (HS Code)
- 5.2.5 Type 5 (HS Code)
- 5.3 Import Analysis – Segment
- 5.3.1 Type 1 (HS Code)
- 5.3.2 Type 2 (HS Code)
- 5.3.3 Type 3 (HS Code)
- 5.3.4 Type 4 (HS Code)
- 5.3.5 Type 5 (HS Code)
- 5.4 Average Unit Trade Prices
- 5.4.1 Average Export Price – Segment & Country
- 5.4.2 Average Import Price – Segment & Source Country
- 5.4.3 Price Trends (2025)
- 5.5 Key Trade Route Analysis
- 5.5.1 Trade Route 1
- 5.5.2 Trade Route 2
- 5.5.3 Trade Route 3
- 5.5.4 Trade Route 4
- 5.5.5 Trade Route 5
- 5.6 Trade Policy Impact Assessment
- 5.6.1 US Anti-Dumping & Section 301 Tariffs
- 5.6.2 EU Customs Union Impact
- 5.6.3 Major Free Trade Agreements
- 5.6.4 USMCA Rules of Origin
Note: Trade policy analysis will be included only where relevant to the Aviation Fuel market.
Chapter 6. Competitive Landscape & Company Benchmarking
- 6.1 Aviation Fuel Market Concentration & Structure
- 6.1.1 Herfindahl-Hirschman Index (HHI) – vs. 2025
- 6.1.2 Tier 1, Tier 2 & Tier 3 Market Structure
- 6.1.3 Global, Regional & Local Player Dynamics
- 6.2 Aviation Fuel Market Share Analysis – 2025
- 6.2.1 Global Revenue Share by Company
- 6.2.2 Global Volume Share by Company
- 6.2.3 Regional Revenue Share
- 6.2.4 Market Share Evolution ( vs. 2025)
- 6.2.5 OEM Segment Share by Company
- 6.2.6 Replacement Segment Share by Company
- 6.3 Production/Delivery Capacity & Facility Analysis
- 6.3.1 Global Installed Capacity
- 6.3.2 Capacity Utilization Rates
- 6.3.3 Production/Output Volume
- 6.3.4 Facility Locations & Capacity Map
- 6.3.5 Planned Capacity Additions
- 6.4 Aviation Fuel Competitive Benchmarking Matrix
- 6.4.1 Revenue, Volume, CAGR & Profitability Comparison
- 6.4.2 Channel Revenue Mix
- 6.4.3 Geographic Revenue Exposure
- 6.4.4 R&D Intensity
- 6.4.5 Sustainability Maturity
- 6.5 Strategic Developments in Aviation Fuel (Last 24 Months)
- 6.5.1 Mergers, Acquisitions & Divestments
- 6.5.2 New Aviation Fuel Launches
- 6.5.3 Facility Expansions
- 6.5.4 Strategic Alliances, Joint Ventures & Partnerships
- 6.5.5 Distribution Expansion & Market Entry
- 6.5.6 Sustainability & ESG Initiatives
- 6.6 Competitive Strategy Mapping
- 6.6.1 Leader, Challenger, Follower & Niche Classification
- 6.6.2 Pricing Strategy Comparison
- 6.6.3 Channel Strategy Matrix
Note: Strategic developments are included based on their materiality and the availability of reliable information.
Chapter 7. Global Aviation Fuel Market – By Distribution Channel
- 7.1 Segment Overview
- 7.1.1 Volume & Revenue Split by Channel (2025 & 2032)
- 7.1.2 Channel Mix Evolution (2025-2032)
Chapter 8. Regional Market Analysis – Global Overview
- 8.1 Global Regional Overview
- 8.1.1 Regional Volume Share
- 8.1.2 Regional Revenue Share
- 8.1.3 Regional Volume by Region
- 8.1.4 Regional Revenue by Region
- 8.1.5 Regional Forecast Through 2032
- 8.2 Cross-Regional Segment Analysis
- 8.2.1 By Distribution Channel
- 8.2.2 By Brand/Price Tier
Chapter 9. North America Aviation Fuel Market
- 9.1 United States
- 9.2 Canada
- 9.3 Mexico
Chapter 10. Europe Aviation Fuel Market
- 10.1 Germany
- 10.2 France
- 10.3 Italy
- 10.4 United Kingdom
- 10.5 Spain
- 10.6 Poland
- 10.7 Russia
- 10.8 Netherlands
- 10.9 Belgium
- 10.10 Sweden
- 10.11 Denmark
- 10.12 Norway
- 10.13 Rest of Europe
Chapter 11. Asia Pacific Aviation Fuel Market
- 11.1 China
- 11.2 India
- 11.3 Japan
- 11.4 South Korea
- 11.5 Thailand
- 11.6 Indonesia
- 11.7 Vietnam
- 11.8 Malaysia
- 11.9 Australia
- 11.10 Rest of Asia Pacific
Chapter 12. Latin America Aviation Fuel Market
- 12.1 Brazil
- 12.2 Argentina
- 12.3 Colombia
- 12.4 Chile
- 12.5 Rest of Latin America
Chapter 13. Middle East Aviation Fuel Market
- 13.1 Saudi Arabia
- 13.2 United Arab Emirates
- 13.3 Turkey
- 13.4 Israel
- 13.5 Iran
- 13.6 Rest of the Middle East
Chapter 14. Africa Aviation Fuel Market
- 14.1 South Africa
- 14.2 Egypt
- 14.3 Nigeria
- 14.4 Morocco
- 14.5 Rest of Africa
Chapter 15. Aviation Fuel Company Profiles
- 15.1 [Company 01]
- 15.1.1 Company Overview
- 15.1.2 Key Management Personnel
- 15.1.3 Products & Services Portfolio
- 15.1.4 Financial Performance
- 15.1.5 Key Market Focus & Geographic Presence
- 15.1.6 Recent Developments & Strategic Initiatives
Note: The company profile list is preliminary and may change based on research findings, market developments, data availability, and client requirements.
Chapter 16. Appendices
- Appendix A – List of Abbreviations & Acronyms
- Appendix B – Industry Classification Code Reference – Full Series
- Appendix C – Production & Capacity Data Tables
- Appendix D – End-Use & Demand Base Tables
- Appendix E – Consumption & Replacement Rate Assumptions
- Appendix F – ASP Reference Tables
- Appendix G – Manufacturing & Facility Database
- Appendix H – Import-Export Data Tables
- Appendix I – Regulatory Summary Tables
- Appendix J – Primary Research Participant List (Anonymized)
- Appendix K – Primary Research Questionnaire Framework
- Appendix L – Data Sources & Bibliography
- Appendix M – Market Size Divergence & Source Comparison
Chapter 17. Research Methodology
- 17.1 Research Framework & Philosophy
- 17.2 Secondary Research – Sources, Hierarchy & Data Extraction
- 17.3 Data Modeling – Bottom-Up & Top-Down Market Sizing
- 17.4 Primary Research – Stakeholder Framework, LOI & Sample Sizes
- 17.5 Forecast Methodology – Regression, Scenario & Sensitivity Analysis
- 17.6 Quality Control – Four-Layer Validation Framework
- 17.7 Limitations & Standard Assumptions
- 17.8 Disclaimer
