Market Overview:
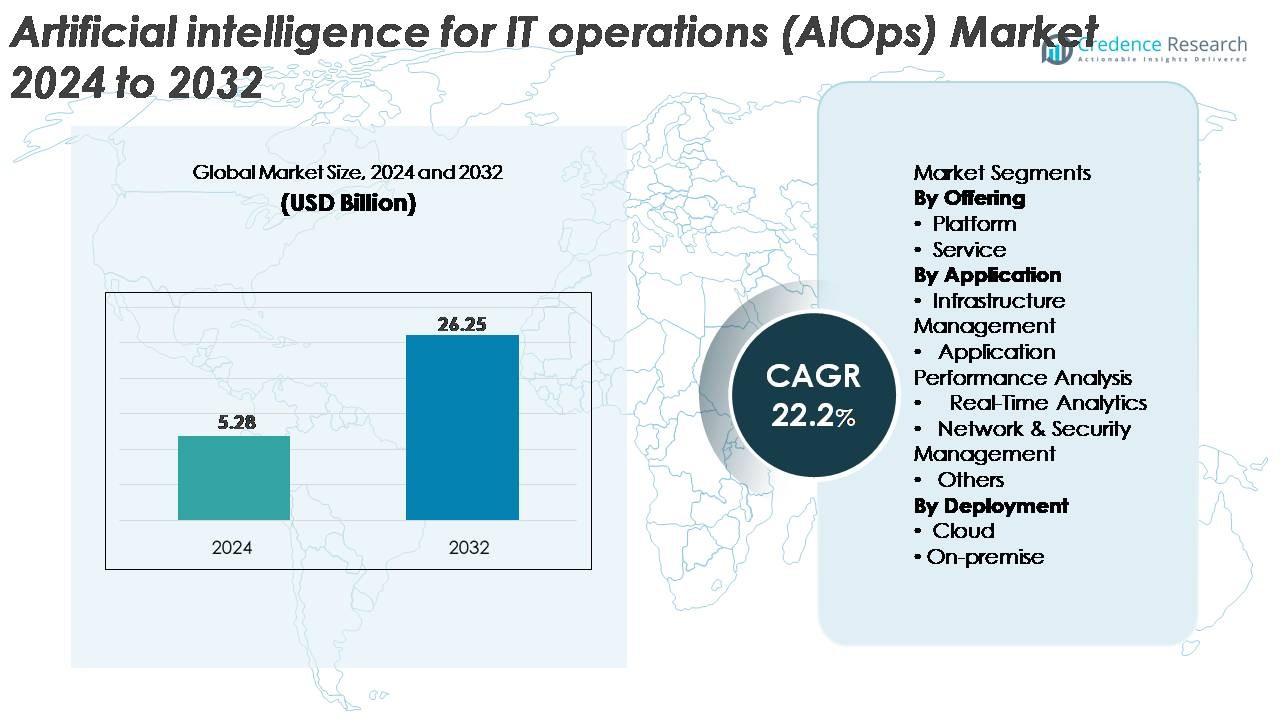
The global Artificial Intelligence for IT Operations (AIOps) market was valued at USD 5.28 billion in 2024 and is projected to reach USD 26.25 billion by 2032, reflecting a strong CAGR of 22.2% over the forecast period.
| REPORT ATTRIBUTE |
DETAILS |
| Historical Period |
2020-2023 |
| Base Year |
2024 |
| Forecast Period |
2025-2032 |
| Artificial Intelligence for IT Operations (AIOps) market Size 2024 |
USD 5.28 Billion |
| Artificial Intelligence for IT Operations (AIOps) market , CAGR |
22.2% |
| Artificial Intelligence for IT Operations (AIOps) market Size 2032 |
USD 26.25 Billion |
The AIOps market is shaped by a strong mix of global technology leaders and specialized AI-driven platform providers, with companies such as Moogsoft, AppDynamics, Broadcom, Resolve Systems, HCL Technologies, ProphetStor Data Services, Splunk Inc., BMC Software, IBM Corporation, and Micro Focus driving competitive innovation. These players expand their portfolios through integrated observability, machine-learning automation, and GenAI-enabled incident management solutions. North America leads the global market with approximately 38% share, supported by mature cloud ecosystems and early enterprise adoption of AI-powered IT operations. Europe and Asia-Pacific follow, benefiting from rapid digital transformation and rising demand for predictive monitoring across large, distributed IT environments.
Access crucial information at unmatched prices!
Request your sample report today & start making informed decisions powered by Credence Research Inc.!
Download Sample
Market Insights:
- The global Artificial Intelligence for IT Operations (AIOps) market reached USD 5.28 billion in 2024 and is projected to hit USD 26.25 billion by 2032, growing at a CAGR of 22.2% during the forecast period.
- Rapid digital transformation, rising IT complexity, and the need for automated incident detection continue to drive adoption, with platform-based AIOps solutions holding the largest segment share due to their unified analytics and end-to-end observability capabilities.
- Key trends include the integration of generative AI, expanding observability platforms, and increased alignment with DevOps and SecOps to deliver predictive insights and autonomous remediation workflows.
- Competitive intensity remains high as players such as IBM, Splunk, Broadcom, Moogsoft, and BMC enhance ML models, expand cloud-native features, and pursue strategic partnerships, while cost, skill shortages, and data integration challenges act as notable restraints.
- Regionally, North America leads with ~38% share, followed by Europe at ~27% and Asia-Pacific at ~24%, supported by strong cloud adoption and rising investment in intelligent IT automation.
Market Segmentation Analysis:
By Offering
The platform segment dominates the AIOps market, accounting for the largest share due to its ability to unify data ingestion, event correlation, observability, and automated incident response within a single ecosystem. Enterprises prefer integrated platforms over standalone services because they deliver faster root-cause analysis and continuous performance optimization across hybrid IT stacks. The rising complexity of cloud-native environments and microservices architecture further drives adoption of platforms that provide end-to-end visibility and predictive analytics. Services continue to grow steadily as organizations seek consulting, customization, and managed operations to accelerate AIOps integration.
- For instance, AIOps platforms are designed to manage the increasing complexity of IT environments and the massive data volumes generated by modern cloud-native systems.
By Application
Infrastructure management represents the leading application segment, holding the highest market share as IT teams increasingly rely on AIOps to monitor servers, storage, networks, and cloud resources in real time. The surge in distributed environments and multi-cloud adoption amplifies the need for automated anomaly detection and capacity forecasting. Application performance analysis also expands rapidly as DevOps teams integrate AIOps into CI/CD pipelines to minimize latency and improve user experience. Real-time analytics and network & security management are gaining traction, driven by the demand for proactive threat detection and operational resilience across digital ecosystems.
- For instance, Dynatrace reports its Davis AI engine analyzing more than 900 billion dependencies daily across microservices environments, Splunk Observability Cloud ingests over 50 terabytes of telemetry per day, Cisco’s threat-intelligence stack processes more than 400 billion security events every 24 hours, and Broadcom’s DX AIOps platform correlates upward of 700 billion performance and event data points monthly.
By Deployment
Cloud deployment leads the AIOps market with the dominant share, supported by its scalability, rapid deployment capabilities, and ability to process vast telemetry data generated by modern digital infrastructures. Organizations adopting cloud-native and container-based architectures favor cloud AIOps solutions for flexibility and minimal maintenance overhead. The model’s strong alignment with global digital transformation initiatives further accelerates adoption. On-premise deployment retains relevance among highly regulated industries requiring strict data governance and control. However, hybrid models are emerging as enterprises balance security, cost, and operational agility across diverse IT workloads.
Key Growth Drivers:
Rising IT Infrastructure Complexity and Need for Automated Operations
The rapid expansion of hybrid and multi-cloud environments is a major driver for AIOps adoption, as enterprises struggle to manage increasingly fragmented IT ecosystems. Modern digital workloads generate enormous volumes of logs, metrics, and traces, making manual monitoring ineffective and slow. AIOps platforms address this challenge by applying machine learning, pattern recognition, and automated correlation to ensure real-time visibility across dynamic environments. Organizations also leverage AIOps to reduce mean time to detect (MTTD) and mean time to resolve (MTTR) incidents, improving service reliability and operational continuity. As businesses scale microservices architectures, containerized deployments, and distributed applications, AIOps becomes essential for proactive anomaly detection, capacity planning, and automated remediation. This demand intensifies as digital transformation initiatives elevate performance expectations and require greater operational resilience.
- For instance, Dynatrace’s Davis AI analyzes over 900 billion application and infrastructure dependencies daily, Splunk Observability Cloud ingests more than 50 terabytes of telemetry every day, Cisco’s SecureX processes upward of 400 billion security events per 24 hours, Google’s Borg cluster orchestrates over 10,000 container tasks per second, and Netflix’s Atlas telemetry engine records more than 2.5 billion metric updates each minute demonstrating the unprecedented operational scale AIOps must manage.
Growing Adoption of Cloud-Native and DevOps Practices
Enterprises adopting DevOps, site reliability engineering (SRE), and cloud-native development increasingly rely on AIOps to support faster release cycles and continuous service availability. DevOps teams use AIOps to correlate code changes with performance events, streamline debugging, and reduce deployment risks. In cloud-native environments, where microservices and Kubernetes clusters operate at large scale, AIOps tools help teams understand interdependencies and detect issues before they cause outages. The shift toward infrastructure-as-code and automation frameworks further boosts AIOps integration, as organizations seek AI-driven insights to maintain operational efficiency. Continuous delivery environments generate complex telemetry patterns, making AIOps critical for predicting performance deviations and preventing bottlenecks. As enterprises deploy more serverless computing, API-driven workloads, and distributed architectures, AIOps emerges as a foundational layer enabling end-to-end observability and automated decision-making.
- For instance, GitHub records more than 300 million code push events daily across CI/CD pipelines, Google’s Kubernetes Engine manages over 4 billion container restarts per week across global workloads, AWS Lambda executes more than 3.5 billion serverless invocations per hour, Dynatrace’s Davis AI processes upward of 9 trillion application dependencies monthly, and Netflix’s Spinnaker executes over 7,000 automated deployments per day demonstrating the operational scale where AIOps is now indispensable.
Increasing Enterprise Focus on Cost Optimization and Operational Efficiency
Cost optimization is becoming a strategic priority for large IT organizations facing escalating cloud spending, rising maintenance needs, and heavy resource utilization. AIOps platforms help reduce operational overhead by automating routine tasks such as log analysis, capacity allocation, incident triage, and system health monitoring. This shift significantly lowers human intervention and minimizes downtime, translating into measurable cost savings. Predictive analytics within AIOps solutions assist organizations in optimizing cloud consumption, rightsizing compute resources, and identifying unused or underutilized assets. Additionally, AIOps-driven insights improve SLA management by ensuring consistent service performance while reducing the burden on IT operations teams. As enterprises aim to balance budget constraints with high service reliability, AIOps emerges as a key enabler for intelligent cost governance, energy efficiency, and streamlined operations across complex digital environments.
Key Trends & Opportunities:
Expansion of Observability-Led AIOps and Unified Monitoring Platforms
A major trend shaping the market is the convergence of observability and AIOps into unified platforms that deliver comprehensive visibility across modern IT systems. Organizations increasingly replace isolated monitoring tools with integrated solutions that aggregate logs, metrics, traces, APIs, and events in real time. This trend creates opportunities for vendors offering AI-enhanced observability layers capable of identifying deep-rooted dependencies and predicting failures. As user experience becomes a competitive differentiator, unified AIOps platforms help enterprises safeguard application performance and accelerate root-cause analysis. The rise of distributed cloud networks, edge computing, and 5G further elevates demand for intelligent observability solutions that support continuous performance optimization. Vendors integrating predictive analytics, topology mapping, and cross-domain correlation stand to benefit significantly.
- For instance, Datadog reports ingesting more than 2.5 trillion log events per month across customer infrastructures, Dynatrace’s Grail engine stores and processes over 500 billion logs and traces daily, Splunk Observability Cloud captures more than 50 terabytes of telemetry per day, New Relic’s telemetry pipeline processes over 1.2 billion data points per minute, Cisco’s AppDynamics tracks more than 3.5 billion business transactions per second globally, and Cloudflare analyzes more than 45 million HTTP requests every second highlighting the extraordinary data scale unified observability-AIOps platforms are built to manage.
Adoption of GenAI and Large Language Models (LLMs) in IT Operations
Generative AI and LLM-driven automation are reshaping the AIOps landscape, enabling more intuitive and autonomous IT operations. LLM-integrated AIOps platforms can summarize incidents, recommend remediation steps, draft RCA reports, and interpret complex system telemetry using natural language. This significantly reduces cognitive load for IT teams and accelerates decision-making. GenAI-based automation also opens opportunities for conversational troubleshooting, intelligent runbooks, and self-healing workflows that minimize manual intervention. As enterprises invest in AI copilots and autonomous IT assistants, AIOps vendors that embed GenAI capabilities into their platforms are gaining a competitive advantage. The trend enhances both operational productivity and cross-functional collaboration in cloud, DevOps, and SRE environments.
- For instance, Microsoft disclosed that its Azure AI infrastructure processes more than 1.8 trillion token operations per day across enterprise copilots, Google’s Gemini models operate on clusters exceeding 26,000 TPU v5e chips for real-time inference workloads, IBM’s watsonx assistant automates over 14 million IT service interactions per month in enterprise deployments, and AWS Bedrock logs more than 12 billion model-invocation requests monthly across operational automation use cases demonstrating the scale at which GenAI is entering IT operations.
Growing Demand for Security-AIOps Convergence
The convergence of AIOps with security operations (SecOps) is creating new market opportunities as cyberthreats become more sophisticated and frequent. Security-AIOps platforms correlate infrastructure data with threat intelligence feeds to detect anomalies, prevent lateral movement, and automate incident responses. Organizations adopting zero-trust architectures increasingly rely on AI-driven insights to identify suspicious activity in real time and mitigate risks faster. The integration of AIOps with SIEM, SOAR, and XDR solutions enhances cross-domain visibility and improves response precision. As hybrid networks expand attack surfaces, the demand for AIOps platforms with embedded security analytics is expected to rise significantly.
Key Challenges:
Data Quality, Integration Complexity, and Model Training Limitations
AIOps relies heavily on high-quality, structured, and comprehensive datasets, yet many organizations struggle with fragmented data sources and inconsistent logging practices. Integrating logs, metrics, traces, and events from legacy systems, on-premise assets, and multi-cloud platforms creates operational barriers and slows AIOps deployment. Poor data hygiene affects model training accuracy, leading to false positives or incomplete insights. Additionally, organizations face challenges in building accurate baselines for anomaly detection due to highly dynamic workloads. These obstacles increase the time required to realize value from AIOps and demand strong governance frameworks to ensure data completeness and reliability.
Skill Gaps, High Implementation Costs, and Change Management Issues
Implementing AIOps requires specialized skills in data science, ML operations, observability engineering, and automation workflows capabilities many organizations lack. The shortage of trained professionals hinders adoption and increases dependency on third-party service providers. High upfront costs for platform integration, customization, and ongoing maintenance further challenge enterprises with limited budgets. Resistance to automation within IT teams and concerns over job displacement also slow AIOps implementation. Effective change management, workforce training, and gradual adoption strategies are essential to overcome these barriers and ensure successful AIOps deployment.
Regional Analysis:
North America
North America leads the AIOps market with approximately 38% share, driven by early adoption of cloud technologies, strong digital transformation initiatives, and the presence of major AIOps vendors. Enterprises across BFSI, telecom, retail, and healthcare increasingly deploy AIOps to enhance observability, optimize hybrid IT operations, and automate incident response. The U.S. remains the primary contributor, supported by high AI innovation spending and rapid integration of GenAI-driven IT automation. Growing dependence on cloud-native architectures and complex IT environments solidifies North America’s position as the largest and most mature market for AIOps solutions.
Europe
Europe accounts for around 27% of the global AIOps market, supported by strong regulatory frameworks emphasizing service reliability, cybersecurity, and operational resilience. Countries such as Germany, the U.K., and France accelerate adoption as enterprises modernize IT infrastructure and integrate AIOps into hybrid cloud governance models. Growing digitalization across manufacturing, energy, and banking fuels demand for predictive monitoring and automated anomaly detection. The region’s focus on compliance-driven automation and real-time visibility strengthens platform uptake. With rising investments in AI and observability, Europe continues to expand its footprint in the global AIOps landscape.
Asia-Pacific
Asia-Pacific captures roughly 24% of the AIOps market and represents the fastest-growing region due to rapid cloud migration, large-scale digital ecosystems, and increasing enterprise automation needs. Major economies such as China, India, Japan, and South Korea deploy AIOps to manage high-volume, distributed IT environments across telecom, financial services, and e-commerce sectors. The region’s acceleration in containerized workloads, microservices, and 5G networks boosts demand for unified monitoring and real-time analytics. With rising technology investment and a digitally skilled workforce, Asia-Pacific continues to gain market share at an aggressive pace.
Latin America
Latin America holds about 6% of the AIOps market, with steady adoption driven by digital modernization initiatives across banking, telecom, manufacturing, and public-sector organizations. Brazil and Mexico lead the region as enterprises increasingly implement cloud-based AIOps platforms to improve operational performance, reduce downtime, and enhance service reliability. Expanding hybrid IT environments and growing demand for real-time analytics support market growth. Despite challenges such as limited technical expertise and budget constraints, the region’s digital-first shift and rising AI investments continue to strengthen AIOps adoption acoss key industries.
Middle East & Africa
The Middle East & Africa region accounts for nearly 5% of the AIOps market, with adoption gradually rising as organizations modernize IT systems and adopt intelligent automation. Countries like the UAE, Saudi Arabia, and South Africa drive regional momentum through national digital transformation programs and expanding cloud infrastructure. Demand is increasing in sectors such as government, telecom, oil & gas, and financial services, where real-time monitoring and predictive insights are critical. Although challenges persist due to skill shortages and uneven digital maturity, continued investment in smart technologies supports long-term regional growth.
Market Segmentations:
By Offering
By Application
- Infrastructure Management
- Application Performance Analysis
- Real-Time Analytics
- Network & Security Management
- Others
By Deployment
By Geography
- North America
- Europe
- Germany
- France
- U.K.
- Italy
- Spain
- Rest of Europe
- Asia Pacific
- China
- Japan
- India
- South Korea
- South-east Asia
- Rest of Asia Pacific
- Latin America
- Brazil
- Argentina
- Rest of Latin America
- Middle East & Africa
- GCC Countries
- South Africa
- Rest of the Middle East and Africa
Competitive Landscape:
The AIOps market features a competitive landscape driven by established technology vendors, cloud service providers, and fast-growing AI-native platforms. Leading companies focus on expanding observability capabilities, embedding generative AI, and strengthening automation across hybrid and multi-cloud environments. Major players emphasize platform consolidation, integrating log analytics, event correlation, and real-time telemetry to deliver unified IT operations. Strategic initiatives include partnerships with hyperscalers, acquisitions of analytics and monitoring startups, and development of self-healing workflows that enhance operational resilience. Vendors also differentiate through industry-specific solutions supporting BFSI, telecom, and healthcare digitalization. As enterprises prioritize intelligent automation, market competition intensifies around advanced ML models, LLM-assisted operations, and predictive analytics engines. Continuous innovation, scalability, and ecosystem integration remain key success factors driving leadership in the global AIOps market.
Shape Your Report to Specific Countries or Regions & Enjoy 30% Off!
Key Player Analysis:
- Moogsoft
- AppDynamics
- Broadcom
- Resolve Systems
- HCL Technologies Limited
- ProphetStor Data Services, Inc.
- Splunk Inc.
- BMC Software, Inc.
- IBM Corporation
- Micro Focus
Recent Developments:
- In October 2025, Broadcom announced a strategic collaboration with OpenAI to co-develop custom AI accelerators and network systems, marking a significant step in AI infrastructure for IT operations capabilities.
- In June 2025, HCL Technologies forged a strategic alliance with AMD to develop future-ready AI solutions, enhancing AIOps through joint innovation labs and training for enterprise digital transformation.
- In February 2023, ProphetStor secured U.S. Patent No. 11579933 for its multi-layer correlation method for resource prediction and management a milestone for its AIOps platform Federator.ai.
- In February 2022, a new AI platform service called Singularity, developed by Microsoft, was unveiled to support the collaboration of hundreds or even thousands of GPUs and AI accelerators. All of the devices are treated as a single cluster by the infrastructure service. This makes sure that no resources are wasted and that every gadget is utilized to its fullest.
Report Coverage:
The research report offers an in-depth analysis based on Offering, Application, Deployment and Geography. It details leading market players, providing an overview of their business, product offerings, investments, revenue streams, and key applications. Additionally, the report includes insights into the competitive environment, SWOT analysis, current market trends, as well as the primary drivers and constraints. Furthermore, it discusses various factors that have driven market expansion in recent years. The report also explores market dynamics, regulatory scenarios, and technological advancements that are shaping the industry. It assesses the impact of external factors and global economic changes on market growth. Lastly, it provides strategic recommendations for new entrants and established companies to navigate the complexities of the market.
Future Outlook:
- AIOps will evolve toward fully autonomous IT operations, reducing manual intervention across incident detection, triage, and remediation.
- Generative AI and LLM-driven copilots will become standard features, enabling conversational troubleshooting and faster decision-making.
- Unified observability platforms will integrate deeper analytics, correlating logs, metrics, traces, and events into real-time, cross-domain insights.
- Cloud-native AIOps adoption will accelerate as enterprises expand Kubernetes, microservices, and containerized workloads.
- Security and AIOps convergence will strengthen, enabling faster threat detection and automated risk mitigation.
- Predictive analytics will play a larger role in capacity planning, cost governance, and performance optimization.
- Industry-specific AIOps solutions will gain traction across BFSI, telecom, healthcare, and manufacturing.
- Edge computing growth will fuel demand for AIOps models capable of monitoring distributed, latency-sensitive environments.
- Integration with DevOps and SRE workflows will deepen, supporting continuous delivery and resilient deployments.
- Vendor competition will intensify, driven by ecosystem partnerships, platform consolidation, and AI-first product innovation.


