
Autism Spectrum Disorders Treatment Market Overview:
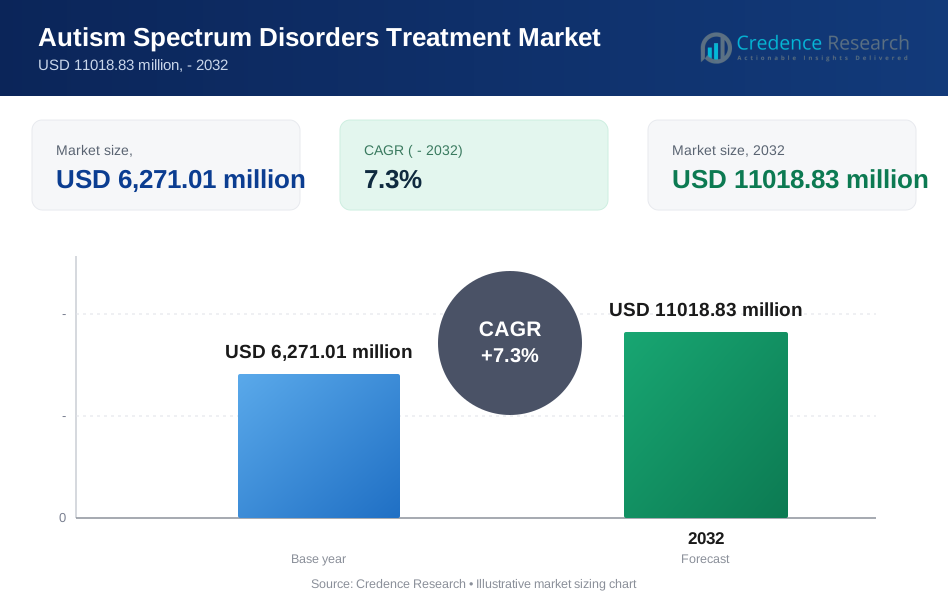
The Autism Spectrum Disorders Treatment Market is projected to grow from USD 6271.01 million in 2024 to an estimated USD 11018.83 million by 2032, with a compound annual growth rate (CAGR) of 7.3% from 2024 to 2032.
| REPORT ATTRIBUTE | DETAILS |
|---|---|
| Historical Period | 2020-2023 |
| Base Year | 2024 |
| Forecast Period | 2025-2032 |
| Autism Spectrum Disorders Treatment Market Size 2024 | USD 6271.01 million |
| Autism Spectrum Disorders Treatment Market, CAGR | 7.3% |
| Autism Spectrum Disorders Treatment Market Size 2032 | USD 11018.83 million |
Rising diagnosis rates and earlier screening expand the treated patient pool across children and adults. Providers scale ABA, speech therapy, occupational therapy, and CBT to improve functional outcomes. Payers widen coverage for evidence-based services, which supports higher therapy utilization. Clinicians also treat comorbid symptoms such as irritability, anxiety, sleep issues, and attention problems. Telehealth improves follow-up access and strengthens caregiver coaching at home. Provider networks invest in staffing and standardized care pathways to reduce wait times and improve continuity.
North America leads due to strong diagnostic access, higher healthcare spending, and large therapy provider networks. The United States drives volume through insurance coverage and broad availability of specialty centers. Europe follows with structured public systems and expanding community-based services in major countries. Asia Pacific emerges as awareness rises and private clinics expand in urban areas. China, India, Japan, and Australia add capacity through new centers and trained professionals. Latin America and the Middle East & Africa grow steadily as access improves and telehealth supports outreach.
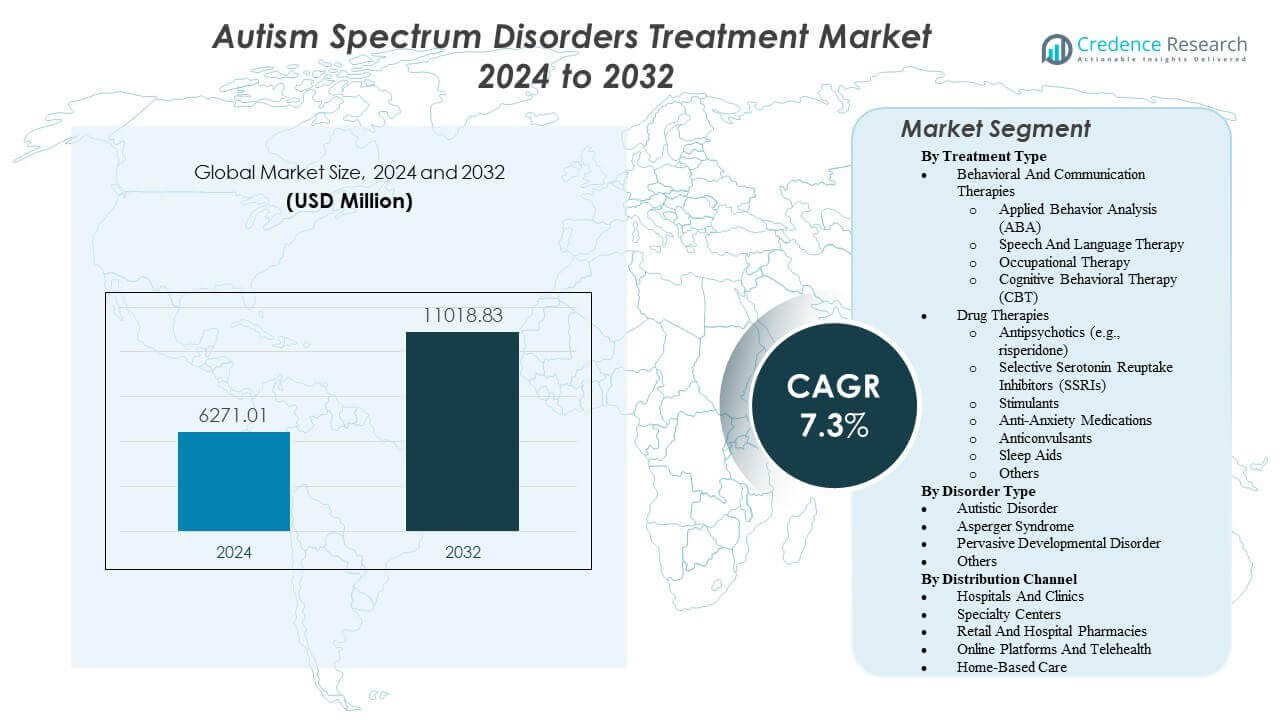
Autism Spectrum Disorders Treatment Market Insights:
- Earlier screening and higher diagnosis rates increase therapy starts, with ABA, speech therapy, occupational therapy, and CBT forming the core care pathway.
- Wider payer coverage and better care coordination improve access, while symptom management for irritability, anxiety, sleep issues, and attention problems sustains follow-up demand.
- Workforce shortages, long waitlists, and uneven service quality across regions act as key restraints and can delay diagnosis-to-therapy timelines.
- North America leads due to strong diagnostic access and large provider networks, while Asia Pacific grows fastest as awareness rises and urban service capacity expands.
Autism Spectrum Disorders Treatment Market Drivers
Rising Diagnosis Rates And Earlier Pathways To Care Across Age Groups
Autism Spectrum Disorders Treatment Market demand rises as screening expands in pediatrics and primary care. More schools and clinics use structured tools to flag developmental delays. Parents seek assessment earlier when speech or behavior concerns appear. Clinicians recommend therapy soon after diagnosis to improve function. Providers also support transitions into adolescent and adult services. Public awareness reduces stigma and increases help-seeking behavior. Nonprofit groups and advocacy campaigns push faster referrals. This wider funnel supports higher therapy starts and follow-up visits.
Payer Coverage Expansion For Evidence-Based Services And Care Coordination Models
Insurance coverage for behavioral therapy improves access in many markets. Public programs define eligibility rules and set service benchmarks. Private payers add networks for speech and occupational therapy. Prior authorization still exists, yet approvals rise for documented needs. Care coordinators help families navigate referrals and schedules. Better coverage supports multi-disciplinary plans across settings. Provider groups standardize protocols to fit payer requirements. Wider reimbursement reduces out-of-pocket burden for families.
- For instance, Magellan Health reported that its intensive case management programs for autism led to a 15% reduction in inpatient psychiatric admissions for children with ASD by streamlining access to Applied Behavior Analysis (ABA) and outpatient coordination.
High Burden Of Comorbid Symptoms That Require Ongoing Clinical Management
Many patients face irritability, anxiety, sleep issues, or attention problems. Clinicians use symptom-focused medications to support daily stability. Therapy teams adjust plans when comorbid symptoms disrupt learning. Families often request support for school refusal and disruptive behavior. Primary care and psychiatry share care in complex cases. Regular monitoring supports dose optimization and side-effect control. Multi-condition care increases visit frequency and follow-up adherence. This clinical need sustains demand beyond early childhood years.
- For instance, Otsuka Pharmaceutical and Lundbeck’s clinical data for Abilify (aripiprazole) demonstrated that the medication effectively reduced irritability scores on the Aberrant Behavior Checklist by 12.4 points compared to placebo in pediatric patients.
Capacity Growth In Specialized Provider Networks And Technology-Enabled Service Delivery
Health systems expand autism centers and affiliated therapy clinics. Large provider groups open satellite sites to reduce travel time. Telehealth supports coaching, check-ins, and caregiver training at home. Remote tools help therapists guide sessions between in-person visits. Employers also add benefits that cover developmental support services. Workforce training programs increase the number of qualified therapists. Better capacity reduces waitlists in high-demand urban regions. Wider access supports consistent treatment plans over time.
Autism Spectrum Disorders Treatment Market Trends
Shift Toward Precision Support Plans Using Biomarkers And Richer Patient Profiling
Autism Spectrum Disorders Treatment Market trends move toward more tailored care pathways. Clinicians use structured assessments to segment needs by function and risk. Researchers test biomarkers that may support subtyping in the future. Pharmacogenomics gains interest to guide dose selection for some patients. Care teams track sleep, anxiety, and attention patterns more consistently. These profiles shape therapy intensity and clinical follow-up schedules. Families prefer plans that match daily goals and school needs. This direction supports more individualized service packages.
- For instance, Cognoa reported its AI assessment improved AUC by 0.18 and improved specificity by 0.30 at 90% sensitivity versus baseline screeners.
Rapid Adoption Of Measurement-Based Care And Real-World Outcomes Tracking
Providers track progress with standardized scales and goal-based measures. Clinics use dashboards to compare baseline and follow-up outcomes. Payers request evidence of benefit for high-intensity therapy hours. Schools also document functional gains and classroom readiness. Digital surveys capture caregiver feedback between visits. Teams adjust plans when measures show stalled progress. This practice improves accountability across therapy disciplines. Outcome tracking also supports research and quality improvement programs.
- For instance, RethinkFirst analyzed 14,748 ABA patients and found 40% received over- or under-titrated hours, which affected progress for about 5,900 children.
Growth Of Hybrid Care Models That Blend Home, Clinic, And School Interventions
Many programs combine clinic sessions with home practice plans. Therapists train caregivers to reinforce skills during routines. Schools coordinate with clinicians for consistent behavior supports. Home visits and community sessions support generalization of skills. Hybrid models reduce travel burden and improve continuity. These designs also fit families with limited local provider access. Group sessions support peer interaction and caregiver learning. Hybrid care becomes a standard option in many service lines.
Increased Use Of Digital Tools For Screening, Scheduling, Training, And Care Navigation
Clinics deploy apps for appointments, reminders, and secure messaging. Care teams use platforms for caregiver education modules and coaching. Digital screening tools help flag concerns in primary care settings. Some programs use video review to support therapy feedback. Provider groups adopt centralized intake to route cases faster. Data platforms reduce paperwork and improve coordination across disciplines. Families prefer simple navigation and clear progress updates. Digital support improves operational efficiency for providers.
Autism Spectrum Disorders Treatment Market Challenges Analysis
Severe Workforce Shortages And Uneven Service Quality Across Regions And Settings
Autism Spectrum Disorders Treatment Market growth faces constraints from limited trained therapists. Many regions lack enough BCBAs, speech therapists, and occupational therapists. Wait times remain long for diagnostic assessment and therapy starts. High caseloads reduce session frequency and continuity of care. Staff turnover disrupts trust and slows skill progress. Quality varies across providers due to differences in training and supervision. Rural areas face the largest gaps in specialist availability. These constraints limit access even when demand and coverage rise.
Complex Funding Rules, Fragmented Care Pathways, And High Family Burden Over Time
Payment rules differ across insurers, schools, and public programs. Families often manage multiple approvals for therapy and evaluations. Service caps can reduce intensity for patients with higher support needs. Documentation demands add burden for both clinics and caregivers. Care coordination remains difficult across pediatrics, psychiatry, and education systems. Out-of-pocket costs persist for travel, tutoring, and private therapy. Inequity grows when families lack time or resources to advocate. Fragmentation slows consistent, long-term treatment delivery.
Autism Spectrum Disorders Treatment Market Opportunities
Scaling Community-Based Access Through Training, Task Sharing, And Standardized Protocols
Autism Spectrum Disorders Treatment Market opportunity grows with stronger community delivery models. Health systems can train mid-level staff under specialist supervision. Standard protocols can improve quality across smaller clinics. Schools can adopt structured supports that align with clinical plans. Tele-supervision can extend specialist reach into underserved areas. Provider networks can partner with NGOs to expand early screening camps. These approaches can reduce waitlists and shorten time to therapy. Better access can lift adherence and improve outcomes.
Innovation In Adjunct Therapies, Digital Therapeutics, And Integrated Family Support Services
Drug developers can target specific symptom clusters with improved tolerability. Companies can design digital therapeutics for social skills and attention support. Platforms can bundle caregiver training with clinician oversight and progress measures. Employers can expand benefits for neurodevelopmental care and navigation. Clinics can offer integrated pathways that cover sleep, anxiety, and feeding support. Partnerships with schools can create shared goals and consistent reinforcement. Real-world data programs can support payer confidence and coverage. Integrated support can raise retention and long-term care continuity.
Autism Spectrum Disorders Treatment Market Segmentation Analysis:
Behavioral and communication therapies form the care foundation because they target functional skills and daily independence. Providers scale Applied
Behavior Analysis (ABA) for structured behavior plans, while speech and language therapy supports communication goals. Occupational therapy improves sensory regulation and fine-motor skills that affect school routines. Cognitive Behavioral Therapy (CBT) supports anxiety control and coping skills, especially for older children and adults. Multi-disciplinary delivery strengthens outcomes when therapists coordinate goals and track progress.
- For instance, CentralReach reported BSTperform data linked treatment-fidelity support to a 500% increase in RBT retention, backed by 4B+ clinical data points across its platform.
Drug therapies address irritability, anxiety, attention issues, sleep disruption, and seizure risk when these symptoms affect function. Antipsychotics such as risperidone remain key options for severe irritability in selected patients under clinical supervision. SSRIs and anti-anxiety medications support mood and anxiety symptoms in appropriate cases. Stimulants help attention and hyperactivity for patients with ADHD-like symptoms. Anticonvulsants support seizure control, while sleep aids improve rest and daytime behavior. Clinicians tailor regimens to tolerability and monitor side effects closely.
By disorder type, autistic disorder drives broad service demand due to higher support needs and earlier diagnosis in many settings. Asperger syndrome often shows higher use of social skills therapy, CBT, and academic supports. Pervasive developmental disorder segments reflect varied symptom profiles that require flexible care plans. The “others” category includes atypical profiles and comorbid conditions that raise the need for personalized care pathways.
- For instance, FDA’s De Novo decision describes Cognoa’s ASD Diagnosis Aid for 18–72 months, which supports clinician decision-making for suspected ASD cases.
By distribution channel, hospitals and clinics lead diagnosis, medication management, and referrals for therapy services in the Autism Spectrum Disorders Treatment Market. Specialty centers deliver intensive programs and complex case management through expert teams. Retail and hospital pharmacies support ongoing medication access and counseling. Online platforms and telehealth expand reach for follow-ups and caregiver coaching. Home-based care supports skill transfer into daily routines and improves adherence.
Segmentation:
By Treatment Type
- Behavioral And Communication Therapies
- Applied Behavior Analysis (ABA)
- Speech And Language Therapy
- Occupational Therapy
- Cognitive Behavioral Therapy (CBT)
- Drug Therapies
- Antipsychotics (e.g., risperidone)
- Selective Serotonin Reuptake Inhibitors (SSRIs)
- Stimulants
- Anti-Anxiety Medications
- Anticonvulsants
- Sleep Aids
- Others
By Disorder Type
- Autistic Disorder
- Asperger Syndrome
- Pervasive Developmental Disorder
- Others
By Distribution Channel
- Hospitals And Clinics
- Specialty Centers
- Retail And Hospital Pharmacies
- Online Platforms And Telehealth
- Home-Based Care
By Region
- North America
- U.S.
- Canada
- Mexico
- Europe
- Germany
- France
- U.K.
- Italy
- Spain
- Rest of Europe
- Asia Pacific
- China
- Japan
- India
- South Korea
- South-east Asia
- Rest of Asia Pacific
- Latin America
- Brazil
- Argentina
- Rest of Latin America
- Middle East & Africa
- GCC Countries
- South Africa
- Rest of the Middle East and Africa
Regional Analysis:
North America leads the Autism Spectrum Disorders Treatment Market with a 42.7% revenue share in 2024. The U.S. drives demand through broad diagnosis access and higher care spending. Large payer networks support therapy referrals and symptom-based drug use. Specialist centers scale care pathways for children and adults in major metros. Provider groups also expand telehealth follow-ups for caregiver coaching. These factors keep North America in the lead despite capacity pressure.
Europe holds a 29.3% share in 2024, supported by public health systems and structured care pathways. Countries such as the UK, Germany, and France maintain strong therapy and clinical services. Schools and community services support long-term care continuity for diagnosed patients. Reimbursement frameworks favor evidence-based interventions and specialist referrals. Regional growth also benefits from higher awareness and earlier screening. Access gaps remain in smaller markets, yet major countries sustain scale.
Asia Pacific accounts for 20.0% in 2024 and shows fast expansion as awareness and services rise. China, Japan, India, and Australia add diagnostic capacity and private therapy networks in urban areas. Latin America contributes 6.2%, led by Brazil, with growth tied to improving access and clinician training. Middle East & Africa represents 1.8%, where limited specialist density slows uptake outside top cities. Telehealth and caregiver-led models support access in both regions. National policy support and reimbursement expansion will shape the pace of future adoption.
Key Player Analysis:
- Johnson & Johnson Services Inc.
- Otsuka Pharmaceutical Co., Ltd.
- Pfizer Inc.
- F. Hoffmann-La Roche Ltd.
- Bristol-Myers Squibb Company
- Merck & Co., Inc.
- Novartis AG
- Eli Lilly and Company
- AbbVie Inc.
- Teva Pharmaceutical Industries Ltd.
- Supernus Pharmaceuticals
- Jazz Pharmaceuticals
Competitive Analysis:
The Autism Spectrum Disorders Treatment Market stays moderately concentrated in symptom-focused drugs, while service delivery remains fragmented across therapy providers. Large pharma companies such as Johnson & Johnson, Pfizer, Roche, Novartis, Eli Lilly, Merck, and Bristol-Myers Squibb compete through scale, portfolios, and global commercialization reach. Otsuka holds strong visibility in neuropsychiatry and supports category momentum in key markets. Specialty firms such as Curemark, Axial Therapeutics, and Yamo target differentiated mechanisms and niche pathways, which can reshape future share.
Competition also depends on payer acceptance, tolerability profiles, and prescriber confidence in real-world practice. Companies invest in clinical programs that address irritability, anxiety, sleep problems, attention symptoms, and comorbid seizures. Therapy ecosystems influence drug demand because behavioral care often triggers referrals for symptom management. Channel strength matters, since retail and hospital pharmacies support continuity in chronic symptom control. Larger firms use partnerships and lifecycle planning to defend brands, while smaller players pursue focused trials and licensing routes.
Recent Developments:
- In November 2025, JoyBridge Kids acquired Pediatric Advanced Therapy, a North Carolina-based provider, to enhance multidisciplinary care offerings including ABA, speech, occupational therapies, and counseling for children with autism.
- In November 2025, Artisan Therapeutics and Tulex Pharmaceuticals reported positive Phase 2a results for their autism drug ART-501, showing clinical benefits in participants with ASD-related conditions and paving the way for further development.
- In February 2025, Already Autism Health announced the acquisition of C.A.B.S. Autism and Behavior Specialists to expand access to high-quality autism services and evidence-based care for more individuals with ASD.
Report Coverage:
The research report offers an in-depth analysis based on Treatment Type, Disorder Type and Distribution Channel. It details leading market players, providing an overview of their business, product offerings, investments, revenue streams, and key applications. Additionally, the report includes insights into the competitive environment, SWOT analysis, current market trends, as well as the primary drivers and constraints. Furthermore, it discusses various factors that have driven market expansion in recent years. The report also explores market dynamics, regulatory scenarios, and technological advancements that are shaping the industry. It assesses the impact of external factors and global economic changes on market growth. Lastly, it provides strategic recommendations for new entrants and established companies to navigate the complexities of the market.
Future Outlook:
- Earlier screening will push faster referrals and raise therapy starts across pediatric settings.
- Hybrid care will expand, with clinics, schools, and homes using shared goals and coordinated plans.
- Telehealth will scale caregiver coaching and follow-ups, which will improve continuity in underserved areas.
- Provider networks will invest in workforce training to reduce waitlists and strengthen service quality.
- Measurement-based care will spread, with standardized tools guiding plan changes and payer discussions.
- Digital platforms will streamline intake, scheduling, and progress tracking, which will improve clinic efficiency.
- Symptom-focused drug use will remain important, with closer monitoring and better tolerability expectations.
- Precision support plans will grow, using richer patient profiles to match intensity and therapy mix.
- Specialty centers will expand complex-care programs and act as hubs for referrals and care coordination.
- Partnerships with schools and employers will broaden access and support long-term adherence to care.
Request a Free Sample
Fill in your details and we'll send you a free sample report.
- Sample data tables & charts
- Research methodology
Need a Custom Version of This Report?
Tailor the scope, geography, or segments to your exact requirements.
- Custom geography or segment scope
- Direct access to our analyst team
Frequently Asked Questions
What is the current market size for Autism Spectrum Disorders Treatment Market, and what is its projected size in 2032?
At what Compound Annual Growth Rate is the Autism Spectrum Disorders Treatment Market projected to grow between 2024 and 2032?
Which Autism Spectrum Disorders Treatment Market segment held the largest share in 2024?
What are the primary factors fueling the growth of the Autism Spectrum Disorders Treatment Market?
Who are the leading companies in the Autism Spectrum Disorders Treatment Market?
Which region commanded the largest share of the Autism Spectrum Disorders Treatment Market in 2024?
Table of Content
Chapter 1. Report Introduction
- 1.1 Report Description & Purpose
- 1.1.1 Report Title & Market Definition
- 1.1.2 Unique Selling Propositions (USP) & Key Differentiators
- 1.1.3 Value Proposition for Stakeholders
- 1.2 Research Objectives
- 1.2.1 Market Sizing Objectives (Volume & Revenue)
- 1.2.2 Segmentation Objectives
- 1.2.3 Competitive Intelligence Objectives
- 1.2.4 Forecast & Scenario Objectives
- 1.3 Report Scope
- 1.3.1 Autism Spectrum Disorders Treatment Scope – Types & Subtypes Covered
- 1.3.2 Geographic Scope – Regions & Countries Covered
- 1.3.3 Historical Period, Base Year & Forecast Period (the historical period; forecast to 2032)
- 1.3.4 Inclusions & Exclusions
- 1.4 HS Code & Classification Framework
- 1.5 Currency, Units & Pricing Basis
- 1.6 Target Stakeholders
- 1.7 Limitations & Assumptions
Chapter 2. Executive Summary
- 2.1 Global Autism Spectrum Disorders Treatment Market Snapshot
- 2.1.1 Market Size – Historical (the historical period) & Forecast (2032) (base year: USD 6,271.01 million → 2032: USD 11018.83 million)
- 2.1.2 Volume & Revenue – Global Totals
- 2.1.3 Key Market Highlights – Top Five Facts
- 2.2 Autism Spectrum Disorders Treatment Market Segmentation Snapshot
- 2.2.1 Market Split by Region – vs. 2032
- 2.3 Competitive Snapshot
- 2.3.1 Top 10 Players by Revenue Share –
- 2.3.2 Top 10 Players by Volume Share –
- 2.3.3 Recent Strategic Developments (18-Month Summary)
- 2.4 Key Investment Highlights & Strategic Conclusions
Chapter 3. Autism Spectrum Disorders Treatment Market Dynamics & Industry Analysis
- 3.1 Market Overview & Context
- 3.1.1 Autism Spectrum Disorders Treatment Market Position in the Broader Automotive Value Chain
- 3.1.2 OEM vs. Replacement Market Dynamics
- 3.1.3 Market Maturity & Development Stage by Region
- 3.2 Autism Spectrum Disorders Treatment Market Drivers
- 3.3 Autism Spectrum Disorders Treatment Market Restraints & Challenges
- 3.4 Autism Spectrum Disorders Treatment Market Opportunities
- 3.5 Porter's Five Forces Analysis
- 3.5.1 Threat of New Entrants
- 3.5.2 Bargaining Power of Suppliers
- 3.5.3 Bargaining Power of Buyers
- 3.5.4 Threat of Substitutes
- 3.5.5 Competitive Rivalry – Intensity Assessment
- 3.6 Autism Spectrum Disorders Treatment Value Chain Analysis
- 3.6.1 Upstream – Raw Material/Input Suppliers
- 3.6.1.1 Raw Material/Input 1
- 3.6.1.2 Raw Material/Input 2
- 3.6.1.3 Raw Material/Input 3
- 3.6.2 Midstream – Production/Manufacturing/Service Delivery
- 3.6.2.1 Production/Process Overview
- 3.6.2.2 Key Facility Locations & Capacity by Manufacturer
- 3.6.3 Downstream – Distribution & End Consumer
- 3.6.3.1 Primary Channel – B2B/OEM
- 3.6.3.2 Secondary Channels – Dealer, Retail, Online, Direct
- 3.6.4 Value Chain Profitability Analysis
- 3.6.1 Upstream – Raw Material/Input Suppliers
- 3.7 PESTEL Analysis
- 3.7.1 Political Factors
- 3.7.2 Economic Factors
- 3.7.3 Social Factors
- 3.7.4 Technological Factors
- 3.7.5 Environmental Factors
- 3.7.6 Legal Factors
- 3.8 Autism Spectrum Disorders Treatment Supply Chain Analysis
- 3.8.1 Raw Material/Input Supply Risk Assessment
- 3.8.2 Manufacturing Concentration Risk (Geographic Exposure)
- 3.8.3 Trade Disruption Impact Analysis
- 3.9 Regulatory & Policy Landscape
Note: The regulatory and policy landscape section covers regulations based on their applicability to the market, Autism Spectrum Disorders Treatment category, geography, and scope of the study. Only regulatory frameworks with a material impact on operations, compliance, trade, sustainability, or market access are analyzed in detail.
Chapter 4. Key Investment Pockets & Opportunity Analysis
- 4.1 Autism Spectrum Disorders Treatment Market Attractiveness Analysis
- 4.1.1 By Region – Investment Attractiveness Matrix (Volume × CAGR)
- 4.2 Absolute Revenue Growth Opportunity
- 4.2.1 By Region – Absolute USD Growth Through 2032
- 4.3 Incremental Volume Opportunity
- 4.3.1 By Region – Incremental Volume Through 2032
- 4.3.2 Segment – Incremental Volume
- 4.4 Emerging Submarket Opportunity Deep Dive (Subject to Applicability)
- 4.5 Emerging Market Opportunity Scorecards
- 4.5.1 United States
- 4.5.2 Europe
- 4.5.3 Asia
- 4.5.4 Middle East & Africa
Note: Emerging Market Opportunity Scorecards will be included based on relevance and strategic importance. Regions listed are indicative and may vary depending on data availability and market dynamics.
Chapter 5. Autism Spectrum Disorders Treatment Import-Export Analysis & Trade Flows
- 5.1 Global Trade Overview
- 5.1.1 Global Export Value by Country (the historical period)
- 5.1.2 Global Export Volume by Country (the historical period)
- 5.1.3 Global Import Value by Country (the historical period)
- 5.1.4 Global Import Volume by Country (the historical period)
- 5.1.5 Net Trade Balance by Country (the historical period)
- 5.2 Export Analysis – Segment
- 5.2.1 Type 1 (HS Code)
- 5.2.2 Type 2 (HS Code)
- 5.2.3 Type 3 (HS Code)
- 5.2.4 Type 4 (HS Code)
- 5.2.5 Type 5 (HS Code)
- 5.3 Import Analysis – Segment
- 5.3.1 Type 1 (HS Code)
- 5.3.2 Type 2 (HS Code)
- 5.3.3 Type 3 (HS Code)
- 5.3.4 Type 4 (HS Code)
- 5.3.5 Type 5 (HS Code)
- 5.4 Average Unit Trade Prices
- 5.4.1 Average Export Price – Segment & Country
- 5.4.2 Average Import Price – Segment & Source Country
- 5.4.3 Price Trends (the historical period)
- 5.5 Key Trade Route Analysis
- 5.5.1 Trade Route 1
- 5.5.2 Trade Route 2
- 5.5.3 Trade Route 3
- 5.5.4 Trade Route 4
- 5.5.5 Trade Route 5
- 5.6 Trade Policy Impact Assessment
- 5.6.1 US Anti-Dumping & Section 301 Tariffs
- 5.6.2 EU Customs Union Impact
- 5.6.3 Major Free Trade Agreements
- 5.6.4 USMCA Rules of Origin
Note: Trade policy analysis will be included only where relevant to the Autism Spectrum Disorders Treatment market.
Chapter 6. Competitive Landscape & Company Benchmarking
- 6.1 Autism Spectrum Disorders Treatment Market Concentration & Structure
- 6.1.1 Herfindahl-Hirschman Index (HHI) – vs.
- 6.1.2 Tier 1, Tier 2 & Tier 3 Market Structure
- 6.1.3 Global, Regional & Local Player Dynamics
- 6.2 Autism Spectrum Disorders Treatment Market Share Analysis –
- 6.2.1 Global Revenue Share by Company
- 6.2.2 Global Volume Share by Company
- 6.2.3 Regional Revenue Share
- 6.2.4 Market Share Evolution ( vs. )
- 6.2.5 OEM Segment Share by Company
- 6.2.6 Replacement Segment Share by Company
- 6.3 Production/Delivery Capacity & Facility Analysis
- 6.3.1 Global Installed Capacity
- 6.3.2 Capacity Utilization Rates
- 6.3.3 Production/Output Volume
- 6.3.4 Facility Locations & Capacity Map
- 6.3.5 Planned Capacity Additions
- 6.4 Autism Spectrum Disorders Treatment Competitive Benchmarking Matrix
- 6.4.1 Revenue, Volume, CAGR & Profitability Comparison
- 6.4.2 Channel Revenue Mix
- 6.4.3 Geographic Revenue Exposure
- 6.4.4 R&D Intensity
- 6.4.5 Sustainability Maturity
- 6.5 Strategic Developments in Autism Spectrum Disorders Treatment (Last 24 Months)
- 6.5.1 Mergers, Acquisitions & Divestments
- 6.5.2 New Autism Spectrum Disorders Treatment Launches
- 6.5.3 Facility Expansions
- 6.5.4 Strategic Alliances, Joint Ventures & Partnerships
- 6.5.5 Distribution Expansion & Market Entry
- 6.5.6 Sustainability & ESG Initiatives
- 6.6 Competitive Strategy Mapping
- 6.6.1 Leader, Challenger, Follower & Niche Classification
- 6.6.2 Pricing Strategy Comparison
- 6.6.3 Channel Strategy Matrix
Note: Strategic developments are included based on their materiality and the availability of reliable information.
Chapter 7. Global Autism Spectrum Disorders Treatment Market – By Distribution Channel
- 7.1 Segment Overview
- 7.1.1 Volume & Revenue Split by Channel ( & 2032)
- 7.1.2 Channel Mix Evolution (2032)
Chapter 8. Regional Market Analysis – Global Overview
- 8.1 Global Regional Overview
- 8.1.1 Regional Volume Share
- 8.1.2 Regional Revenue Share
- 8.1.3 Regional Volume by Region
- 8.1.4 Regional Revenue by Region
- 8.1.5 Regional Forecast Through 2032
- 8.2 Cross-Regional Segment Analysis
- 8.2.1 By Distribution Channel
- 8.2.2 By Brand/Price Tier
Chapter 9. North America Autism Spectrum Disorders Treatment Market
- 9.1 United States
- 9.2 Canada
- 9.3 Mexico
Chapter 10. Europe Autism Spectrum Disorders Treatment Market
- 10.1 Germany
- 10.2 France
- 10.3 Italy
- 10.4 United Kingdom
- 10.5 Spain
- 10.6 Poland
- 10.7 Russia
- 10.8 Netherlands
- 10.9 Belgium
- 10.10 Sweden
- 10.11 Denmark
- 10.12 Norway
- 10.13 Rest of Europe
Chapter 11. Asia Pacific Autism Spectrum Disorders Treatment Market
- 11.1 China
- 11.2 India
- 11.3 Japan
- 11.4 South Korea
- 11.5 Thailand
- 11.6 Indonesia
- 11.7 Vietnam
- 11.8 Malaysia
- 11.9 Australia
- 11.10 Rest of Asia Pacific
Chapter 12. Latin America Autism Spectrum Disorders Treatment Market
- 12.1 Brazil
- 12.2 Argentina
- 12.3 Colombia
- 12.4 Chile
- 12.5 Rest of Latin America
Chapter 13. Middle East Autism Spectrum Disorders Treatment Market
- 13.1 Saudi Arabia
- 13.2 United Arab Emirates
- 13.3 Turkey
- 13.4 Israel
- 13.5 Iran
- 13.6 Rest of the Middle East
Chapter 14. Africa Autism Spectrum Disorders Treatment Market
- 14.1 South Africa
- 14.2 Egypt
- 14.3 Nigeria
- 14.4 Morocco
- 14.5 Rest of Africa
Chapter 15. Autism Spectrum Disorders Treatment Company Profiles
- 15.1 [Company 01]
- 15.1.1 Company Overview
- 15.1.2 Key Management Personnel
- 15.1.3 Products & Services Portfolio
- 15.1.4 Financial Performance
- 15.1.5 Key Market Focus & Geographic Presence
- 15.1.6 Recent Developments & Strategic Initiatives
Note: The company profile list is preliminary and may change based on research findings, market developments, data availability, and client requirements.
Chapter 16. Appendices
- Appendix A – List of Abbreviations & Acronyms
- Appendix B – Industry Classification Code Reference – Full Series
- Appendix C – Production & Capacity Data Tables
- Appendix D – End-Use & Demand Base Tables
- Appendix E – Consumption & Replacement Rate Assumptions
- Appendix F – ASP Reference Tables
- Appendix G – Manufacturing & Facility Database
- Appendix H – Import-Export Data Tables
- Appendix I – Regulatory Summary Tables
- Appendix J – Primary Research Participant List (Anonymized)
- Appendix K – Primary Research Questionnaire Framework
- Appendix L – Data Sources & Bibliography
- Appendix M – Market Size Divergence & Source Comparison
Chapter 17. Research Methodology
- 17.1 Research Framework & Philosophy
- 17.2 Secondary Research – Sources, Hierarchy & Data Extraction
- 17.3 Data Modeling – Bottom-Up & Top-Down Market Sizing
- 17.4 Primary Research – Stakeholder Framework, LOI & Sample Sizes
- 17.5 Forecast Methodology – Regression, Scenario & Sensitivity Analysis
- 17.6 Quality Control – Four-Layer Validation Framework
- 17.7 Limitations & Standard Assumptions
- 17.8 Disclaimer
