
UAE Over-the-Counter (OTC) Pharmaceuticals Market Overview:
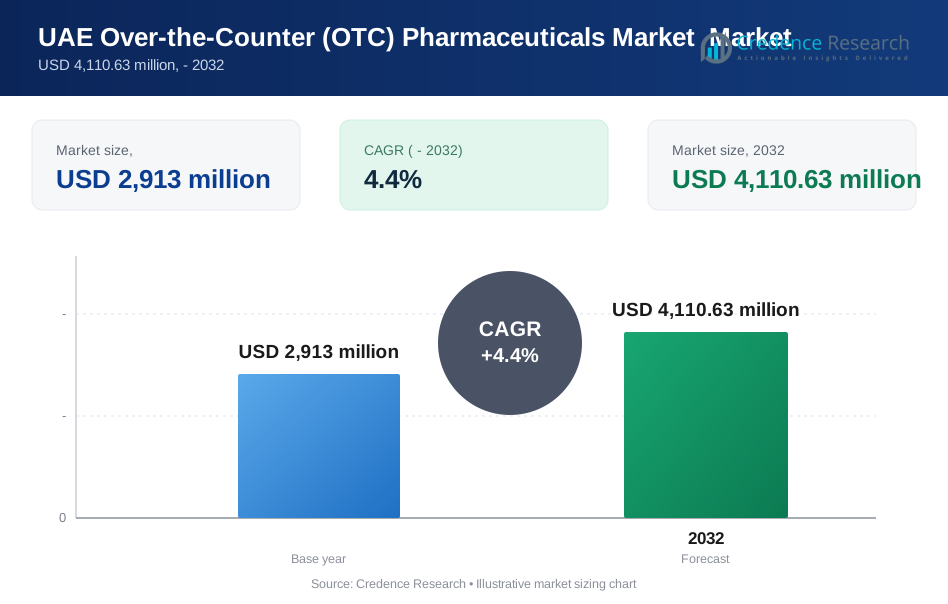
UAE Over-the-Counter (OTC) Pharmaceuticals Market size was valued at USD 2,913 million in 2024 and is anticipated to reach USD 4,110.63 million by 2032, at a CAGR of 4.4% during the forecast period.
| REPORT ATTRIBUTE | DETAILS |
|---|---|
| Historical Period | 2020-2024 |
| Base Year | 2025 |
| Forecast Period | 2026-2032 |
| UAE Over-the-Counter (OTC) Pharmaceuticals Market Size 2024 | USD 2,913 million |
| UAE Over-the-Counter (OTC) Pharmaceuticals Market, CAGR | 4.4% |
| UAE Over-the-Counter (OTC) Pharmaceuticals Market Size 2032 | USD 4,110.63 million |
UAE Over-the-Counter (OTC) Pharmaceuticals Market Insights
- Rising self-medication habits and strong demand for branded OTC drugs, which held about 61% share in 2024, continue to drive overall market expansion.
- Digital pharmacy growth, preventive health interest, and premium clean-label products are emerging as key trends shaping consumer preferences.
- Competition remains strong as global and regional players expand product portfolios and strengthen partnerships with major pharmacy chains to improve visibility.
- Dubai led the market with about 46% share in 2024, followed by Abu Dhabi at nearly 32%, while retail pharmacies dominated distribution with around 58% share across the UAE.
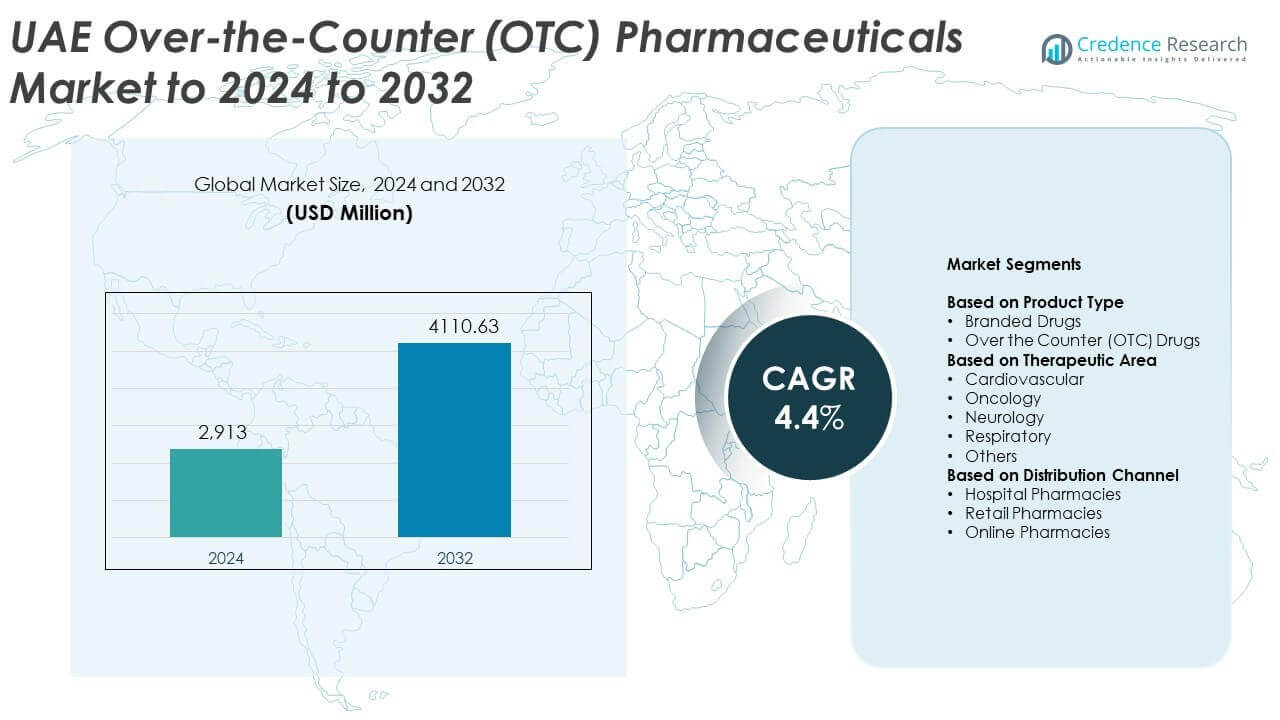
UAE Over-the-Counter (OTC) Pharmaceuticals Market Segmentation Analysis:
By Product Type
Branded drugs led the product type segment in 2024 with about 61% share. Strong brand trust, wide availability, and steady demand for pain relief and cold medications supported this lead. The UAE’s high-income population favored recognized brands that ensured safety and reliable results. OTC drugs grew at a steady pace due to rising self-care habits and easier access across pharmacies. Growth in OTC options also came from broader shelf presence, improved packaging, and rising awareness of quick-relief medicines for common conditions.
- For instance, Kenvue reports that its consumer health brands, including Tylenol and others, reach about 1.2 billion consumers worldwide, underscoring the scale of branded OTC demand.
By Therapeutic Area
Respiratory products dominated the therapeutic area segment in 2024 with nearly 33% share. Hot climate conditions, high dust levels, and seasonal flu cycles increased demand for cough, cold, and allergy medications. Strong healthcare awareness also encouraged early symptom management with over-the-counter solutions. Cardiovascular and neurology categories expanded as lifestyle diseases became more common across the urban population. Oncology-related OTC support products gained traction as supportive care awareness improved in hospitals and retail settings.
- For instance, AstraZeneca’s EXACOS-CV programme analysed real-world data from over 1 million COPD patients across eight countries to evaluate outcomes after exacerbations, highlighting the depth of investment in respiratory therapeutics.
By Distribution Channel
Retail pharmacies held the dominant position in 2024 with about 58% share. These outlets remained the most trusted and accessible points for fast OTC purchases across malls, residential areas, and commercial districts. Consumers relied on pharmacist guidance, wide product ranges, and consistent availability of branded and generic products. Hospital pharmacies grew due to rising outpatient visits and stronger stocking of chronic care support products. Online pharmacies gained momentum as digital ordering, express delivery, and e-prescription adoption increased among younger consumers.
Key Growth Drivers
Rising Self-Medication Culture
Many UAE consumers now prefer quick relief without clinic visits. This shift grew due to busy lifestyles, high awareness, and wider access to trusted OTC brands. Pharmacies promoted safe self-care with clear guidance, which improved confidence in common treatments. Retail chains also expanded shelf space for pain relief, respiratory care, digestive aids, and vitamins. This behavior reduced pressure on primary clinics and strengthened OTC demand across major urban areas. Strong population growth further supported higher walk-in purchases.
- For instance, Bayer’s legacy Aspirin brand participates in a market where global consumption of acetylsalicylic acid is estimated at around 40,000 tonnes each year, equivalent to tens of billions of tablets used largely without prescriptions.
Expansion of Pharmacy Networks
Large retail pharmacy chains continued rapid expansion across malls, neighborhoods, and transport hubs. This wider presence increased product visibility and improved customer access to branded and generic OTC choices. Trained pharmacists guided purchase decisions and helped build trust in frequent-use medications. Extended operating hours encouraged more impulse and urgent purchases. New outlets in residential clusters and tourism zones also boosted seasonal demand. This expansion played a vital role in supporting steady OTC market growth.
- For instance, Aster DM Healthcare reports a network of 446 Aster Pharmacy outlets across India, GCC, and Jordan, serving roughly 8 million pharmacy customers annually and reflecting rapid regional retail expansion, by 2022.
Growing Focus on Preventive Health
Preventive care gained strong momentum as residents targeted better immunity, energy, and lifestyle balance. Sales of vitamins, supplements, and general wellness products rose due to higher fitness participation and health awareness campaigns. Corporate wellness programs also encouraged workers to adopt regular self-care habits. Pharmacies stocked more preventive products and promoted them through loyalty programs. This rising preference for proactive health management supported demand beyond acute medications and strengthened overall OTC market value.
Key Trends and Opportunities
Digital Pharmacy Growth
Online pharmacies expanded quickly as users sought fast ordering, clear product details, and door delivery. Younger consumers favored mobile apps for repeat purchases and subscription-based wellness products. Improved digital regulations built trust in verified online sellers. Retail chains also launched strong e-commerce platforms to capture this shift. This trend created a major growth opportunity for brands targeting tech-savvy buyers with fast-moving OTC categories, including cold relief, pain management, and supplements.
- For instance, Alibaba Health’s Tmall Healthcare Platform recorded 300 million annual active users and more than 35,000 merchants as of March 2024, with membership across its direct online stores reaching 77 million, showing the scale of e-pharmacy adoption.
Rise of Premium and Clean-Label Products
Demand increased for premium OTC options that offered safe, gentle, and clean-label formulations. More buyers looked for sugar-free, dye-free, and allergen-friendly variants that supported long-term health habits. Pharmacies highlighted these products with special displays and wellness zones. Global brands expanded their premium ranges to match this shift in consumer mindset. This change created strong opportunities for innovative products focused on purity, natural ingredients, and mild formulations preferred by families and frequent users.
- For instance, Blackmores, a premium natural-health company, employs about 1,200 people across 12 markets in Asia-Pacific, reflecting the growing organisational scale behind higher-end, ingredient-focused supplement brands.
Key Challenges
Strict Regulatory Compliance Requirements
The UAE maintains strict rules for OTC approvals, labeling, and marketing. These regulations protect public health but create longer approval cycles for new products. Companies must meet detailed safety and quality checks before launch. This process increases cost and slows product entry, especially for smaller brands. Frequent updates to standards also require constant operational adjustments. Meeting these rules remains a key challenge for manufacturers seeking faster market expansion.
High Dependence on Imported Products
Most OTC products in the UAE rely on imports, which exposes the market to supply delays and global pricing pressures. Currency shifts, freight constraints, and geopolitical disruptions can reduce product availability. Limited local production capacity restricts the ability to stabilize supply during high-demand periods. Retailers face challenges maintaining stock consistency across chains. This dependence makes the market vulnerable and creates the need for stronger local manufacturing and diversified sourcing strategies.
Regional Analysis
Dubai
Dubai led the UAE Over-the-Counter Pharmaceuticals Market in 2024 with about 46% share. The city’s dense retail pharmacy network, strong tourism flow, and high adoption of self-medication supported heavy OTC sales. Consumers showed strong preference for branded drugs, especially in pain relief, respiratory care, and wellness supplements. Large pharmacy chains expanded outlets across malls, metro stations, and residential clusters, which increased accessibility. Digital pharmacy usage grew quickly as young buyers shifted toward app-based ordering. These combined factors kept Dubai the most influential region in overall OTC demand and product visibility.
Abu Dhabi
Abu Dhabi held nearly 32% share of the OTC pharmaceuticals market in 2024. The emirate’s growing population, strong healthcare infrastructure, and rising awareness of preventive health drove steady uptake of vitamins, immunity products, and common symptom-relief medicines. Hospital-linked pharmacies also supported strong sales through consistent outpatient activity. High-income households preferred premium and trusted branded categories. Government wellness campaigns encouraged regular self-care, boosting repeat purchases across key therapeutic groups. Abu Dhabi’s expanding retail pharmacy chains and improved digital access kept the market on a stable growth path.
Sharjah
Sharjah accounted for about 14% share in 2024, supported by its growing residential communities and increasing retail pharmacy presence. Demand rose for affordable OTC products as families sought accessible solutions for common conditions such as colds, allergies, and digestive issues. The emirate benefited from cross-commuting populations who often purchased OTC items during daily travel. Pharmacy expansion across mixed-use areas improved visibility for both branded and generic options. Rising health awareness among younger consumers also boosted sales of supplements and wellness items. This steady rise positioned Sharjah as a developing yet important OTC market.
Rest of UAE
The Rest of UAE regions contributed nearly 8% share in 2024. Growth came from expanding retail infrastructure in emerging urban zones and rising access to community pharmacies in smaller cities. Population increase in newer residential districts supported stronger demand for basic OTC items, including fever, pain, and respiratory relief products. Tourism activity in coastal and industrial areas also generated seasonal sales. Adoption of online pharmacies improved access to wellness products and chronic care support items. While smaller in scale, these regions displayed consistent potential as healthcare awareness and retail penetration improved.
UAE Over-the-Counter (OTC) Pharmaceuticals Market Segmentations:
By Product Type
- Branded Drugs
- Over the Counter (OTC) Drugs
By Therapeutic Area
- Cardiovascular
- Oncology
- Neurology
- Respiratory
- Others
By Distribution Channel
- Hospital Pharmacies
- Retail Pharmacies
- Online Pharmacies
By Geography
- Dubai
- Abu Dhabi
- Sharjah
- Rest of UAE
Competitive Landscape
The UAE Over-the-Counter Pharmaceuticals Market features competition from leading companies such as Novartis AG, Alembic Pharmaceuticals, LifePharma, Pfizer Inc., GSK PLC, Sanofi SA, Tabuk Pharmaceuticals, Johnson & Johnson, Julphar, Neopharma, and Roche Holding AG. Market players focus on expanding product portfolios across pain relief, respiratory care, digestive health, and wellness categories to meet rising self-medication demand. Many companies invest in quality enhancement, improved formulation stability, and clearer labeling to strengthen consumer trust. Retail pharmacy partnerships continue to play a major role in boosting product visibility across high-traffic locations. Several firms also increase their digital presence through e-pharmacy collaborations that support faster delivery and subscription-based wellness models. Growing interest in preventive health drives companies to introduce vitamins and immunity products tailored to local needs. Strong regulatory compliance remains a priority as brands work to maintain high safety standards and ensure smooth market access in the UAE’s fast-growing OTC landscape.
Key Player Analysis
- Novartis AG
- Alembic Pharmaceuticals
- LifePharma
- Pfizer Inc.
- GSK PLC
- Sanofi SA
- Tabuk Pharmaceuticals
- Johnson & Johnson
- Julphar (Gulf Pharmaceutical Industries)
- Neopharma
- Roche Holding AG
Recent Developments
- In 2025, Alembic Pharmaceuticals converted its UAE branch office into a wholly owned subsidiary to enhance operational flexibility in the Middle East.
- In 2025, Julphar launched 11 new products, including 3 insulin analogues, in the UAE during the first half of 2025, strengthening its market presence in pharmaceuticals.
- In 2024, Tabuk Pharmaceuticals signed an agreement with Globalpharma to locally manufacture key pharmaceutical products in the UAE.
Report Coverage
The research report offers an in-depth analysis based on Product Type, Therapeutic Area, Distribution Channel and Geography. It details leading market players, providing an overview of their business, product offerings, investments, revenue streams, and key applications. Additionally, the report includes insights into the competitive environment, SWOT analysis, current market trends, as well as the primary drivers and constraints. Furthermore, it discusses various factors that have driven market expansion in recent years. The report also explores market dynamics, regulatory scenarios, and technological advancements that are shaping the industry. It assesses the impact of external factors and global economic changes on market growth. Lastly, it provides strategic recommendations for new entrants and established companies to navigate the complexities of the market.
Request a Free Sample
Fill in your details and we'll send you a free sample report.
- Sample data tables & charts
- Research methodology
Need a Custom Version of This Report?
Tailor the scope, geography, or segments to your exact requirements.
- Custom geography or segment scope
- Direct access to our analyst team
Frequently Asked Questions
What is the current market size for UAE Over-the-Counter (OTC) Pharmaceuticals Market, and what is its projected size in 2032?
At what Compound Annual Growth Rate is the UAE Over-the-Counter (OTC) Pharmaceuticals Market projected to grow between 2025 and 2032?
Which UAE Over-the-Counter (OTC) Pharmaceuticals Market segment held the largest share in 2024?
What are the primary factors fueling the growth of the UAE Over-the-Counter (OTC) Pharmaceuticals Market?
Who are the leading companies in the UAE Over-the-Counter (OTC) Pharmaceuticals Market?
Which region commanded the largest share of the UAE Over-the-Counter (OTC) Pharmaceuticals Market in 2024?
Table of Content
Chapter 1. Report Introduction
- 1.1 Report Description & Purpose
- 1.1.1 Report Title & Market Definition
- 1.1.2 Unique Selling Propositions (USP) & Key Differentiators
- 1.1.3 Value Proposition for Stakeholders
- 1.2 Research Objectives
- 1.2.1 Market Sizing Objectives (Volume & Revenue)
- 1.2.2 Segmentation Objectives
- 1.2.3 Competitive Intelligence Objectives
- 1.2.4 Forecast & Scenario Objectives
- 1.3 Report Scope
- 1.3.1 UAE Over-the-Counter (OTC) Pharmaceuticals Market Scope – Types & Subtypes Covered
- 1.3.2 Geographic Scope – Regions & Countries Covered
- 1.3.3 Historical Period, Base Year & Forecast Period (the historical period; forecast to 2032)
- 1.3.4 Inclusions & Exclusions
- 1.4 HS Code & Classification Framework
- 1.5 Currency, Units & Pricing Basis
- 1.6 Target Stakeholders
- 1.7 Limitations & Assumptions
Chapter 2. Executive Summary
- 2.1 Global UAE Over-the-Counter (OTC) Pharmaceuticals Market Market Snapshot
- 2.1.1 Market Size – Historical (the historical period) & Forecast (2032) (base year: USD 2,913 million → 2032: USD 4,110.63 million)
- 2.1.2 Volume & Revenue – Global Totals
- 2.1.3 Key Market Highlights – Top Five Facts
- 2.2 UAE Over-the-Counter (OTC) Pharmaceuticals Market Market Segmentation Snapshot
- 2.2.1 Market Split by Region – vs. 2032
- 2.3 Competitive Snapshot
- 2.3.1 Top 10 Players by Revenue Share –
- 2.3.2 Top 10 Players by Volume Share –
- 2.3.3 Recent Strategic Developments (18-Month Summary)
- 2.4 Key Investment Highlights & Strategic Conclusions
Chapter 3. UAE Over-the-Counter (OTC) Pharmaceuticals Market Market Dynamics & Industry Analysis
- 3.1 Market Overview & Context
- 3.1.1 UAE Over-the-Counter (OTC) Pharmaceuticals Market Market Position in the Broader Automotive Value Chain
- 3.1.2 OEM vs. Replacement Market Dynamics
- 3.1.3 Market Maturity & Development Stage by Region
- 3.2 UAE Over-the-Counter (OTC) Pharmaceuticals Market Market Drivers
- 3.3 UAE Over-the-Counter (OTC) Pharmaceuticals Market Market Restraints & Challenges
- 3.4 UAE Over-the-Counter (OTC) Pharmaceuticals Market Market Opportunities
- 3.5 Porter's Five Forces Analysis
- 3.5.1 Threat of New Entrants
- 3.5.2 Bargaining Power of Suppliers
- 3.5.3 Bargaining Power of Buyers
- 3.5.4 Threat of Substitutes
- 3.5.5 Competitive Rivalry – Intensity Assessment
- 3.6 UAE Over-the-Counter (OTC) Pharmaceuticals Market Value Chain Analysis
- 3.6.1 Upstream – Raw Material/Input Suppliers
- 3.6.1.1 Raw Material/Input 1
- 3.6.1.2 Raw Material/Input 2
- 3.6.1.3 Raw Material/Input 3
- 3.6.2 Midstream – Production/Manufacturing/Service Delivery
- 3.6.2.1 Production/Process Overview
- 3.6.2.2 Key Facility Locations & Capacity by Manufacturer
- 3.6.3 Downstream – Distribution & End Consumer
- 3.6.3.1 Primary Channel – B2B/OEM
- 3.6.3.2 Secondary Channels – Dealer, Retail, Online, Direct
- 3.6.4 Value Chain Profitability Analysis
- 3.6.1 Upstream – Raw Material/Input Suppliers
- 3.7 PESTEL Analysis
- 3.7.1 Political Factors
- 3.7.2 Economic Factors
- 3.7.3 Social Factors
- 3.7.4 Technological Factors
- 3.7.5 Environmental Factors
- 3.7.6 Legal Factors
- 3.8 UAE Over-the-Counter (OTC) Pharmaceuticals Market Supply Chain Analysis
- 3.8.1 Raw Material/Input Supply Risk Assessment
- 3.8.2 Manufacturing Concentration Risk (Geographic Exposure)
- 3.8.3 Trade Disruption Impact Analysis
- 3.9 Regulatory & Policy Landscape
Note: The regulatory and policy landscape section covers regulations based on their applicability to the market, UAE Over-the-Counter (OTC) Pharmaceuticals Market category, geography, and scope of the study. Only regulatory frameworks with a material impact on operations, compliance, trade, sustainability, or market access are analyzed in detail.
Chapter 4. Key Investment Pockets & Opportunity Analysis
- 4.1 UAE Over-the-Counter (OTC) Pharmaceuticals Market Market Attractiveness Analysis
- 4.1.1 By Region – Investment Attractiveness Matrix (Volume × CAGR)
- 4.2 Absolute Revenue Growth Opportunity
- 4.2.1 By Region – Absolute USD Growth Through 2032
- 4.3 Incremental Volume Opportunity
- 4.3.1 By Region – Incremental Volume Through 2032
- 4.3.2 Segment – Incremental Volume
- 4.4 Emerging Submarket Opportunity Deep Dive (Subject to Applicability)
- 4.5 Emerging Market Opportunity Scorecards
- 4.5.1 United States
- 4.5.2 Europe
- 4.5.3 Asia
- 4.5.4 Middle East & Africa
Note: Emerging Market Opportunity Scorecards will be included based on relevance and strategic importance. Regions listed are indicative and may vary depending on data availability and market dynamics.
Chapter 5. UAE Over-the-Counter (OTC) Pharmaceuticals Market Import-Export Analysis & Trade Flows
- 5.1 Global Trade Overview
- 5.1.1 Global Export Value by Country (the historical period)
- 5.1.2 Global Export Volume by Country (the historical period)
- 5.1.3 Global Import Value by Country (the historical period)
- 5.1.4 Global Import Volume by Country (the historical period)
- 5.1.5 Net Trade Balance by Country (the historical period)
- 5.2 Export Analysis – Segment
- 5.2.1 Type 1 (HS Code)
- 5.2.2 Type 2 (HS Code)
- 5.2.3 Type 3 (HS Code)
- 5.2.4 Type 4 (HS Code)
- 5.2.5 Type 5 (HS Code)
- 5.3 Import Analysis – Segment
- 5.3.1 Type 1 (HS Code)
- 5.3.2 Type 2 (HS Code)
- 5.3.3 Type 3 (HS Code)
- 5.3.4 Type 4 (HS Code)
- 5.3.5 Type 5 (HS Code)
- 5.4 Average Unit Trade Prices
- 5.4.1 Average Export Price – Segment & Country
- 5.4.2 Average Import Price – Segment & Source Country
- 5.4.3 Price Trends (the historical period)
- 5.5 Key Trade Route Analysis
- 5.5.1 Trade Route 1
- 5.5.2 Trade Route 2
- 5.5.3 Trade Route 3
- 5.5.4 Trade Route 4
- 5.5.5 Trade Route 5
- 5.6 Trade Policy Impact Assessment
- 5.6.1 US Anti-Dumping & Section 301 Tariffs
- 5.6.2 EU Customs Union Impact
- 5.6.3 Major Free Trade Agreements
- 5.6.4 USMCA Rules of Origin
Note: Trade policy analysis will be included only where relevant to the UAE Over-the-Counter (OTC) Pharmaceuticals Market market.
Chapter 6. Competitive Landscape & Company Benchmarking
- 6.1 UAE Over-the-Counter (OTC) Pharmaceuticals Market Market Concentration & Structure
- 6.1.1 Herfindahl-Hirschman Index (HHI) – vs.
- 6.1.2 Tier 1, Tier 2 & Tier 3 Market Structure
- 6.1.3 Global, Regional & Local Player Dynamics
- 6.2 UAE Over-the-Counter (OTC) Pharmaceuticals Market Market Share Analysis –
- 6.2.1 Global Revenue Share by Company
- 6.2.2 Global Volume Share by Company
- 6.2.3 Regional Revenue Share
- 6.2.4 Market Share Evolution ( vs. )
- 6.2.5 OEM Segment Share by Company
- 6.2.6 Replacement Segment Share by Company
- 6.3 Production/Delivery Capacity & Facility Analysis
- 6.3.1 Global Installed Capacity
- 6.3.2 Capacity Utilization Rates
- 6.3.3 Production/Output Volume
- 6.3.4 Facility Locations & Capacity Map
- 6.3.5 Planned Capacity Additions
- 6.4 UAE Over-the-Counter (OTC) Pharmaceuticals Market Competitive Benchmarking Matrix
- 6.4.1 Revenue, Volume, CAGR & Profitability Comparison
- 6.4.2 Channel Revenue Mix
- 6.4.3 Geographic Revenue Exposure
- 6.4.4 R&D Intensity
- 6.4.5 Sustainability Maturity
- 6.5 Strategic Developments in UAE Over-the-Counter (OTC) Pharmaceuticals Market (Last 24 Months)
- 6.5.1 Mergers, Acquisitions & Divestments
- 6.5.2 New UAE Over-the-Counter (OTC) Pharmaceuticals Market Launches
- 6.5.3 Facility Expansions
- 6.5.4 Strategic Alliances, Joint Ventures & Partnerships
- 6.5.5 Distribution Expansion & Market Entry
- 6.5.6 Sustainability & ESG Initiatives
- 6.6 Competitive Strategy Mapping
- 6.6.1 Leader, Challenger, Follower & Niche Classification
- 6.6.2 Pricing Strategy Comparison
- 6.6.3 Channel Strategy Matrix
Note: Strategic developments are included based on their materiality and the availability of reliable information.
Chapter 7. Global UAE Over-the-Counter (OTC) Pharmaceuticals Market Market – By Distribution Channel
- 7.1 Segment Overview
- 7.1.1 Volume & Revenue Split by Channel ( & 2032)
- 7.1.2 Channel Mix Evolution (2032)
Chapter 8. Regional Market Analysis – Global Overview
- 8.1 Global Regional Overview
- 8.1.1 Regional Volume Share
- 8.1.2 Regional Revenue Share
- 8.1.3 Regional Volume by Region
- 8.1.4 Regional Revenue by Region
- 8.1.5 Regional Forecast Through 2032
- 8.2 Cross-Regional Segment Analysis
- 8.2.1 By Distribution Channel
- 8.2.2 By Brand/Price Tier
Chapter 9. North America UAE Over-the-Counter (OTC) Pharmaceuticals Market Market
- 9.1 United States
- 9.2 Canada
- 9.3 Mexico
Chapter 10. Europe UAE Over-the-Counter (OTC) Pharmaceuticals Market Market
- 10.1 Germany
- 10.2 France
- 10.3 Italy
- 10.4 United Kingdom
- 10.5 Spain
- 10.6 Poland
- 10.7 Russia
- 10.8 Netherlands
- 10.9 Belgium
- 10.10 Sweden
- 10.11 Denmark
- 10.12 Norway
- 10.13 Rest of Europe
Chapter 11. Asia Pacific UAE Over-the-Counter (OTC) Pharmaceuticals Market Market
- 11.1 China
- 11.2 India
- 11.3 Japan
- 11.4 South Korea
- 11.5 Thailand
- 11.6 Indonesia
- 11.7 Vietnam
- 11.8 Malaysia
- 11.9 Australia
- 11.10 Rest of Asia Pacific
Chapter 12. Latin America UAE Over-the-Counter (OTC) Pharmaceuticals Market Market
- 12.1 Brazil
- 12.2 Argentina
- 12.3 Colombia
- 12.4 Chile
- 12.5 Rest of Latin America
Chapter 13. Middle East UAE Over-the-Counter (OTC) Pharmaceuticals Market Market
- 13.1 Saudi Arabia
- 13.2 United Arab Emirates
- 13.3 Turkey
- 13.4 Israel
- 13.5 Iran
- 13.6 Rest of the Middle East
Chapter 14. Africa UAE Over-the-Counter (OTC) Pharmaceuticals Market Market
- 14.1 South Africa
- 14.2 Egypt
- 14.3 Nigeria
- 14.4 Morocco
- 14.5 Rest of Africa
Chapter 15. UAE Over-the-Counter (OTC) Pharmaceuticals Market Company Profiles
- 15.1 [Company 01]
- 15.1.1 Company Overview
- 15.1.2 Key Management Personnel
- 15.1.3 Products & Services Portfolio
- 15.1.4 Financial Performance
- 15.1.5 Key Market Focus & Geographic Presence
- 15.1.6 Recent Developments & Strategic Initiatives
Note: The company profile list is preliminary and may change based on research findings, market developments, data availability, and client requirements.
Chapter 16. Appendices
- Appendix A – List of Abbreviations & Acronyms
- Appendix B – Industry Classification Code Reference – Full Series
- Appendix C – Production & Capacity Data Tables
- Appendix D – End-Use & Demand Base Tables
- Appendix E – Consumption & Replacement Rate Assumptions
- Appendix F – ASP Reference Tables
- Appendix G – Manufacturing & Facility Database
- Appendix H – Import-Export Data Tables
- Appendix I – Regulatory Summary Tables
- Appendix J – Primary Research Participant List (Anonymized)
- Appendix K – Primary Research Questionnaire Framework
- Appendix L – Data Sources & Bibliography
- Appendix M – Market Size Divergence & Source Comparison
Chapter 17. Research Methodology
- 17.1 Research Framework & Philosophy
- 17.2 Secondary Research – Sources, Hierarchy & Data Extraction
- 17.3 Data Modeling – Bottom-Up & Top-Down Market Sizing
- 17.4 Primary Research – Stakeholder Framework, LOI & Sample Sizes
- 17.5 Forecast Methodology – Regression, Scenario & Sensitivity Analysis
- 17.6 Quality Control – Four-Layer Validation Framework
- 17.7 Limitations & Standard Assumptions
- 17.8 Disclaimer
