Market Overview:
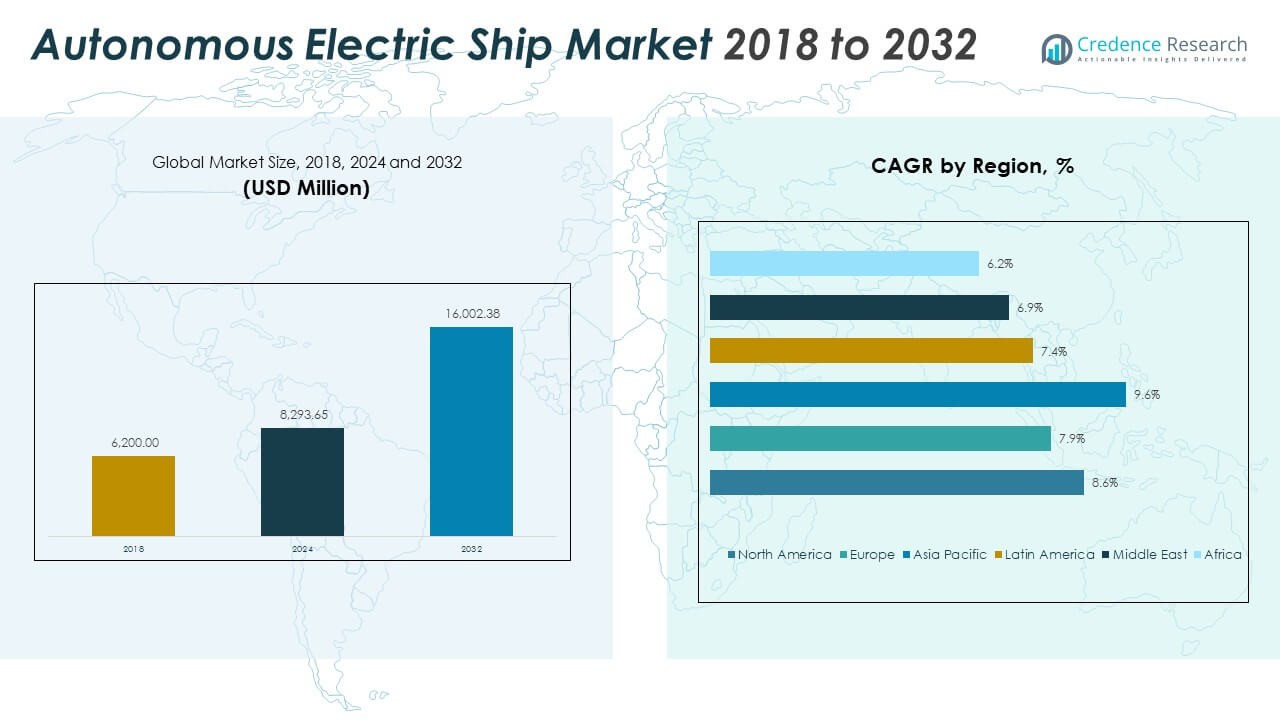
The Global Autonomous Electric Ship Market size was valued at USD 6,200.00 million in 2018 to USD 8,293.65 million in 2024 and is anticipated to reach USD 16,002.38 million by 2032, at a CAGR of 8.61% during the forecast period.
| REPORT ATTRIBUTE |
DETAILS |
| Historical Period |
2020-2023 |
| Base Year |
2024 |
| Forecast Period |
2025-2032 |
| Autonomous Electric Ship Market Size 2024 |
USD 8,293.65 Million |
| Autonomous Electric Ship Market, CAGR |
8.61% |
| Autonomous Electric Ship Market Size 2032 |
USD 16,002.38 Million |
The market growth is driven by the rapid advancement in maritime automation, electrification, and navigation technologies. Increasing focus on reducing carbon emissions and improving operational efficiency has accelerated adoption across commercial, defense, and logistics sectors. Growing investment in smart ship technologies, coupled with regulatory support for sustainable marine transport, is promoting large-scale integration of electric propulsion and autonomous navigation systems worldwide.
Regionally, Europe dominates the global market, supported by strong maritime innovation, extensive R&D, and government-led green shipping initiatives. North America follows due to technological innovation and early adoption of autonomous maritime solutions. The Asia-Pacific region is emerging as a fast-growing market driven by expanding shipbuilding capabilities, increasing trade volumes, and supportive government programs promoting clean and autonomous marine transportation.
Access crucial information at unmatched prices!
Request your sample report today & start making informed decisions powered by Credence Research Inc.!
Download Sample
Market Insights:
- The Global Autonomous Electric Ship Market was valued at USD 6,200.00 million in 2018, reached USD 8,293.65 million in 2024, and is projected to attain USD 16,002.38 million by 2032, expanding at a CAGR of 8.61%.
- Asia Pacific holds the largest share of about 32%, supported by strong shipbuilding capacity, rapid automation, and government-led electrification programs. North America follows with nearly 27%, driven by high R&D investment and technological innovation, while Europe accounts for 25% due to strict sustainability regulations.
- Asia Pacific remains the fastest-growing region with a CAGR of 9.6%, fueled by expanding trade routes, cost-efficient production, and smart port initiatives.
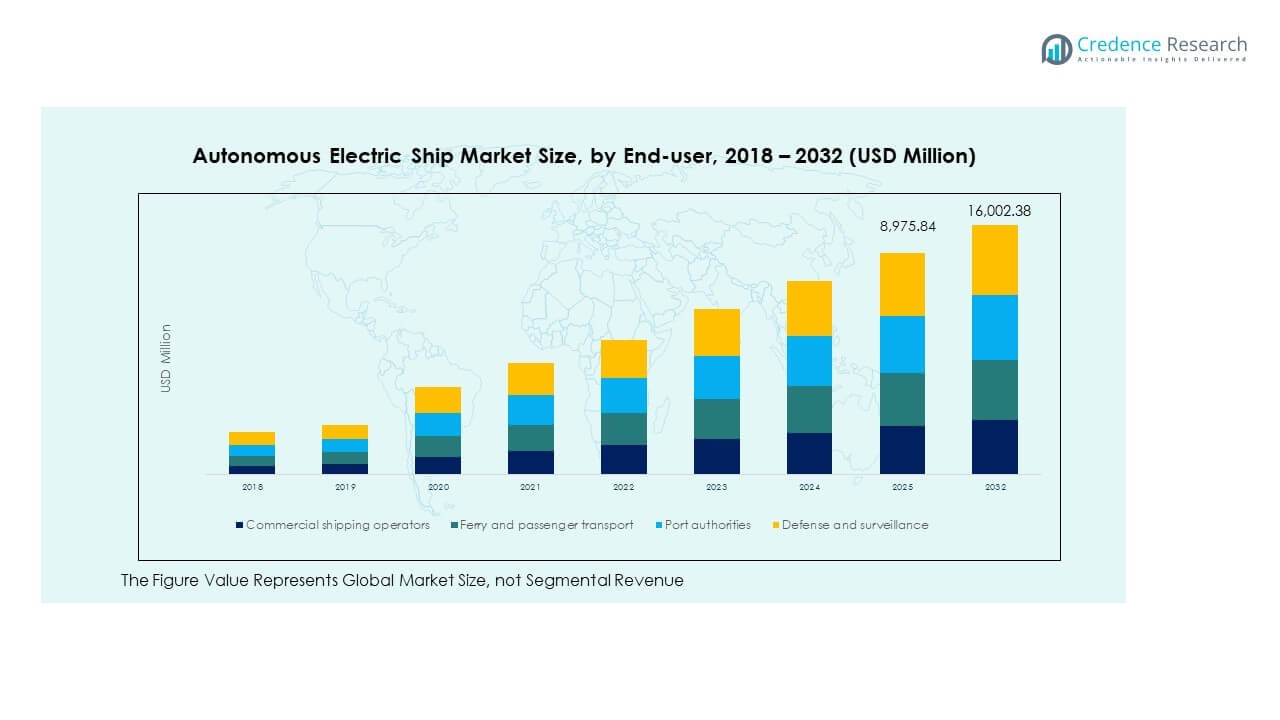
- Commercial shipping operators dominate the end-user segment, representing around 40% of total demand due to large-scale fleet electrification and automation in logistics.
- Defense and surveillance applications contribute approximately 25% share, supported by rising naval modernization programs and adoption of unmanned electric patrol vessels.
Market Drivers:
Rising Demand for Energy-Efficient and Sustainable Maritime Operations
The Global Autonomous Electric Ship Market is driven by increasing emphasis on sustainability and energy efficiency in maritime transport. Companies are adopting electric propulsion systems to reduce greenhouse gas emissions and operational costs. Governments are enforcing stricter emission regulations, encouraging faster transition to zero-emission vessels. The rise in global trade volume and demand for smart shipping solutions supports this trend. It benefits from automation and electrification that improve navigation precision and fuel savings. Growing investments in renewable marine energy sources also enhance adoption. Technological innovation in battery systems and hybrid propulsion models is reshaping ship design. The integration of intelligent systems is becoming central to achieving sustainable maritime goals.
- For instance, ABB’s Onboard DC Grid™ power system allows fuel savings and overall efficiency improvements between 5 and 20 percent on vessels equipped with advanced battery integration schemes. Similarly, the MS Color Hybrid, developed by Wärtsilä and Fosen Yard, operates as the world’s largest plug-in hybrid vessel and achieves up to a 15 percent reduction in greenhouse gas emissions compared to conventional diesel propulsion.
Advancements in Artificial Intelligence and Autonomous Navigation Systems
Rapid advancements in artificial intelligence, sensors, and autonomous control systems are propelling market growth. These technologies enable ships to perform complex tasks like route optimization and obstacle avoidance with minimal human input. The Global Autonomous Electric Ship Market is evolving toward fully autonomous navigation supported by real-time data and satellite connectivity. AI algorithms enhance operational safety and predictive maintenance, reducing risks and downtime. Continuous development in robotics and machine learning contributes to vessel efficiency. The deployment of integrated control systems allows remote monitoring of fleets. It ensures better decision-making and performance management across vessels. The shift toward autonomy is transforming traditional shipping into a data-driven ecosystem.
- For instance, the Yara Birkeland, developed by Yara International and Kongsberg, is the world’s first zero-emission, fully electric autonomous container ship—removing 40,000 annual truck journeys and significantly cutting NOx and CO₂ emissions per year since entering operation.
Strong Government Support and Maritime Innovation Programs
Government-led initiatives and funding programs are encouraging the deployment of autonomous electric vessels. Many nations are investing in digital ports and smart shipping infrastructure to promote eco-friendly operations. The Global Autonomous Electric Ship Market benefits from policy frameworks supporting green technology and maritime automation. Research collaborations between public and private entities are advancing innovation in navigation systems. Incentives for adopting electric propulsion are reducing financial barriers for shipowners. Governments are focusing on electrification of coastal and inland transport routes to meet climate targets. The development of testbeds and pilot projects is validating the commercial potential of autonomous systems. It strengthens global competitiveness in sustainable maritime technology.
Growing Commercial and Defense Sector Adoption of Autonomous Ships
Rising demand from commercial and defense sectors is accelerating adoption across applications. Shipping companies are investing in autonomous cargo vessels to reduce crew costs and improve efficiency. The Global Autonomous Electric Ship Market is witnessing expansion into naval and research applications. Defense agencies are developing autonomous patrol and surveillance vessels to enhance maritime security. Commercial fleets are leveraging automation to improve route safety and operational reliability. The integration of electric propulsion with AI-driven control systems supports energy efficiency. Growing focus on reducing human error and enhancing safety standards is driving deployment. It is setting a new benchmark for future marine transportation systems.
Market Trends:
Integration of Smart and Connected Maritime Ecosystems
The Global Autonomous Electric Ship Market is experiencing a strong trend toward connected maritime networks. Integration of IoT, cloud computing, and real-time analytics is transforming vessel communication and control systems. Smart ports and digital twin technologies are improving logistics coordination and fleet management. The use of sensors for predictive maintenance is reducing downtime and increasing reliability. It is fostering seamless data exchange between ships and shore-based systems. Increased use of edge computing is enhancing data security and decision-making. The trend is shaping a more efficient and transparent maritime environment. It strengthens collaboration among shipbuilders, operators, and technology providers.
- For instance, Siemens partnered with HD Hyundai Mipo to deploy a digital manufacturing platform in 2024, enabling automation and a digitally connected shipyard for predictive planning and reduced roll-out time. DNV’s Veracity platform, in partnership with ZeroNorth, launched a vessel data management system supporting end-to-end emissions analytics and verification across large commercial fleets as of 2025.
Development of Modular and Scalable Ship Designs
The trend toward modular shipbuilding is gaining momentum across the industry. Manufacturers are designing vessels with interchangeable electric and automation modules for faster upgrades. The Global Autonomous Electric Ship Market is benefiting from customizable ship designs that reduce maintenance and lifecycle costs. Modularization supports faster integration of propulsion and sensor systems. It allows operators to adapt vessels to different cargo or defense missions. The approach reduces production time and supports circular manufacturing principles. It also facilitates rapid adoption of emerging technologies without full redesigns. The shift enhances long-term operational flexibility and sustainability.
- For instance, Damen Shipyards has begun retrofitting existing vessels like the Damen Stan Patrol 900 with modular electric drives and sensor suites for autonomous navigation trials, demonstrating rapid conversion from diesel to electric propulsion. Hyundai’s collaboration with Siemens targets advanced modular shipbuilding and computer-aided design innovations to digitally twin and modularize vessel builds.
Growing Use of Advanced Batteries and Hybrid Propulsion Technologies
Battery innovation is becoming a defining trend in autonomous electric vessels. Companies are adopting high-capacity lithium-ion and solid-state batteries for longer sailing ranges. The Global Autonomous Electric Ship Market is transitioning toward hybrid propulsion combining electric and renewable energy sources. Improved battery safety, energy density, and lifecycle performance are supporting global adoption. It helps meet emission goals while optimizing power distribution across systems. Advancements in fast-charging infrastructure are also enabling port-based energy management. This progress supports seamless integration between electric vessels and smart grid networks. The innovation in storage solutions enhances endurance and reliability across operations.
Expansion of Remote Operations and Cloud-Based Fleet Management
The shift toward remote and cloud-based vessel operations is transforming maritime management. Companies are using centralized platforms to monitor performance, energy usage, and route optimization. The Global Autonomous Electric Ship Market benefits from increased efficiency through cloud connectivity and AI-powered analytics. Remote operations centers are becoming standard for fleet supervision and decision-making. It allows faster response to navigation risks and equipment failures. Cybersecurity systems are being strengthened to protect critical communication links. Real-time monitoring supports reduced manning requirements while maintaining safety standards. The trend is redefining operational control and reducing dependence on onboard personnel.
Market Challenges Analysis:
High Capital Investment and Complex Regulatory Frameworks
The Global Autonomous Electric Ship Market faces challenges from high upfront costs associated with automation and electric propulsion systems. The integration of advanced sensors, batteries, and navigation modules increases development expenses. Smaller operators struggle to justify investment due to uncertain return timelines. The lack of standardized global regulations for autonomous shipping creates further complexity. Each region enforces different safety, certification, and testing protocols. It limits cross-border deployment of autonomous vessels. The evolving regulatory landscape requires collaboration between governments, classification societies, and shipbuilders. These challenges slow down commercialization and adoption in developing maritime economies.
Cybersecurity Risks and Limited Infrastructure for Electric Propulsion
Growing connectivity exposes vessels to cybersecurity threats that can disrupt operations. The Global Autonomous Electric Ship Market faces challenges in securing autonomous control networks and cloud-based systems. Vulnerabilities in data transmission and remote access increase the risk of hacking and signal interference. The absence of widespread charging infrastructure also restricts long-range electric navigation. Many ports lack facilities for fast recharging or renewable power integration. It increases operational downtime and limits scalability. Addressing cybersecurity risks and building robust energy networks are crucial for market sustainability. Industry players are investing in encryption, redundancy, and port electrification to mitigate these barriers.
Market Opportunities:
Expansion of Green Shipping Corridors and Smart Port Infrastructure
The Global Autonomous Electric Ship Market is positioned to benefit from growing development of green shipping corridors. Countries are investing in smart ports equipped with renewable power grids and digital logistics systems. It creates opportunities for autonomous electric vessels to operate efficiently and meet emission targets. Collaborations between governments and technology companies are strengthening the ecosystem for sustainable maritime transport. The deployment of AI-driven traffic management and energy optimization tools supports faster adoption.
Emergence of Autonomous Logistics and Offshore Support Applications
The rise of autonomous logistics solutions and offshore support vessels is creating new market opportunities. The Global Autonomous Electric Ship Market is expanding into offshore energy, research, and cargo supply operations. Demand for unmanned vessels in inspection, surveillance, and environmental monitoring is rising. Electric and autonomous integration helps reduce crew risks and enhance precision in complex environments. Strategic partnerships between shipbuilders and software firms are driving innovative product launches. It opens pathways for diverse applications across global waters.
Market Segmentation Analysis:
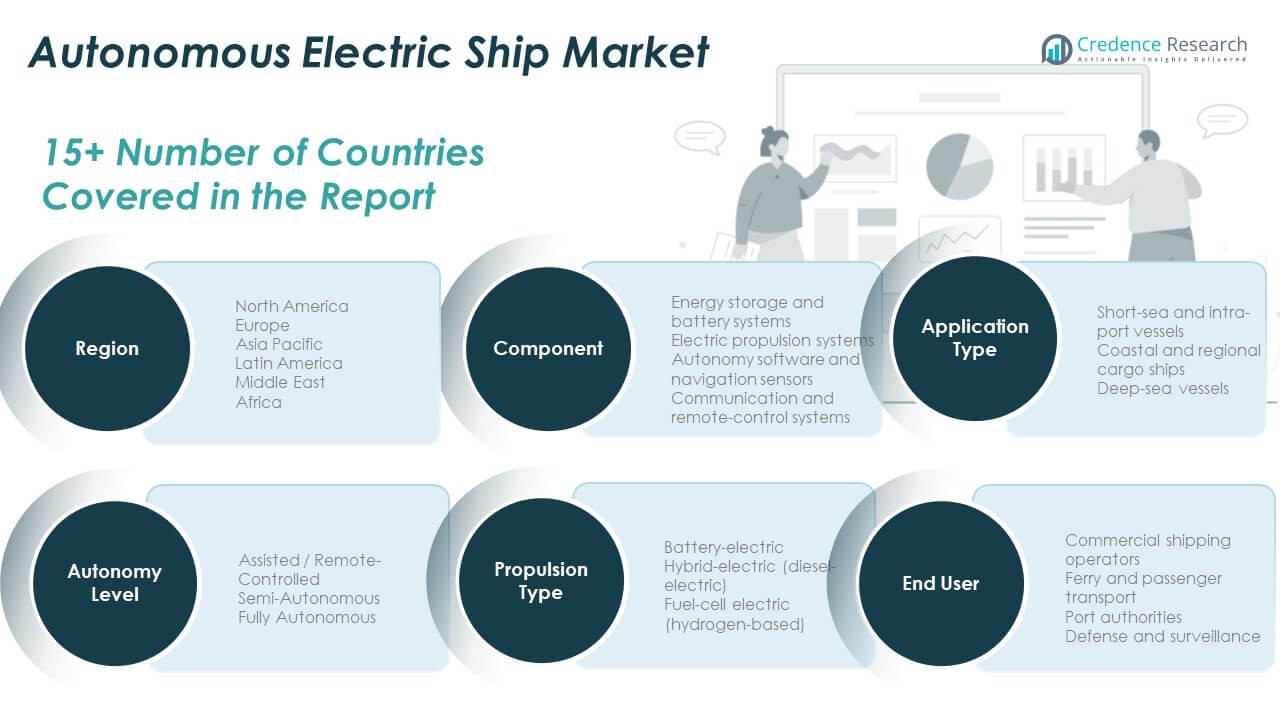
By Component
The Global Autonomous Electric Ship Market is segmented into energy storage and battery systems, electric propulsion systems, autonomy software and navigation sensors, and communication and remote-control systems. Energy storage and battery systems form the foundation for vessel efficiency and endurance, driving adoption of advanced lithium-ion and solid-state technologies. Electric propulsion systems enhance energy utilization and reduce emissions, aligning with global sustainability goals. Autonomy software and navigation sensors enable precision control and situational awareness. Communication and remote-control systems ensure connectivity and operational safety across fleets.
- For instance, the MS Color Hybrid uses a Siemens 5 MWh battery pack to support hour-long zero-emission operation in port and coastal waters. ABB’s digital solutions have modernized large cruise ships with DC technology and fully integrated shore connections, boosting system efficiency and enabling future renewable integration.
By Application
The market covers short-sea and intra-port vessels, coastal and regional cargo ships, and deep-sea vessels. Short-sea vessels dominate due to their suitability for electric propulsion and autonomous control. Coastal and regional ships are witnessing adoption driven by trade modernization. Deep-sea vessels represent a future growth avenue supported by extended-range battery development.
- For instance, Yara Birkeland is used for short-sea container transport between Yara’s production plant and Brevik port in Norway, reducing emissions and road traffic. Deep-sea applications are advancing, with international operators piloting hybrid solutions for survey, research, and offshore missions.
By End-User
Key end users include commercial shipping operators, ferry and passenger transport, port authorities, and defense and surveillance agencies. Commercial operators lead adoption to enhance fuel efficiency and reduce costs. Port authorities are integrating automation for smarter harbor operations, while defense agencies invest in unmanned surveillance fleets for security missions.
By Autonomy Level and Propulsion Type
The market is categorized by autonomy levels—assisted or remote-controlled, semi-autonomous, and fully autonomous. Semi-autonomous systems dominate current deployment, while fully autonomous vessels are under rapid testing. By propulsion type, the market includes battery-electric, hybrid-electric, and fuel-cell electric systems. Hybrid-electric ships hold a strong presence, while hydrogen-based fuel-cell systems are gaining momentum for long-range operations.
Segmentation:
By Component
- Energy storage and battery systems
- Electric propulsion systems
- Autonomy software and navigation sensors
- Communication and remote-control systems
By Application
- Short-sea and intra-port vessels
- Coastal and regional cargo ships
- Deep-sea vessels
By End-User
- Commercial shipping operators
- Ferry and passenger transport
- Port authorities
- Defense and surveillance
By Autonomy Level
- Assisted / Remote-Controlled
- Semi-Autonomous
- Fully Autonomous
By Propulsion Type
- Battery-electric
- Hybrid-electric (diesel-electric)
- Fuel-cell electric (hydrogen-based)
By Region
- North America
- Europe
- Germany
- France
- U.K.
- Italy
- Spain
- Rest of Europe
- Asia Pacific
- China
- Japan
- India
- South Korea
- South-east Asia
- Rest of Asia Pacific
- Latin America
- Brazil
- Argentina
- Rest of Latin America
- Middle East & Africa
- GCC Countries
- South Africa
- Rest of the Middle East and Africa
Regional Analysis:
North America
The North America Global Autonomous Electric Ship Market size was valued at USD 1,779.40 million in 2018 to USD 2,343.74 million in 2024 and is anticipated to reach USD 4,514.30 million by 2032, at a CAGR of 8.6% during the forecast period. North America accounts for around 27% of the global market share, driven by strong technological adoption and advanced maritime infrastructure. The U.S. leads regional development, supported by innovation in electric propulsion, AI navigation, and maritime cybersecurity. Canada and Mexico are investing in port modernization and sustainable shipping corridors. It benefits from major shipbuilders and technology companies collaborating on autonomous vessel prototypes. The presence of defense contracts and research projects enhances regional competitiveness. Regulations promoting emission-free operations and automation integration further accelerate adoption. The regional market is positioned to remain a leader in next-generation maritime technologies.
Europe
The Europe Global Autonomous Electric Ship Market size was valued at USD 1,636.80 million in 2018 to USD 2,104.70 million in 2024 and is anticipated to reach USD 3,836.61 million by 2032, at a CAGR of 7.9% during the forecast period. Europe contributes approximately 25% of the global market share, driven by its strong maritime legacy and green technology initiatives. Norway, the UK, and Finland are front-runners in testing autonomous shipping corridors. The region has extensive R&D investment in hybrid-electric and zero-emission vessels. It benefits from strict environmental regulations and incentives for sustainable ship operations. European shipyards are collaborating with tech firms to build energy-efficient designs. Governments are funding digital port ecosystems to support automation. The region continues to strengthen its position as a hub for smart maritime innovation.
Asia Pacific
The Asia Pacific Global Autonomous Electric Ship Market size was valued at USD 2,120.40 million in 2018 to USD 2,926.38 million in 2024 and is anticipated to reach USD 6,069.72 million by 2032, at a CAGR of 9.6% during the forecast period. Asia Pacific holds the largest share at around 32%, supported by rapid shipbuilding growth and expanding maritime trade. China, Japan, and South Korea dominate production and integration of autonomous electric vessels. It benefits from cost-effective manufacturing and government support for digital and green shipping technologies. India and Southeast Asia are emerging players focusing on smart port initiatives. Regional collaboration on hydrogen-based propulsion and automation projects is strengthening innovation capacity. Expanding trade routes and defense modernization efforts are driving vessel demand. The region is expected to remain the fastest-growing market through the forecast period.
Latin America
The Latin America Global Autonomous Electric Ship Market size was valued at USD 334.80 million in 2018 to USD 442.80 million in 2024 and is anticipated to reach USD 782.04 million by 2032, at a CAGR of 7.4% during the forecast period. Latin America accounts for nearly 6% of the global market share, driven by modernization in coastal shipping and port automation. Brazil and Mexico are leading regional efforts toward smart and sustainable maritime operations. It is witnessing growing collaboration between logistics firms and technology providers. Infrastructure upgrades and digital navigation adoption are improving regional competitiveness. Government initiatives supporting clean transportation are strengthening growth. Challenges such as limited R&D funding persist, but gradual adoption is expected to continue. The region is transitioning toward automation in niche commercial and passenger transport applications.
Middle East
The Middle East Global Autonomous Electric Ship Market size was valued at USD 192.20 million in 2018 to USD 237.14 million in 2024 and is anticipated to reach USD 401.75 million by 2032, at a CAGR of 6.9% during the forecast period. The Middle East holds around 5% of the global market share, supported by rising maritime investments and port automation initiatives. The UAE and Saudi Arabia are leading smart port projects integrating electric and autonomous technologies. It benefits from trade diversification and energy transition goals across Gulf nations. The region is investing in coastal electrification and hydrogen-based propulsion systems. Maritime logistics companies are testing pilot projects in short-sea routes. Expanding seaborne trade and digital connectivity are boosting adoption. The regional focus on sustainable transport infrastructure is likely to enhance long-term opportunities.
Africa
The Africa Global Autonomous Electric Ship Market size was valued at USD 136.40 million in 2018 to USD 238.89 million in 2024 and is anticipated to reach USD 397.97 million by 2032, at a CAGR of 6.2% during the forecast period. Africa contributes nearly 5% of the global market share, driven by increasing efforts to modernize maritime logistics and port systems. South Africa and Egypt are leading markets focusing on automation in coastal trade and naval operations. It benefits from international investments aimed at upgrading port electrification infrastructure. Regional initiatives to promote clean energy and smart navigation are gaining traction. Limited technological expertise and funding remain key barriers. However, the adoption of autonomous electric systems is expected to rise gradually. Partnerships with global players are fostering capacity building and maritime innovation across key African ports.
Shape Your Report to Specific Countries or Regions & Enjoy 30% Off!
Key Player Analysis:
- ABB Ltd.
- Wärtsilä Corporation
- Siemens AG
- Rolls-Royce Holdings plc
- Kongsberg Gruppen ASA
- Sea Machines Robotics
- Avikus (Hyundai Heavy Industries Group)
- Fugro N.V.
- Mitsubishi Heavy Industries
- Kawasaki Heavy Industries
- L3Harris Technologies
- Honeywell International
- Maersk Line
Competitive Analysis:
The Global Autonomous Electric Ship Market is moderately consolidated, with leading players investing in technology integration, partnerships, and fleet automation. Companies such as ABB Ltd., Wärtsilä Corporation, Kongsberg Gruppen ASA, and Siemens AG dominate through advanced propulsion and navigation systems. It focuses on innovation in AI-based control, communication, and battery technologies. Strategic collaborations among shipbuilders, defense firms, and software developers strengthen product portfolios. Continuous R&D investment and pilot projects in autonomous shipping corridors reinforce market leadership. Emerging firms are entering niche areas, expanding competition and accelerating adoption across commercial and defense applications.
Recent Developments:
- In September 2025, ABB Ltd. completed its acquisition of BrightLoop, a French pioneer in advanced power electronics, taking a 93% controlling stake. This move significantly expands ABB’s offerings in electrification solutions tailored for challenging environments like marine, off-highway, and mining sectors. BrightLoop’s modular, high-efficiency DC/DC converters—originally used in motorsports—are now entering the marine market, aligning with ABB’s goal of accelerating electrified marine propulsion and cleaner transport systems.
- In August 2025, Wärtsilä Corporation was selected as the electrical integrator for a major battery extension project onboard the Wasaline ROPAX ferry ‘Aurora Botnia.’ This project will boost the vessel’s battery capacity from 2.2 MWh to a remarkable 12.6 MWh, making it the largest marine battery hybrid system in operation globally.
Report Coverage:
The research report offers an in-depth analysis based on component, application, end user, autonomy level, and propulsion type. It details leading market players, providing an overview of their business, product offerings, investments, revenue streams, and key applications. Additionally, the report includes insights into the competitive environment, SWOT analysis, current market trends, as well as the primary drivers and constraints. Furthermore, it discusses various factors that have driven market expansion in recent years. The report also explores market dynamics, regulatory scenarios, and technological advancements that are shaping the industry. It assesses the impact of external factors and global economic changes on market growth. Lastly, it provides strategic recommendations for new entrants and established companies to navigate the complexities of the market.
Future Outlook:
- Growing deployment of fully autonomous ships for commercial and defense operations.
- Expansion of hybrid-electric propulsion and advanced battery technologies.
- Increased collaboration between shipbuilders, software developers, and port authorities.
- Rising investment in AI-based navigation and route optimization systems.
- Strong focus on developing green maritime corridors and emission-free shipping.
- Wider adoption of digital twin and predictive maintenance solutions.
- Growth in regional manufacturing hubs across Asia and Europe.
- Enhanced government support through subsidies and innovation grants.
- Integration of remote fleet management and cybersecurity frameworks.
- Emergence of hydrogen fuel-cell propulsion as a future alternative.


