
Axial Compressor Market Overview:
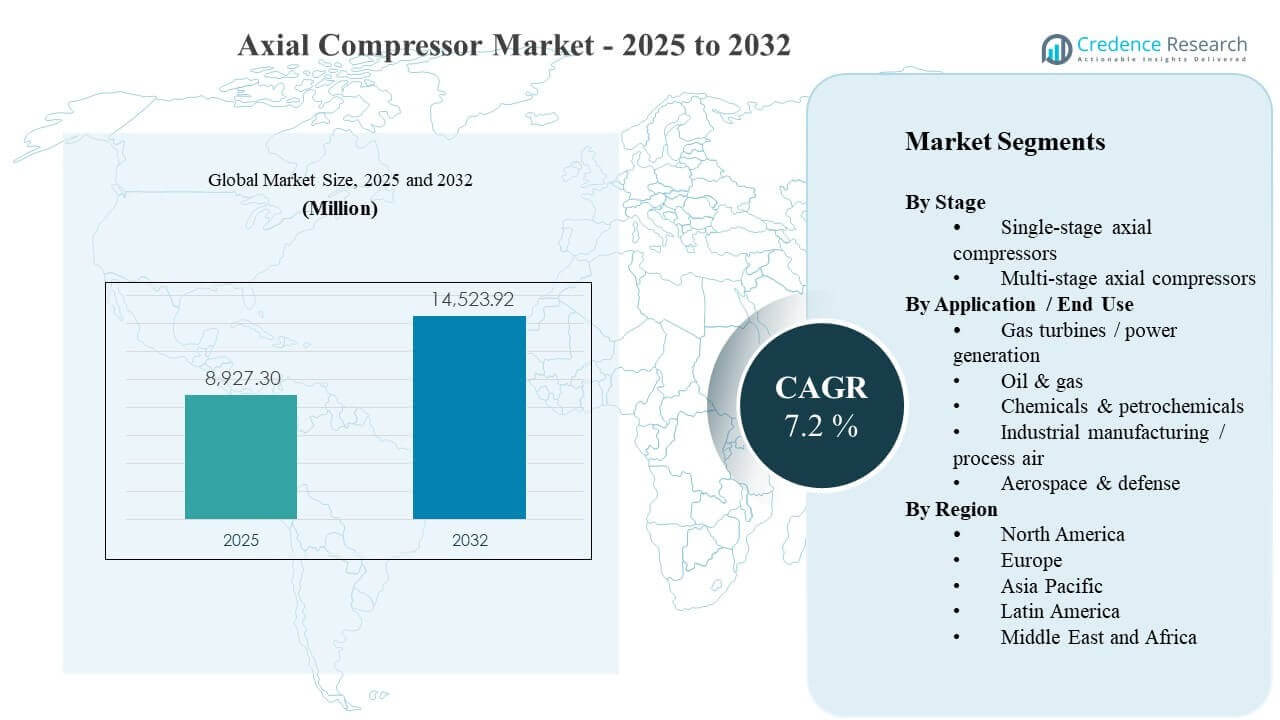
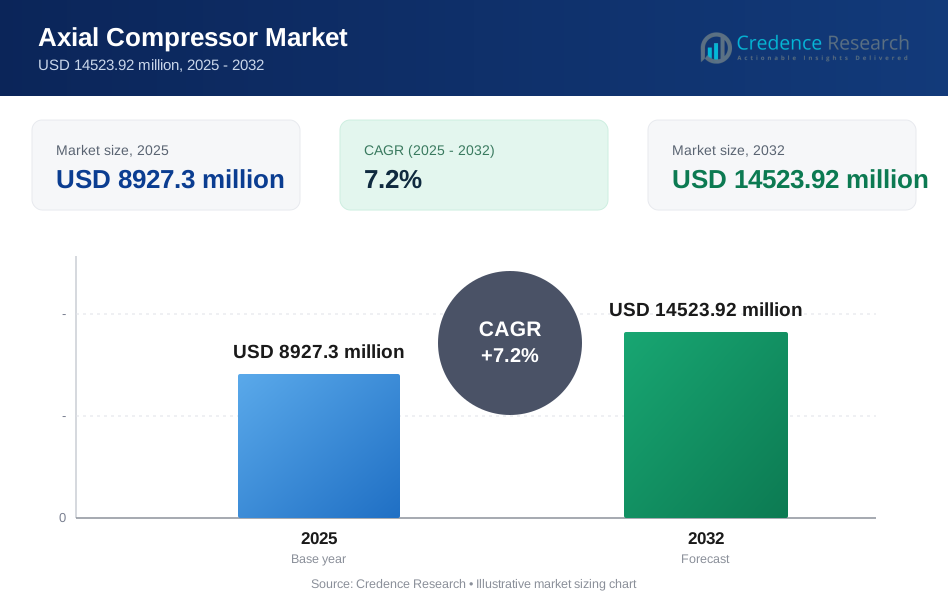
The global Axial Compressor Market size was estimated at USD 8927.3 million in 2025 and is expected to reach USD 14523.92 million by 2032, growing at a CAGR of 7.2% from 2025 to 2032. Demand growth is primarily supported by the steady buildout and upgrade cycle of large turbomachinery trains used in gas turbines and heavy process industries, where operators prioritize higher throughput and improved efficiency to reduce lifecycle operating costs. Expansion of capacity in Asia Pacific, alongside ongoing project activity in North America and the Middle East, continues to create sustained requirements for engineered compressor packages, retrofits, and aftermarket services across power and process applications.
| REPORT ATTRIBUTE | DETAILS |
|---|---|
| Historical Period | 2020-2024 |
| Base Year | 2025 |
| Forecast Period | 2026-2032 |
| Axial Compressor Market Size 2025 | USD 8927.3 million |
| Axial Compressor Market, CAGR | 7.2% |
| Axial Compressor Market Size 2032 | USD 14523.92 million |
Key Market Trends & Insights
- The Axial Compressor Market is projected to expand from USD 8927.3 million in 2025 to USD 14523.92 million by 2032, reflecting a 7.2% CAGR over 2025–2032.
- Asia Pacific accounted for the leading regional share of 34% in 2025, indicating the highest concentration of new industrial capacity additions and turbomachinery deployments.
- Multi-stage axial compressors led the stage landscape with a 62% share in 2025, supported by their suitability for higher pressure-ratio, continuous-duty operations.
- Oil & gas represented the largest end-use share at 29% in 2025, reflecting sustained demand for compression across upstream, midstream, and LNG-linked infrastructure.
- The market added USD 5596.62 million in incremental revenue potential between 2025 and 2032, supported by higher project complexity and growing retrofit intensity in mature fleets.
Segment Analysis
Axial compressor demand is closely tied to the scale and duty profile of turbomachinery trains in power generation, hydrocarbons processing, and high-throughput industrial plants. Buyers prioritize total cost of ownership, which increases the importance of aerodynamic efficiency upgrades, reliability-centered maintenance, and condition monitoring in both new-build and retrofit scenarios. Supplier selection is commonly influenced by delivery capability, proven references in similar duty classes, and the ability to integrate compressors with drivers, controls, and auxiliary systems.
Across end-use industries, procurement decisions increasingly consider operability over a wide load range, maintainability under continuous operation, and the availability of spares and service networks. As project owners pursue higher utilization and tighter energy performance, OEMs and engineered-packagers differentiate through stage redesigns, advanced blade profiles, digital diagnostics, and tailored revamp programs. These requirements collectively support steady adoption of multi-stage configurations in demanding services and stable replacement demand in established industrial bases.
By Stage Insights
Multi-stage axial compressors accounted for the largest share of 62% in 2025. Multi-stage configurations are preferred in high pressure-ratio and continuous-duty applications where stable performance, efficiency, and reliability are critical for plant economics. Process plants and large turbomachinery trains typically require higher discharge pressures and tighter operating windows, which favors multi-stage architectures. The segment also benefits from upgrade and revamp cycles that optimize stage aerodynamics to raise throughput and reduce energy consumption in installed fleets.
By Application / End Use Insights
Oil & gas accounted for the largest share of 29% in 2025. Hydrocarbon value chains require compression across multiple points including gas gathering, processing, transport, and LNG-linked infrastructure, creating consistent demand for robust compressor trains. Project operators often prioritize availability, uptime, and serviceability in remote or harsh environments, which supports long-term aftermarket revenue for established suppliers. The segment is also supported by brownfield optimization programs that modernize controls, improve efficiency, and extend operating life.
Axial Compressor Market Drivers
Expansion of gas turbine and power infrastructure
Gas turbine-based generation continues to require high-efficiency compression stages as part of integrated turbomachinery trains. Utilities and independent power producers prioritize dependable performance under variable operating conditions, increasing demand for proven compressor designs and retrofit upgrades. Modernization programs also support replacement demand as operators seek better heat-rate performance and improved availability. The market benefits from both new installations and performance uprates that extend asset life while delivering incremental output.
- For instance, Siemens Energy’s SGT5-8000H combined-cycle configuration delivers about 665 MW with around 62% efficiency, while GE’s 9HA.02 platform has been validated at roughly 64% combined-cycle efficiency with total output of about 826 MW in a 1×1 setup, illustrating how OEMs translate compressor and turbine aerodynamics into measurable heat‑rate and output gains for utilities.
Capital investment in oil, gas, and LNG-linked compression
Oil & gas value chains depend on compression for processing, transport, and liquefaction-related services, supporting steady equipment and service demand. Large projects often procure multiple compressor units per facility, raising the importance of supplier delivery capability and reference performance. Brownfield facilities also invest in revamps to reduce downtime and energy consumption, sustaining aftermarket activity. These dynamics reinforce purchasing cycles for engineered packages and long-term maintenance support.
- For instance, Baker Hughes’ scope for Qatar’s North Field expansion includes 12 Frame 9E gas turbines driving 24 centrifugal compressors across four LNG mega trains, while existing Qatargas LNG trains already operate multiple Baker Hughes Frame 9E-driven refrigerant compressors per train, underscoring how each project can incorporate several large compressor units.
Efficiency and lifecycle cost focus in process industries
Chemicals and petrochemicals plants emphasize energy efficiency because compression power consumption materially affects operating costs. Operators increasingly specify performance guarantees, stable turndown behavior, and robust monitoring to limit unplanned outages. This supports demand for improved aerodynamics, advanced materials, and integrated control systems. In addition, standardization across plants can lift volumes for certain compressor platforms and strengthen recurring service requirements.
Maintenance optimization and digital condition monitoring adoption
Operators aim to reduce total downtime by shifting from reactive maintenance to predictive programs supported by monitoring and analytics. Fleet operators value suppliers that provide diagnostics, vibration monitoring, and performance tracking integrated into broader plant reliability systems. These capabilities increase service attach rates and encourage upgrade adoption during planned outages. As a result, suppliers with strong installed bases can capture recurring revenue through spares, inspection services, and staged revamp programs.
Axial Compressor Market Challenges
Cost sensitivity remains a major barrier in markets where project owners face tighter capital discipline and demand rapid payback from equipment investments. Axial compressors used in large trains involve high upfront engineering, long lead times, and complex installation scope, which can delay purchasing decisions. Customers also scrutinize performance guarantees and reliability history, raising qualification requirements for new entrants. These factors can compress margins and increase competitive pressure during large project tenders.
- For instance, Siemens Energy cites a global H‑class fleet of 19 SGT‑8000H turbines in commercial operation (out of 76 units sold), and buyers frequently use this installed base and its multi‑hundred‑thousand operating hours as a hard screening metric when pre‑qualifying compressor train suppliers.
Supply chain constraints and execution risk continue to challenge delivery schedules, especially for high-specification rotating equipment and precision components. Engineering changes late in the project cycle can raise rework costs and create commissioning delays. In addition, customer expectations for integrated packages increase complexity across controls, auxiliaries, and compliance requirements. These conditions elevate project management intensity and can impact profitability if scope and risk allocation are not tightly controlled.
Axial Compressor Market Trends and Opportunities
Demand is increasingly shifting toward retrofit and upgrade programs that improve efficiency, output, and reliability without full plant replacement. Operators prefer solutions that can be deployed during planned outages, enabling measurable performance benefits with limited operational disruption. This trend supports opportunities in stage redesign, blade modernization, controls upgrades, and enhanced monitoring packages. Suppliers that can quantify lifecycle savings and provide strong field support can improve win rates across upgrade cycles.
- For instance, Mitsubishi Power reported that a low‑pressure steam turbine path retrofit with a new boreless rotor and longer last‑stage blades delivered more than a 10% increase in LP section efficiency after upgrade, executed within a major planned outage window so outage duration was not extended beyond the normal overhaul interval.
Decarbonization-linked infrastructure is creating new opportunities for engineered compression packages where duty profiles require high reliability and strict performance control. Hydrogen and carbon management projects often require specialized materials, tight sealing, and robust monitoring due to operating conditions and compliance standards. These applications can expand demand for packaged solutions that combine compression, auxiliaries, and service scope. Over time, such projects can build new installed bases that support recurring aftermarket revenue.
Regional Insights
North America
North America held 27% share in 2025, supported by a large installed base across gas power, industrial processing, and energy infrastructure. Buyers in this region frequently prioritize high availability and proven references for continuous-duty operations, which favors established OEMs and service providers. Retrofit and revamp activity remains important as operators seek improved efficiency and reliability from mature assets. Strong service networks and spares availability often influence supplier selection and lifecycle partnerships.
Europe
Europe captured 22% share in 2025, driven by established process industries, power infrastructure, and engineering-intensive industrial clusters. Operators emphasize energy performance, reliability, and compliance requirements, which supports demand for high-efficiency designs and robust monitoring solutions. Replacement and modernization programs contribute materially to demand as plants optimize operating economics. Suppliers with strong engineering support and standardized platforms are typically well-positioned in large industrial accounts.
Asia Pacific
Asia Pacific led with 34% share in 2025, reflecting strong capacity expansion across manufacturing, refining, chemicals, and power infrastructure. Project density and growth in complex industrial ecosystems support significant demand for engineered compressor packages and commissioning services. Buyers often evaluate suppliers on delivery capability, local support infrastructure, and proven performance in high-throughput applications. The region also supports long-term service growth as newly installed assets expand the installed base.
Latin America
Latin America accounted for 7% share in 2025, with demand concentrated in select energy and industrial hubs and shaped by project cycles. Customers commonly focus on reliability and serviceability due to operating environments and logistics constraints, which strengthens the role of aftermarket support. Procurement can be influenced by financing terms, project timing, and the availability of local service partners. Revamps and lifecycle extensions provide steady opportunities alongside periodic greenfield projects.
Middle East & Africa
Middle East & Africa represented 10% share in 2025, supported by hydrocarbons processing, petrochemical investments, and associated infrastructure. Large projects often require engineered packages with strong performance guarantees, robust materials, and high uptime expectations. Regional demand also benefits from plant expansions and optimization programs that prioritize efficiency and throughput. Suppliers with strong project execution capability and regional service coverage tend to capture recurring maintenance and spares revenue.
Competitive Landscape
Competition in the axial compressor market is shaped by the ability to deliver high-efficiency designs for demanding duty cycles, support complex project execution, and provide strong lifecycle services across a long installed base. Leading suppliers differentiate through aerodynamic optimization, reliability engineering, digital monitoring, and integrated package delivery that reduces commissioning risk. Service networks, spares availability, and upgrade programs are important levers for sustaining share in mature fleets. Pricing pressure is most pronounced in large tenders, where performance guarantees and delivery schedules strongly influence award decisions.
Siemens Energy is positioned around engineered turbomachinery packages and lifecycle services that support large-scale process and infrastructure deployments. The company’s approach emphasizes integrated scope delivery, field service capability, and modernization programs that improve performance of installed assets. Project execution and support infrastructure help reduce customer risk during commissioning and ramp-up. This positioning aligns well with demand trends in complex compression applications requiring high uptime and predictable operating economics.
The industry research and growth report includes detailed analyses of the competitive landscape of the market and information about key companies, including:
- Siemens Energy
- GE Vernova
- Mitsubishi Heavy Industries / Mitsubishi Power
- MAN Energy Solutions
- Baker Hughes
- Elliott Group
- Howden
- Ingersoll Rand
- Atlas Copco
- Wärtsilä
- Safran
- Kawasaki Heavy Industries
Qualitative and quantitative analysis of companies has been conducted to help clients understand the wider business environment as well as the strengths and weaknesses of key industry players. Data is qualitatively analyzed to categorize companies as pure play, category-focused, industry-focused, and diversified; it is quantitatively analyzed to categorize companies as dominant, leading, strong, tentative, and weak.
Recent Developments
- In December 2024, GE Vernova introduced its F‑class enhanced compressor package for gas turbines, an upgrade solution that improves compressor section reliability, efficiency, and blade/vane robustness, directly enhancing performance of axial-flow compressor stages in F‑class gas turbine fleets.
Report Scope
| Report Attribute | Details |
| Market size value in 2025 | USD 8927.3 million |
| Revenue forecast in 2032 | USD 14523.92 million |
| Growth rate (CAGR) | 7.2% (2025–2032) |
| Base year | 2025 |
| Forecast period | 2026-2032 |
| Quantitative units | USD million |
| Segments covered | By Stage Outlook: Single-stage axial compressors, Multi-stage axial compressors; By Application / End Use Outlook: Gas turbines / power generation, Oil & gas, Chemicals & petrochemicals, Industrial manufacturing / process air, Aerospace & defense |
| Regional scope | North America, Europe, Asia Pacific, Latin America, Middle East & Africa |
| Key companies profiled | Siemens Energy; GE Vernova; Mitsubishi Heavy Industries / Mitsubishi Power; MAN Energy Solutions; Baker Hughes; Elliott Group; Howden; Ingersoll Rand; Atlas Copco; Wärtsilä; Safran; Kawasaki Heavy Industries |
| No. of Pages | 320 |
Segmentation
By Stage
- Single-stage axial compressors
- Multi-stage axial compressors
By Application / End Use
- Gas turbines / power generation
- Oil & gas
- Chemicals & petrochemicals
- Industrial manufacturing / process air
- Aerospace & defense
By Region
- North America
- U.S.
- Canada
- Mexico
- Europe
- Germany
- France
- U.K.
- Italy
- Spain
- Rest of Europe
- Asia Pacific
- China
- Japan
- India
- South Korea
- South-east Asia
- Rest of Asia Pacific
- Latin America
- Brazil
- Argentina
- Rest of Latin America
- Middle East & Africa
- GCC Countries
- South Africa
- Rest of the Middle East and Africa
Request a Free Sample
Fill in your details and we'll send you a free sample report.
- Sample data tables & charts
- Research methodology
Need a Custom Version of This Report?
Tailor the scope, geography, or segments to your exact requirements.
- Custom geography or segment scope
- Direct access to our analyst team
Frequently Asked Questions
What is the market size of the Axial Compressor Market in 2025?
What will be the market size by 2032?
What is the CAGR for 2025–2032?
What is the largest segment by stage in 2025?
Who are the key players in the Axial Compressor Market?
Which region leads the Axial Compressor Market in 2025?
Table of Content
Chapter 1. Report Introduction
- 1.1 Report Description & Purpose
- 1.1.1 Report Title & Market Definition
- 1.1.2 Unique Selling Propositions (USP) & Key Differentiators
- 1.1.3 Value Proposition for Stakeholders
- 1.2 Research Objectives
- 1.2.1 Market Sizing Objectives (Volume & Revenue)
- 1.2.2 Segmentation Objectives
- 1.2.3 Competitive Intelligence Objectives
- 1.2.4 Forecast & Scenario Objectives
- 1.3 Report Scope
- 1.3.1 Axial Compressor Scope – Types & Subtypes Covered
- 1.3.2 Geographic Scope – Regions & Countries Covered
- 1.3.3 Historical Period, Base Year & Forecast Period (2025; forecast to 2032)
- 1.3.4 Inclusions & Exclusions
- 1.4 HS Code & Classification Framework
- 1.5 Currency, Units & Pricing Basis
- 1.6 Target Stakeholders
- 1.7 Limitations & Assumptions
Chapter 2. Executive Summary
- 2.1 Global Axial Compressor Market Snapshot
- 2.1.1 Market Size – Historical (2025) & Forecast (2025-2032) (2025: USD 8927.3 million → 2032: USD 14523.92 million)
- 2.1.2 Volume & Revenue – Global Totals
- 2.1.3 Key Market Highlights – Top Five Facts
- 2.2 Axial Compressor Market Segmentation Snapshot
- 2.2.1 Market Split by Region – 2025 vs. 2032
- 2.3 Competitive Snapshot
- 2.3.1 Top 10 Players by Revenue Share – 2025
- 2.3.2 Top 10 Players by Volume Share – 2025
- 2.3.3 Recent Strategic Developments (18-Month Summary)
- 2.4 Key Investment Highlights & Strategic Conclusions
Chapter 3. Axial Compressor Market Dynamics & Industry Analysis
- 3.1 Market Overview & Context
- 3.1.1 Axial Compressor Market Position in the Broader Automotive Value Chain
- 3.1.2 OEM vs. Replacement Market Dynamics
- 3.1.3 Market Maturity & Development Stage by Region
- 3.2 Axial Compressor Market Drivers
- 3.3 Axial Compressor Market Restraints & Challenges
- 3.4 Axial Compressor Market Opportunities
- 3.5 Porter's Five Forces Analysis
- 3.5.1 Threat of New Entrants
- 3.5.2 Bargaining Power of Suppliers
- 3.5.3 Bargaining Power of Buyers
- 3.5.4 Threat of Substitutes
- 3.5.5 Competitive Rivalry – Intensity Assessment
- 3.6 Axial Compressor Value Chain Analysis
- 3.6.1 Upstream – Raw Material/Input Suppliers
- 3.6.1.1 Raw Material/Input 1
- 3.6.1.2 Raw Material/Input 2
- 3.6.1.3 Raw Material/Input 3
- 3.6.2 Midstream – Production/Manufacturing/Service Delivery
- 3.6.2.1 Production/Process Overview
- 3.6.2.2 Key Facility Locations & Capacity by Manufacturer
- 3.6.3 Downstream – Distribution & End Consumer
- 3.6.3.1 Primary Channel – B2B/OEM
- 3.6.3.2 Secondary Channels – Dealer, Retail, Online, Direct
- 3.6.4 Value Chain Profitability Analysis
- 3.6.1 Upstream – Raw Material/Input Suppliers
- 3.7 PESTEL Analysis
- 3.7.1 Political Factors
- 3.7.2 Economic Factors
- 3.7.3 Social Factors
- 3.7.4 Technological Factors
- 3.7.5 Environmental Factors
- 3.7.6 Legal Factors
- 3.8 Axial Compressor Supply Chain Analysis
- 3.8.1 Raw Material/Input Supply Risk Assessment
- 3.8.2 Manufacturing Concentration Risk (Geographic Exposure)
- 3.8.3 Trade Disruption Impact Analysis
- 3.9 Regulatory & Policy Landscape
Note: The regulatory and policy landscape section covers regulations based on their applicability to the market, Axial Compressor category, geography, and scope of the study. Only regulatory frameworks with a material impact on operations, compliance, trade, sustainability, or market access are analyzed in detail.
Chapter 4. Key Investment Pockets & Opportunity Analysis
- 4.1 Axial Compressor Market Attractiveness Analysis
- 4.1.1 By Region – Investment Attractiveness Matrix (Volume × CAGR)
- 4.2 Absolute Revenue Growth Opportunity
- 4.2.1 By Region – Absolute USD Growth Through 2032
- 4.3 Incremental Volume Opportunity
- 4.3.1 By Region – Incremental Volume Through 2032
- 4.3.2 Segment – Incremental Volume
- 4.4 Emerging Submarket Opportunity Deep Dive (Subject to Applicability)
- 4.5 Emerging Market Opportunity Scorecards
- 4.5.1 United States
- 4.5.2 Europe
- 4.5.3 Asia
- 4.5.4 Middle East & Africa
Note: Emerging Market Opportunity Scorecards will be included based on relevance and strategic importance. Regions listed are indicative and may vary depending on data availability and market dynamics.
Chapter 5. Axial Compressor Import-Export Analysis & Trade Flows
- 5.1 Global Trade Overview
- 5.1.1 Global Export Value by Country (2025)
- 5.1.2 Global Export Volume by Country (2025)
- 5.1.3 Global Import Value by Country (2025)
- 5.1.4 Global Import Volume by Country (2025)
- 5.1.5 Net Trade Balance by Country (2025)
- 5.2 Export Analysis – Segment
- 5.2.1 Type 1 (HS Code)
- 5.2.2 Type 2 (HS Code)
- 5.2.3 Type 3 (HS Code)
- 5.2.4 Type 4 (HS Code)
- 5.2.5 Type 5 (HS Code)
- 5.3 Import Analysis – Segment
- 5.3.1 Type 1 (HS Code)
- 5.3.2 Type 2 (HS Code)
- 5.3.3 Type 3 (HS Code)
- 5.3.4 Type 4 (HS Code)
- 5.3.5 Type 5 (HS Code)
- 5.4 Average Unit Trade Prices
- 5.4.1 Average Export Price – Segment & Country
- 5.4.2 Average Import Price – Segment & Source Country
- 5.4.3 Price Trends (2025)
- 5.5 Key Trade Route Analysis
- 5.5.1 Trade Route 1
- 5.5.2 Trade Route 2
- 5.5.3 Trade Route 3
- 5.5.4 Trade Route 4
- 5.5.5 Trade Route 5
- 5.6 Trade Policy Impact Assessment
- 5.6.1 US Anti-Dumping & Section 301 Tariffs
- 5.6.2 EU Customs Union Impact
- 5.6.3 Major Free Trade Agreements
- 5.6.4 USMCA Rules of Origin
Note: Trade policy analysis will be included only where relevant to the Axial Compressor market.
Chapter 6. Competitive Landscape & Company Benchmarking
- 6.1 Axial Compressor Market Concentration & Structure
- 6.1.1 Herfindahl-Hirschman Index (HHI) – vs. 2025
- 6.1.2 Tier 1, Tier 2 & Tier 3 Market Structure
- 6.1.3 Global, Regional & Local Player Dynamics
- 6.2 Axial Compressor Market Share Analysis – 2025
- 6.2.1 Global Revenue Share by Company
- 6.2.2 Global Volume Share by Company
- 6.2.3 Regional Revenue Share
- 6.2.4 Market Share Evolution ( vs. 2025)
- 6.2.5 OEM Segment Share by Company
- 6.2.6 Replacement Segment Share by Company
- 6.3 Production/Delivery Capacity & Facility Analysis
- 6.3.1 Global Installed Capacity
- 6.3.2 Capacity Utilization Rates
- 6.3.3 Production/Output Volume
- 6.3.4 Facility Locations & Capacity Map
- 6.3.5 Planned Capacity Additions
- 6.4 Axial Compressor Competitive Benchmarking Matrix
- 6.4.1 Revenue, Volume, CAGR & Profitability Comparison
- 6.4.2 Channel Revenue Mix
- 6.4.3 Geographic Revenue Exposure
- 6.4.4 R&D Intensity
- 6.4.5 Sustainability Maturity
- 6.5 Strategic Developments in Axial Compressor (Last 24 Months)
- 6.5.1 Mergers, Acquisitions & Divestments
- 6.5.2 New Axial Compressor Launches
- 6.5.3 Facility Expansions
- 6.5.4 Strategic Alliances, Joint Ventures & Partnerships
- 6.5.5 Distribution Expansion & Market Entry
- 6.5.6 Sustainability & ESG Initiatives
- 6.6 Competitive Strategy Mapping
- 6.6.1 Leader, Challenger, Follower & Niche Classification
- 6.6.2 Pricing Strategy Comparison
- 6.6.3 Channel Strategy Matrix
Note: Strategic developments are included based on their materiality and the availability of reliable information.
Chapter 7. Global Axial Compressor Market – By Distribution Channel
- 7.1 Segment Overview
- 7.1.1 Volume & Revenue Split by Channel (2025 & 2032)
- 7.1.2 Channel Mix Evolution (2025-2032)
Chapter 8. Regional Market Analysis – Global Overview
- 8.1 Global Regional Overview
- 8.1.1 Regional Volume Share
- 8.1.2 Regional Revenue Share
- 8.1.3 Regional Volume by Region
- 8.1.4 Regional Revenue by Region
- 8.1.5 Regional Forecast Through 2032
- 8.2 Cross-Regional Segment Analysis
- 8.2.1 By Distribution Channel
- 8.2.2 By Brand/Price Tier
Chapter 9. North America Axial Compressor Market
- 9.1 United States
- 9.2 Canada
- 9.3 Mexico
Chapter 10. Europe Axial Compressor Market
- 10.1 Germany
- 10.2 France
- 10.3 Italy
- 10.4 United Kingdom
- 10.5 Spain
- 10.6 Poland
- 10.7 Russia
- 10.8 Netherlands
- 10.9 Belgium
- 10.10 Sweden
- 10.11 Denmark
- 10.12 Norway
- 10.13 Rest of Europe
Chapter 11. Asia Pacific Axial Compressor Market
- 11.1 China
- 11.2 India
- 11.3 Japan
- 11.4 South Korea
- 11.5 Thailand
- 11.6 Indonesia
- 11.7 Vietnam
- 11.8 Malaysia
- 11.9 Australia
- 11.10 Rest of Asia Pacific
Chapter 12. Latin America Axial Compressor Market
- 12.1 Brazil
- 12.2 Argentina
- 12.3 Colombia
- 12.4 Chile
- 12.5 Rest of Latin America
Chapter 13. Middle East Axial Compressor Market
- 13.1 Saudi Arabia
- 13.2 United Arab Emirates
- 13.3 Turkey
- 13.4 Israel
- 13.5 Iran
- 13.6 Rest of the Middle East
Chapter 14. Africa Axial Compressor Market
- 14.1 South Africa
- 14.2 Egypt
- 14.3 Nigeria
- 14.4 Morocco
- 14.5 Rest of Africa
Chapter 15. Axial Compressor Company Profiles
- 15.1 [Company 01]
- 15.1.1 Company Overview
- 15.1.2 Key Management Personnel
- 15.1.3 Products & Services Portfolio
- 15.1.4 Financial Performance
- 15.1.5 Key Market Focus & Geographic Presence
- 15.1.6 Recent Developments & Strategic Initiatives
Note: The company profile list is preliminary and may change based on research findings, market developments, data availability, and client requirements.
Chapter 16. Appendices
- Appendix A – List of Abbreviations & Acronyms
- Appendix B – Industry Classification Code Reference – Full Series
- Appendix C – Production & Capacity Data Tables
- Appendix D – End-Use & Demand Base Tables
- Appendix E – Consumption & Replacement Rate Assumptions
- Appendix F – ASP Reference Tables
- Appendix G – Manufacturing & Facility Database
- Appendix H – Import-Export Data Tables
- Appendix I – Regulatory Summary Tables
- Appendix J – Primary Research Participant List (Anonymized)
- Appendix K – Primary Research Questionnaire Framework
- Appendix L – Data Sources & Bibliography
- Appendix M – Market Size Divergence & Source Comparison
Chapter 17. Research Methodology
- 17.1 Research Framework & Philosophy
- 17.2 Secondary Research – Sources, Hierarchy & Data Extraction
- 17.3 Data Modeling – Bottom-Up & Top-Down Market Sizing
- 17.4 Primary Research – Stakeholder Framework, LOI & Sample Sizes
- 17.5 Forecast Methodology – Regression, Scenario & Sensitivity Analysis
- 17.6 Quality Control – Four-Layer Validation Framework
- 17.7 Limitations & Standard Assumptions
- 17.8 Disclaimer
