Buccal Cavity Devices Market Overview:
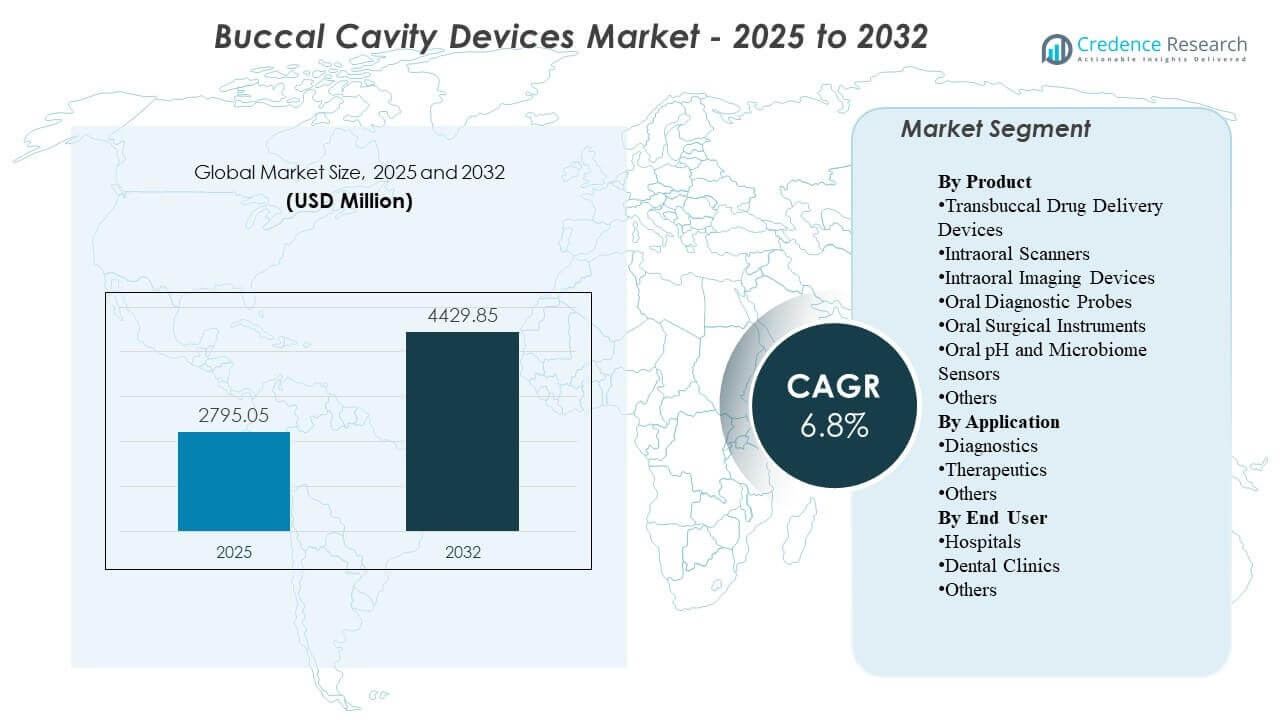
The global Buccal Cavity Devices Market size was estimated at USD 2,795.05 million in 2025 and is expected to reach USD 4,429.85 million by 2032, growing at a CAGR of 6.8% from 2025 to 2032. Growth is primarily supported by faster adoption of digital dentistry workflows that increase routine use of intraoral imaging and scanning for diagnosis, treatment planning, and follow-up monitoring across dental settings. North America remains the largest revenue contributor, supported by higher device penetration and replacement demand across established clinic networks.
| REPORT ATTRIBUTE |
DETAILS |
| Historical Period |
2020-2024 |
| Base Year |
2025 |
| Forecast Period |
2026-2032 |
| Buccal Cavity Devices Market Size 2025 |
USD 2,795.05 million |
| Buccal Cavity Devices Market, CAGR |
6.8% |
| Buccal Cavity Devices Market Size 2032 |
USD 4,429.85 million |
Key Market Trends & Insights
- The Buccal Cavity Devices Market is projected to expand from USD 2,795.05 million in 2025 to USD 4,429.85 million by 2032, reflecting a 6.8% CAGR during 2025–2032.
- North America accounted for 37.85% of revenue in 2025, reflecting stronger penetration of chairside digital imaging and scanner-based workflows in high-throughput practices.
- Asia Pacific represented 28.95% of 2025 revenue and is supported by rising clinic capacity additions and increasing uptake of imaging-led diagnostics across metropolitan dental networks.
- Intraoral Imaging Devices led the product mix with a 31.6% share in 2025, reflecting high utilization frequency across routine assessments and procedure planning.
- Dental Clinics represented 62.4% of 2025 demand, consistent with clinic-led care pathways and high repeat usage of diagnostic devices across appointments.
Segment Analysis
Product demand in the Buccal Cavity Devices Market is shaped by a shift toward digital, chairside workflow that compress diagnostic-to-treatment timelines and improve documentation consistency. Practices increasingly prioritize devices that reduce manual steps and enable better visualization for patient communication, which supports higher utilization frequency for imaging and scanning tools. Buyer decisions are influenced by integration with practice management software, ease of training, and the ability to standardize workflows across multi-site clinic groups.
Adoption is also supported by throughput economics, as clinics aim to increase daily appointment capacity and improve case acceptance through clearer diagnostic visualization and digital records. Market usage patterns reflect a wide range of clinic scales, with a meaningful portion of providers operating at lower quarterly patient volumes and a majority managing higher-throughput patient loads, reinforcing demand for efficient workflows and reliable device uptime. As care becomes more protocol-driven, recurring use in diagnosis, monitoring, and documentation continues to reinforce replacement and upgrade cycles.
Access crucial information at unmatched prices!
Request your sample report today & start making informed decisions powered by Credence Research Inc.!
Download Sample
By Product Insights
Intraoral Imaging Devices accounted for the largest share of 31.6% in 2025. Intraoral imaging remains a daily-use capability because most dental care pathways begin with visualization, screening, and documentation of oral conditions. High clinical reliance on imaging for restorative planning and follow-up monitoring increases utilization intensity per patient episode. Compatibility with digital records and software ecosystems further supports recurring upgrades and broader installation across clinic networks.
By Application Insights
Diagnostics accounted for the largest share of 50.8% in 2025. Diagnostic workflows benefit from repeat assessment across visits, which drives consistent device utilization beyond single-procedure episodes. The shift toward evidence-based treatment planning increases reliance on imaging, probes, and digital capture to document baseline condition and therapy response. Practice-level efficiency goals also favor faster diagnostic capture and easier sharing within referral and payer environments where applicable.
By End User Insights
Dental Clinics accounted for the largest share of 62.4% in 2025. Dental clinics represent the primary point-of-care for routine screening, restorative planning, orthodontic workflows, and follow-up monitoring where these devices are used repeatedly. Clinics often justify investments through productivity gains, improved patient communication, and enhanced case acceptance driven by clearer visualization. Multi-chair practices and clinic chains also standardize device platforms to simplify training and ensure consistent outputs across sites.
Market Drivers
Expansion of digital dentistry workflows across clinics
Digital impressions, imaging-led planning, and electronically stored patient records are becoming standard operating practices in many dental clinics. These workflows increase demand for scanners, intraoral imaging devices, and diagnostic tools that can integrate reliably with software systems. Clinics prioritize devices that reduce retakes and shorten chairside time, which strengthens ROI justification. As standardization expands across multi-site clinic groups, platform selection decisions increasingly influence replacement and upgrade demand.
- For instance, 3Shape states that its TRIOS 5 scanner captures 2,400 images per second, supports up to 66 minutes of continuous scanning, outputs PLY, DCM, and STL files, and operates with a wireless range of up to 15 meters, which aligns well with software-connected, multi-operatory digital workflows.
Higher procedure volumes and preventive screening emphasis
Rising focus on preventive dental care increases the frequency of diagnostic assessment and monitoring, directly expanding usage intensity for imaging and probing tools. Repeat diagnostic checks are common across caries, periodontal conditions, and restorative follow-ups, supporting consistent device utilization. Increased awareness and routine check-up behavior improves the flow of patients through diagnostic pathways. This sustained throughput supports equipment refresh cycles, especially where devices are mission-critical for workflow efficiency.
Technology improvements that raise utilization frequency
Improvements in image quality, capture speed, ergonomics, and workflow automation encourage higher daily usage in clinics and reduce barriers for staff adoption. Better integration with practice software reduces manual steps and improves the reliability of documentation, which supports broader utilization across appointment types. Enhanced chairside visualization improves patient communication and can increase acceptance of recommended treatments. These advantages reinforce the value of upgrading devices even when legacy tools remain functional.
- For instance, Dentsply Sirona reports that Primescan can capture an entire upper jaw in well under 30 seconds, complete a full-jaw scan in less than one minute, and process more than 1 million 3D data points per second, demonstrating how faster capture and high-volume data processing can increase daily scanner use.
Growth of specialized orthodontic and restorative pathways
Orthodontic aligner workflows and restorative planning increasingly depend on accurate digital capture, reinforcing demand for scanners and imaging devices. Clinics offering advanced services tend to adopt integrated device ecosystems to reduce handoffs and speed treatment planning. More frequent monitoring requirements across these pathways also increase repeat usage and demand for consistent outputs. As competitive differentiation increases at the clinic level, technology investments become part of service positioning and patient experience strategy.
Market Challenges
Cost sensitivity remains a constraint, particularly for small clinics where capital budgets compete with other chairside equipment needs and facility investments. Purchasing decisions often require clear throughput and case-acceptance benefits, which can lengthen evaluation cycles and delay upgrades. Budget variability can also increase reliance on refurbished or older devices, slowing adoption of newer platforms. In price-sensitive settings, service contracts and consumable costs can influence total cost of ownership and narrow vendor shortlists.
Operational complexity also limits broader adoption because effective use depends on staff training, workflow redesign, and consistent device maintenance. Interoperability challenges across imaging, software, and practice management systems can increase integration effort, especially for multi-vendor environments. Variability in device outputs and calibration requirements can affect standardization across multi-site groups. Downtime risk and service response expectations can further shape purchasing decisions for clinics that cannot tolerate workflow disruption.
- For instance, Carestream Dental says its CS 3D Imaging Premium can automatically merge CBCT and intraoral scans, map panoramic curves and mandibular nerve canals in seconds, support AI implant planning for up to three teeth per mandibular case, and enable secure sharing of up to 30 cases per month, reflecting a company-led effort to reduce workflow friction in digitally connected practices.
Market Trends and Opportunities
Workflow simplification and ecosystem integration are becoming stronger selection criteria as clinics seek consistent outputs and faster onboarding of new staff. Practices increasingly value devices that support straightforward data transfer, cloud-based collaboration, and streamlined storage, which improves daily operability. Vendors that bundle hardware, software, and service support can strengthen customer retention through platform stickiness. Standardization across clinic chains creates opportunities for multi-year agreements and broader portfolio adoption.
- For instance, 3Shape positions Unite as a workflow engine that lets clinics manage cases in the cloud from any location or device, connects users to thousands of apps, supports 100+ partners across areas such as imaging systems and patient management, links practices with over 8,000 registered dental labs, and provides up to 10 TB of cloud data availability for TRIOS Care users.
AI-enabled diagnostics and image interpretation support tools are expanding the value proposition for imaging-centric systems. Automated measurements, structured reporting, and decision-support features can improve consistency and reduce interpretation variability across providers. These capabilities also create opportunities for software upgrades and recurring revenue models tied to installed bases. As clinics emphasize patient communication and documentation, tools that produce clearer outputs and faster explanations can support improved treatment acceptance.
Regional Insights
North America
North America accounted for 37.85% of 2025 revenue, supported by high penetration of digital dentistry tools across established clinic networks. Purchasing decisions are often driven by workflow efficiency, integration capability, and predictable service coverage across multi-chair practices. Replacement cycles remain active as clinics prioritize improved performance and better interoperability with practice software. Demand is further supported by broad availability of trained staff and clinical protocols that emphasize consistent diagnostic documentation.
Europe
Europe held a 21.55% share in 2025, reflecting a mature dental care infrastructure and steady adoption of imaging and scanning across clinic settings. Market demand benefits from an established base of dental clinics and an ongoing shift toward digital recordkeeping and image-based planning. Adoption is often influenced by procurement discipline and long replacement cycles, which can moderate near-term upgrades. Vendors that provide strong service networks and compliant data handling capabilities tend to strengthen competitive positioning.
Asia Pacific
Asia Pacific represented 28.95% of 2025 revenue, supported by expanding clinic capacity and accelerating uptake of chairside diagnostics in major urban markets. Rising middle-income demand for restorative and orthodontic services increases the addressable base for scanners and imaging systems. The region also benefits from rapid digital adoption trends and newer clinic builds that can implement digital workflows from the start. Pricing tiers and service access remain important in purchase decisions, supporting a mix of premium and value offerings.
Latin America
Latin America accounted for 7.35% of 2025 revenue, driven primarily by private dentistry demand concentrated in key markets and metropolitan clinic clusters. Adoption of imaging and scanning is progressing where clinics can justify capex through throughput and case complexity. Budget variability and uneven access to premium equipment can slow replacement cycles outside major cities. Growth is supported by expanding private clinic networks and greater focus on patient experience and documentation quality.
Middle East & Africa
Middle East and Africa captured 4.30% of 2025 revenue, with demand concentrated in higher-spend pockets and private providers. Procurement often emphasizes durability, service coverage, and predictable consumable supply, particularly for workflow-critical diagnostic tools. Adoption is supported by investments in private healthcare and specialized dental centers, but broader rollout can be constrained by affordability and workforce distribution. Opportunities are strongest in markets where clinic infrastructure is expanding and digital workflows are being standardized.
Competitive Landscape
Competition in the Buccal Cavity Devices Market is shaped by platform ecosystems that combine hardware performance, software integration, and service reliability to reduce workflow friction in clinics. Vendors differentiate through image quality, capture speed, ergonomics, interoperability with practice systems, and the breadth of their digital dentistry portfolios. Commercial strategy often centers on strengthening installed bases through upgrades, software enhancements, and bundled service offerings that improve total cost of ownership. Channel strength and training support are also critical differentiators, particularly for multi-site clinic groups that prioritize rapid onboarding.
Dentsply Sirona emphasizes integrated digital dentistry workflows by aligning intraoral scanning and imaging capabilities with chairside efficiency and connected software ecosystems. The company’s approach typically prioritizes productivity, standardized outputs, and upgrade pathways that support long-term customer retention. Portfolio breadth enables positioning across clinic sizes, from single-site practices to multi-site networks. Ongoing enhancements and ecosystem integration help reinforce competitive strength where clinics demand consistent performance and simplified data workflows.
The industry research and growth report includes detailed analyses of the competitive landscape of the market and information about key companies, including:
- Dentsply Sirona
- ACTEON Group Ltd.
- Align Technology, Inc.
- Carestream Dental LLC
- FONA Dental s.r.o.
- Planmeca Oy
- Envista Holdings Corporation
- J Morita Corporation
- Midmark Corporation
- Canon Inc.
- Varex Imaging Corporation
- Yoshida Dental Mfg. Co., Ltd.
Qualitative and quantitative analysis of companies has been conducted to help clients understand the wider business environment as well as the strengths and weaknesses of key industry players. Data is qualitatively analyzed to categorize companies as pure play, category-focused, industry-focused, and diversified; it is quantitatively analyzed to categorize companies as dominant, leading, strong, tentative, and weak.
Shape Your Report to Specific Countries or Regions & Enjoy 30% Off!
Recent Developments
- In March 2025, Planmeca announced Planmeca ProX GO, its first handheld intraoral X-ray device, developed for chairside imaging in traditional clinics, mobile dental clinics, nursing homes, and emergency situations, with the product debuting at IDS 2025 and an initial sales launch planned for the U.S. market.
- In March 2025, Alliedstar unveiled its new flagship Sensa intraoral scanner at IDS 2025, expanding the company’s oral scanning portfolio beyond its AS200E and AS260 models.
- In March 2025, OSSVIS introduced what it described as the world’s first intra-oral scanner equipped with optical coherence tomography (OCT), designed to generate high-resolution images of deep oral tissues and support earlier detection of dental caries and periodontal disease.
Report Scope
| Report Attribute |
Details |
| Market size value in 2025 |
USD 2,795.05 million |
| Revenue forecast in 2032 |
USD 4,429.85 million |
| Growth rate (CAGR) |
6.8% (2025–2032) |
| Base year |
2025 |
| Forecast period |
2026–2032 |
| Quantitative units |
USD million |
| Segments covered |
By Product Outlook: Transbuccal Drug Delivery Devices, Intraoral Scanners, Intraoral Imaging Devices, Oral Diagnostic Probes, Oral Surgical Instruments, Oral pH and Microbiome Sensors, Others; By Application Outlook: Diagnostics, Therapeutics, Others; By End User Outlook: Hospitals, Dental Clinics, Others |
| Regional scope |
North America, Europe, Asia Pacific, Latin America, Middle East & Africa |
| Key companies profiled |
Dentsply Sirona; ACTEON Group Ltd.; Align Technology, Inc.; Carestream Dental LLC; FONA Dental s.r.o.; Planmeca Oy; Envista Holdings Corporation; J Morita Corporation; Midmark Corporation; Canon Inc.; Varex Imaging Corporation; Yoshida Dental Mfg. Co., Ltd. |
| No. of Pages |
326 |
Segmentation
By Product
- Transbuccal Drug Delivery Devices
- Intraoral Scanners
- Intraoral Imaging Devices
- Oral Diagnostic Probes
- Oral Surgical Instruments
- Oral pH and Microbiome Sensors
- Others
By Application
- Diagnostics
- Therapeutics
- Others
By End User
- Hospitals
- Dental Clinics
- Others
By Region
- North America
- Europe
- Germany
- France
- U.K.
- Italy
- Spain
- Rest of Europe
- Asia Pacific
- China
- Japan
- India
- South Korea
- South-east Asia
- Rest of Asia Pacific
- Latin America
- Brazil
- Argentina
- Rest of Latin America
- Middle East & Africa
- GCC Countries
- South Africa
- Rest of the Middle East and Africa


