1. Preface
1.1. Report Description
1.1.1. Purpose of the Report
1.1.2. Target Audience
1.1.3. USP and Key Offerings
1.2. Research Scope
1.3. Research Methodology
1.3.1. Phase I – Secondary Research
1.3.2. Phase II – Data Modelling
1.3.2.1. Company Share Analysis Model
1.3.2.2. Revenue Based Modelling
1.3.3. Phase III – Primary Research
1.3.4. Research Limitations
1.3.5. Assumptions
1.4. Market Introduction
1.5. Market Research Scope
2. Executive Summary
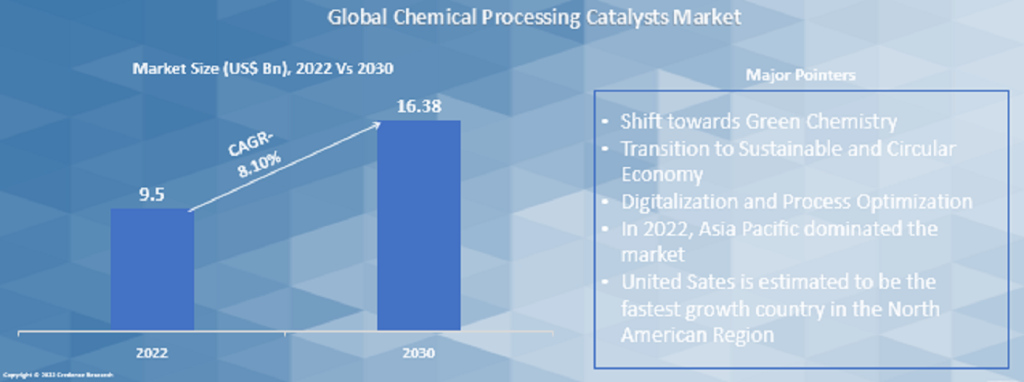
2.1. Market Snapshot: Global Chemical Processing Catalysts Market
2.2. Global Chemical Processing Catalysts Market, By Type
2.3. Global Chemical Processing Catalysts Market, By Application
2.4. Global Chemical Processing Catalysts Market, By Region
3. Market Dynamics & Factors Analysis
3.1. Introduction
3.1.1. Global Chemical Processing Catalysts Market Value, 2017-2030, (US$ Bn)
3.1.2. Y-o-Y Growth Trend Analysis
3.2. Market Dynamics
3.2.1. Market Drivers
3.2.2. Market Restraints
3.2.3. Market Opportunities
3.2.4. Major Industry Challenges
3.3. Growth and Development Patterns
3.4. Investment Feasibility Analysis
3.5. Market Opportunity Analysis
3.5.1. Type
3.5.2. Application
3.5.3. Geography
4. Premium Insights
4.1. STAR (Situation, Task, Action, Results) Analysis
4.2. Porter’s Five Forces Analysis
4.2.1. Threat of New Entrants
4.2.2. Bargaining Power of Buyers/Consumers
4.2.3. Bargaining Power of Suppliers
4.2.4. Threat of Substitute Types
4.2.5. Intensity of Competitive Rivalry
4.3. Key Market Trends
4.3.1. Demand Side Trends
4.3.2. Supply Side Trends
4.4. Value Chain Analysis
4.5. Technology Analysis
4.6. Analysis and Recommendations
4.7. Marketing Strategy Analysis
4.7.1. Direct Marketing
4.7.2. Indirect Marketing
4.7.3. Marketing Channel Development Trend
5. Market Positioning of Key Players, 2022
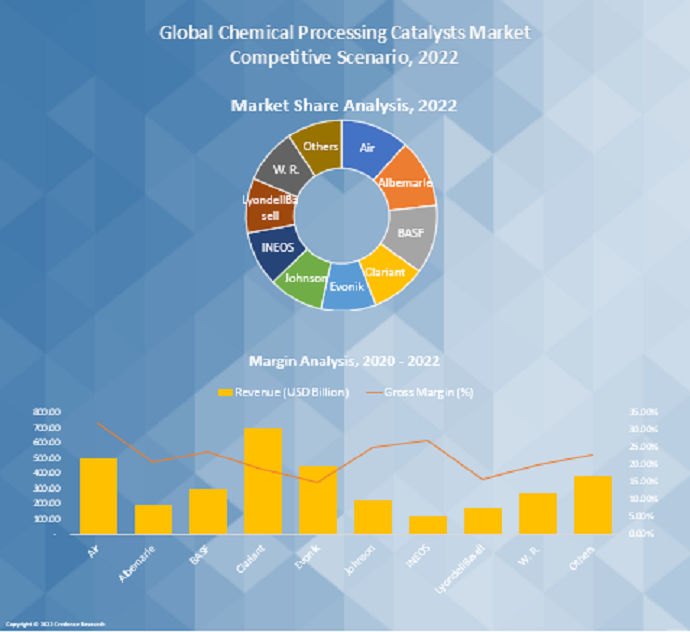
5.1. Company market share of key players, 2022
5.2. Competitive Benchmarking
5.3. Market Positioning of Key Vendors
5.4. Geographical Presence Analysis
5.5. Major Strategies Adopted by Key Players
5.5.1. Key Strategies Analysis
5.5.2. Mergers and Acquisitions
5.5.3. Partnerships
5.5.4. Product Launch
5.5.5. Geographical Expansion
5.5.6. Others
6. Economic Impact Analysis
6.1. Recession Impact
6.1.1. North America
6.1.2. Europe
6.1.3. Asia Pacific
6.1.4. Latin America
6.1.5. Middle East and Africa
6.2. Ukraine-Russia War Impact
6.2.1. North America
6.2.2. Europe
6.2.3. Asia Pacific
6.2.4. Latin America
6.2.5. Middle East and Africa
6.3. COVID-19 Impact Analysis
6.3.1. North America
6.3.2. Europe
6.3.3. Asia Pacific
6.3.4. Latin America
6.3.5. Middle East and Africa
7. Global Chemical Processing Catalysts Market, By Type
7.1. Global Chemical Processing Catalysts Market Overview, by Type
7.1.1. Global Chemical Processing Catalysts Market Revenue Share, By Type, 2022 Vs 2030 (in %)
7.2. Polymerization Catalysts
7.2.1. Global Chemical Processing Catalysts Market, By Region, 2017-2030 (US$ Bn)
7.3. Oxidation Catalysts
7.3.1. Global Chemical Processing Catalysts Market, By Region, 2017-2030 (US$ Bn)
7.4. Organic Synthesis Catalysts
7.4.1. Global Chemical Processing Catalysts Market, By Region, 2017-2030 (US$ Bn)
7.5. Synthesis Gas Catalysts
7.5.1. Global Chemical Processing Catalysts Market, By Region, 2017-2030 (US$ Bn)
7.6. Hydrogenation Catalysts
7.6.1. Global Chemical Processing Catalysts Market, By Region, 2017-2030 (US$ Bn)
7.7. Dehydrogenation Catalysts
7.7.1. Global Chemical Processing Catalysts Market, By Region, 2017-2030 (US$ Bn)
8. Global Chemical Processing Catalysts Market, By Application
8.1. Global Chemical Processing Catalysts Market Overview, by Application
8.1.1. Global Chemical Processing Catalysts Market, By Application, 2022 vs 2030 (in %)
8.2. Production of Isobutylene
8.2.1. Global Chemical Processing Catalysts Market, By Region, 2017-2030 (US$ Bn)
8.3. Chemicals
8.3.1. Global Chemical Processing Catalysts Market, By Region, 2017-2030 (US$ Bn)
8.4. Others
8.4.1. Global Chemical Processing Catalysts Market, By Region, 2017-2030 (US$ Bn)
9. Global Chemical Processing Catalysts Market, By Region
9.1. Global Chemical Processing Catalysts Market Overview, by Region
9.1.1. Global Chemical Processing Catalysts Market, By Region, 2022 vs 2030 (in%)
9.2. Type
9.2.1. Global Chemical Processing Catalysts Market, By Type, 2017-2030 (US$ Bn)
9.3. Application
9.3.1. Global Chemical Processing Catalysts Market, By Application, 2017-2030 (US$ Bn)
10. North America Chemical Processing Catalysts Market Analysis
10.1. North America Chemical Processing Catalysts Market, by Type, 2017-2030(US$ Bn)
10.1.1. Overview
10.1.2. SRC Analysis
10.2. North America Chemical Processing Catalysts Market, by Application, 2017-2030(US$ Bn)
10.2.1. Overview
10.2.2. SRC Analysis
10.3. North America Chemical Processing Catalysts Market, by Country, 2017-2030 (US$ Bn)
10.3.1. North America Chemical Processing Catalysts Market, by Country, 2022 Vs 2030 (in%)
10.3.2. U.S.
10.3.2.1. U.S. Chemical Processing Catalysts Market Estimates and Forecast, 2017-2030 (US$ Bn)
10.3.2.2. U.S. Chemical Processing Catalysts, By Type, 2017-2030 (US$ Bn)
10.3.2.3. U.S. Chemical Processing Catalysts, By Application, 2017-2030 (US$ Bn)
10.3.3. Canada
10.3.3.1. Canada Chemical Processing Catalysts Market Estimates and Forecast, 2017-2030 (US$ Bn)
10.3.3.2. Canada Chemical Processing Catalysts, By Type, 2017-2030 (US$ Bn)
10.3.3.3. Canada Chemical Processing Catalysts, By Application, 2017-2030 (US$ Bn)
10.3.4. Mexico
10.3.4.1. Mexico Chemical Processing Catalysts Market Estimates and Forecast, 2017-2030 (US$ Bn)
10.3.4.2. Mexico Chemical Processing Catalysts, By Type, 2017-2030 (US$ Bn)
10.3.4.3. Mexico Chemical Processing Catalysts, By Application, 2017-2030 (US$ Bn)
11. Europe Chemical Processing Catalysts Market Analysis
11.1. Europe Chemical Processing Catalysts Market, by Type, 2017-2030(US$ Bn)
11.1.1. Overview
11.1.2. SRC Analysis
11.2. Europe Chemical Processing Catalysts Market, by Application, 2017-2030(US$ Bn)
11.2.1. Overview
11.2.2. SRC Analysis
11.3. Europe Chemical Processing Catalysts Market, by Country, 2017-2030 (US$ Bn)
11.3.1. Europe Chemical Processing Catalysts Market, by Country, 2022 Vs 2030 (in%)
11.3.2. Germany
11.3.2.1. Germany Chemical Processing Catalysts Market Estimates and Forecast, 2017-2030 (US$ Bn)
11.3.2.2. Germany Chemical Processing Catalysts, By Type, 2017-2030 (US$ Bn)
11.3.2.3. Germany Chemical Processing Catalysts, By Application, 2017-2030 (US$ Bn)
11.3.3. France
11.3.3.1. France Chemical Processing Catalysts Market Estimates and Forecast, 2017-2030 (US$ Bn)
11.3.3.2. France Chemical Processing Catalysts, By Type, 2017-2030 (US$ Bn)
11.3.3.3. France Chemical Processing Catalysts, By Application, 2017-2030 (US$ Bn)
11.3.4. UK
11.3.4.1. UK Chemical Processing Catalysts Market Estimates and Forecast, 2017-2030 (US$ Bn)
11.3.4.2. UK Chemical Processing Catalysts, By Type, 2017-2030 (US$ Bn)
11.3.4.3. UK Chemical Processing Catalysts, By Application, 2017-2030 (US$ Bn)
11.3.5. Italy
11.3.5.1. Italy Chemical Processing Catalysts Market Estimates and Forecast, 2017-2030 (US$ Bn)
11.3.5.2. Italy Chemical Processing Catalysts, By Type, 2017-2030 (US$ Bn)
11.3.5.3. Italy Chemical Processing Catalysts, By Application, 2017-2030 (US$ Bn)
11.3.6. Spain
11.3.6.1. Spain Chemical Processing Catalysts Market Estimates and Forecast, 2017-2030 (US$ Bn)
11.3.6.2. Spain Chemical Processing Catalysts, By Type, 2017-2030 (US$ Bn)
11.3.6.3. Spain Chemical Processing Catalysts, By Application, 2017-2030 (US$ Bn)
11.3.7. Rest of Europe
11.3.7.1. Rest of Europe Chemical Processing Catalysts Market Estimates and Forecast, 2017-2030 (US$ Bn)
11.3.7.2. Rest of Europe Chemical Processing Catalysts, By Type, 2017-2030 (US$ Bn)
11.3.7.3. Rest of Europe Chemical Processing Catalysts, By Application, 2017-2030 (US$ Bn)
12. Asia Pacific Chemical Processing Catalysts Market Analysis
12.1. Asia Pacific Chemical Processing Catalysts Market, by Type, 2017-2030(US$ Bn)
12.1.1. Overview
12.1.2. SRC Analysis
12.2. Asia Pacific Chemical Processing Catalysts Market, by Application, 2017-2030(US$ Bn)
12.2.1. Overview
12.2.2. SRC Analysis
12.3. Asia Pacific Chemical Processing Catalysts Market, by Country, 2017-2030 (US$ Bn)
12.3.1. Asia Pacific Chemical Processing Catalysts Market, by Country, 2022 Vs 2030 (in%)
12.3.2. China
12.3.2.1. China Chemical Processing Catalysts Market Estimates and Forecast, 2017-2030 (US$ Bn)
12.3.2.2. China Chemical Processing Catalysts, By Type, 2017-2030 (US$ Bn)
12.3.2.3. China Chemical Processing Catalysts, By Application, 2017-2030 (US$ Bn)
12.3.3. Japan
12.3.3.1. Japan Chemical Processing Catalysts Market Estimates and Forecast, 2017-2030 (US$ Bn)
12.3.3.2. Japan Chemical Processing Catalysts, By Type, 2017-2030 (US$ Bn)
12.3.3.3. Japan Chemical Processing Catalysts, By Application, 2017-2030 (US$ Bn)
12.3.4. India
12.3.4.1. India Chemical Processing Catalysts Market Estimates and Forecast, 2017-2030 (US$ Bn)
12.3.4.2. India Chemical Processing Catalysts, By Type, 2017-2030 (US$ Bn)
12.3.4.3. India Chemical Processing Catalysts, By Application, 2017-2030 (US$ Bn)
12.3.5. South Korea
12.3.5.1. South Korea Chemical Processing Catalysts Market Estimates and Forecast, 2017-2030 (US$ Bn)
12.3.5.2. South Korea Chemical Processing Catalysts, By Type, 2017-2030 (US$ Bn)
12.3.5.3. South Korea Chemical Processing Catalysts, By Application, 2017-2030 (US$ Bn)
12.3.6. South-East Asia
12.3.6.1. South-East Asia Chemical Processing Catalysts Market Estimates and Forecast, 2017-2030 (US$ Bn)
12.3.6.2. South-East Asia Chemical Processing Catalysts, By Type, 2017-2030 (US$ Bn)
12.3.6.3. South-East Asia Chemical Processing Catalysts, By Application, 2017-2030 (US$ Bn)
12.3.7. Rest of Asia Pacific
12.3.7.1. Rest of Asia Pacific Chemical Processing Catalysts Market Estimates and Forecast, 2017-2030 (US$ Bn)
12.3.7.2. Rest of Asia Pacific Chemical Processing Catalysts, By Type, 2017-2030 (US$ Bn)
12.3.7.3. Rest of Asia Pacific Chemical Processing Catalysts, By Application, 2017-2030 (US$ Bn)
13. Latin America Chemical Processing Catalysts Market Analysis
13.1. Latin America Chemical Processing Catalysts Market, by Type, 2017-2030(US$ Bn)
13.1.1. Overview
13.1.2. SRC Analysis
13.2. Latin America Chemical Processing Catalysts Market, by Application, 2017-2030(US$ Bn)
13.2.1. Overview
13.2.2. SRC Analysis
13.3. Latin America Chemical Processing Catalysts Market, by Country, 2017-2030 (US$ Bn)
13.3.1. Latin America Chemical Processing Catalysts Market, by Country, 2022 Vs 2030 (in%)
13.3.2. Brazil
13.3.2.1. Brazil Chemical Processing Catalysts Market Estimates and Forecast, 2017-2030 (US$ Bn)
13.3.2.2. Brazil Chemical Processing Catalysts, By Type, 2017-2030 (US$ Bn)
13.3.2.3. Brazil Chemical Processing Catalysts, By Application, 2017-2030 (US$ Bn)
13.3.3. Argentina
13.3.3.1. Argentina Chemical Processing Catalysts Market Estimates and Forecast, 2017-2030 (US$ Bn)
13.3.3.2. Argentina Chemical Processing Catalysts, By Type, 2017-2030 (US$ Bn)
13.3.3.3. Argentina Chemical Processing Catalysts, By Application, 2017-2030 (US$ Bn)
13.3.4. Rest of Latin America
13.3.4.1. Rest of Latin America Chemical Processing Catalysts Market Estimates and Forecast, 2017-2030 (US$ Bn)
13.3.4.2. Rest of Latin America Chemical Processing Catalysts, By Type, 2017-2030 (US$ Bn)
13.3.4.3. Rest of Latin America Chemical Processing Catalysts, By Application, 2017-2030 (US$ Bn)
14. Middle East and Africa Chemical Processing Catalysts Market Analysis
14.1. Middle East and Africa Chemical Processing Catalysts Market, by Type, 2017-2030(US$ Bn)
14.1.1. Overview
14.1.2. SRC Analysis
14.2. Middle East and Africa Chemical Processing Catalysts Market, by Application, 2017-2030(US$ Bn)
14.2.1. Overview
14.2.2. SRC Analysis
14.3. Middle East and Africa Chemical Processing Catalysts Market, by Country, 2017-2030 (US$ Bn)
14.3.1. Middle East and Africa Chemical Processing Catalysts Market, by Country, 2022 Vs 2030 (in%)
14.3.2. GCC Countries
14.3.2.1. GCC Countries Chemical Processing Catalysts Market Estimates and Forecast, 2017-2030 (US$ Bn)
14.3.2.2. GCC Countries Chemical Processing Catalysts, By Type, 2017-2030 (US$ Bn)
14.3.2.3. GCC Countries Chemical Processing Catalysts, By Application, 2017-2030 (US$ Bn)
14.3.3. South Africa
14.3.3.1. South Africa Chemical Processing Catalysts Market Estimates and Forecast, 2017-2030 (US$ Bn)
14.3.3.2. South Africa Chemical Processing Catalysts, By Type, 2017-2030 (US$ Bn)
14.3.3.3. South Africa Chemical Processing Catalysts, By Application, 2017-2030 (US$ Bn)
14.3.4. Rest of Middle East and Africa
14.3.4.1. Rest of Middle East and Africa Chemical Processing Catalysts Market Estimates and Forecast, 2017-2030 (US$ Bn)
14.3.4.2. Rest of Middle East and Africa Chemical Processing Catalysts, By Type, 2017-2030 (US$ Bn)
14.3.4.3. Rest of Middle East and Africa Chemical Processing Catalysts, By Application, 2017-2030 (US$ Bn)
15. Company Profiles
15.1. Air Products and Chemicals, Inc. (USA)
15.1.1. Company Overview
15.1.2. Product /Services Portfolio
15.1.3. Geographical Presence
15.1.4. Financial Summary
15.1.4.1. Market Revenue and Net Profit (2019-2022)
15.1.4.2. Business Segment Revenue Analysis
15.1.4.3. Geographical Revenue Analysis
15.2. Albemarle Corp. (USA)
15.3. BASF Catalysts LLC (USA)
15.4. Clariant (Switzerland)
15.5. Evonik Industries AG (Germany)
15.6. Johnson Matthey (UK)
15.7. INEOS Group Holdings S.A (Switzerland)
15.8. LyondellBasell Industries N.V. (The Netherlands)
15.9. W. R. Grace & Co. (USA)
List of Figures
FIG. 1 Global Chemical Processing Catalysts Market: Research Methodology
FIG. 2 Market Size Estimation – Top Down & Bottom up Approach
FIG. 3 Global Chemical Processing Catalysts Market Segmentation
FIG. 4 Global Chemical Processing Catalysts Market, by Type, 2022 (US$ Bn)
FIG. 5 Global Chemical Processing Catalysts Market, by Application, 2022 (US$ Bn)
FIG. 6 Global Chemical Processing Catalysts Market, by Geography, 2022 (US$ Bn)
FIG. 7 Attractive Investment Proposition, by Type, 2022
FIG. 8 Attractive Investment Proposition, by Application, 2022
FIG. 9 Attractive Investment Proposition, by Geography, 2022
FIG. 10 Global Market Share Analysis of Key Chemical Processing Catalysts Market Manufacturers, 2022
FIG. 11 Global Market Positioning of Key Chemical Processing Catalysts Market Manufacturers, 2022
FIG. 12 Global Chemical Processing Catalysts Market Value Contribution, By Type, 2022 & 2030 (Value %)
FIG. 13 Global Chemical Processing Catalysts Market, by Polymerization Catalysts, Value, 2017-2030 (US$ Bn)
FIG. 14 Global Chemical Processing Catalysts Market, by Oxidation Catalysts, Value, 2017-2030 (US$ Bn)
FIG. 15 Global Chemical Processing Catalysts Market, by Organic Synthesis Catalysts, Value, 2017-2030 (US$ Bn)
FIG. 16 Global Chemical Processing Catalysts Market, by Synthesis Gas Catalysts, Value, 2017-2030 (US$ Bn)
FIG. 17 Global Chemical Processing Catalysts Market, by Hydrogenation Catalysts, Value, 2017-2030 (US$ Bn)
FIG. 18 Global Chemical Processing Catalysts Market, by Dehydrogenation Catalysts, Value, 2017-2030 (US$ Bn)
FIG. 19 Global Chemical Processing Catalysts Market Value Contribution, By Application, 2022 & 2030 (Value %)
FIG. 20 Global Chemical Processing Catalysts Market, by Production of Isobutylene, Value, 2017-2030 (US$ Bn)
FIG. 21 Global Chemical Processing Catalysts Market, by Chemicals, 2017-2030 (US$ Bn)
FIG. 22 Global Chemical Processing Catalysts Market, by Others, 2017-2030 (US$ Bn)
FIG. 23 North America Chemical Processing Catalysts Market, 2017-2030 (US$ Bn)
FIG. 24 U.S. Chemical Processing Catalysts Market, 2017-2030 (US$ Bn)
FIG. 25 Canada Chemical Processing Catalysts Market, 2017-2030 (US$ Bn)
FIG. 26 Europe Chemical Processing Catalysts Market, 2017-2030 (US$ Bn)
FIG. 27 Germany Chemical Processing Catalysts Market, 2017-2030 (US$ Bn)
FIG. 28 France Chemical Processing Catalysts Market, 2017-2030 (US$ Bn)
FIG. 29 U.K. Chemical Processing Catalysts Market, 2017-2030 (US$ Bn)
FIG. 30 Italy Chemical Processing Catalysts Market, 2017-2030 (US$ Bn)
FIG. 31 Spain Chemical Processing Catalysts Market, 2017-2030 (US$ Bn)
FIG. 32 Rest of Europe Chemical Processing Catalysts Market, 2017-2030 (US$ Bn)
FIG. 33 Asia Pacific Chemical Processing Catalysts Market, 2017-2030 (US$ Bn)
FIG. 34 China Chemical Processing Catalysts Market, 2017-2030 (US$ Bn)
FIG. 35 Japan Chemical Processing Catalysts Market, 2017-2030 (US$ Bn)
FIG. 36 India Chemical Processing Catalysts Market, 2017-2030 (US$ Bn)
FIG. 37 South Korea Chemical Processing Catalysts Market, 2017-2030 (US$ Bn)
FIG. 38 South-East Asia Chemical Processing Catalysts Market, 2017-2030 (US$ Bn)
FIG. 39 Rest of Asia Pacific Chemical Processing Catalysts Market, 2017-2030 (US$ Bn)
FIG. 40 Latin America Chemical Processing Catalysts Market, 2017-2030 (US$ Bn)
FIG. 41 Brazil Chemical Processing Catalysts Market, 2017-2030 (US$ Bn)
FIG. 42 Mexico Chemical Processing Catalysts Market, 2017-2030 (US$ Bn)
FIG. 43 Rest of Latin America Chemical Processing Catalysts Market, 2017-2030 (US$ Bn)
FIG. 44 Middle East & Africa Chemical Processing Catalysts Market, 2017-2030 (US$ Bn)
FIG. 45 GCC Countries Chemical Processing Catalysts Market, 2017-2030 (US$ Bn)
FIG. 46 South Africa Chemical Processing Catalysts Market, 2017-2030 (US$ Bn)
FIG. 47 Rest of Middle East and Africa Chemical Processing Catalysts Market, 2017-2030 (US$ Bn)
List of Tables
TABLE 1 Market Snapshot: Global Chemical Processing Catalysts Market
TABLE 2 Global Chemical Processing Catalysts Market: Market Drivers Impact Analysis
TABLE 3 Global Chemical Processing Catalysts Market: Market Restraints Impact Analysis
TABLE 4 Global Chemical Processing Catalysts Market, by Competitive Benchmarking, 2022
TABLE 5 Global Chemical Processing Catalysts Market, by Geographical Presence Analysis, 2022
TABLE 6 Global Chemical Processing Catalysts Market, by Key Strategies Analysis, 2022
TABLE 7 Global Chemical Processing Catalysts Market, by Polymerization Catalysts, By Region, 2017-2022 (US$ Bn)
TABLE 8 Global Chemical Processing Catalysts Market, by Polymerization Catalysts, By Region, 2023-2030 (US$ Bn)
TABLE 9 Global Chemical Processing Catalysts Market, by Oxidation Catalysts, By Region, 2017-2022 (US$ Bn)
TABLE 10 Global Chemical Processing Catalysts Market, by Oxidation Catalysts, By Region, 2023-2030 (US$ Bn)
TABLE 11 Global Chemical Processing Catalysts Market, by Organic Synthesis Catalysts, By Region, 2017-2022 (US$ Bn)
TABLE 12 Global Chemical Processing Catalysts Market, by Organic Synthesis Catalysts, By Region, 2023-2030 (US$ Bn)
TABLE 13 Global Chemical Processing Catalysts Market, by Synthesis Gas Catalysts, By Region, 2017-2022 (US$ Bn)
TABLE 14 Global Chemical Processing Catalysts Market, by Synthesis Gas Catalysts, By Region, 2023-2030 (US$ Bn)
TABLE 15 Global Chemical Processing Catalysts Market, by Hydrogenation Catalysts, By Region, 2017-2022 (US$ Bn)
TABLE 16 Global Chemical Processing Catalysts Market, by Hydrogenation Catalysts, By Region, 2023-2030 (US$ Bn)
TABLE 17 Global Chemical Processing Catalysts Market, by Dehydrogenation Catalysts, By Region, 2017-2022 (US$ Bn)
TABLE 18 Global Chemical Processing Catalysts Market, by Dehydrogenation Catalysts, By Region, 2023-2030 (US$ Bn)
TABLE 19 Global Chemical Processing Catalysts Market, by Production of Isobutylene, By Region, 2017-2022 (US$ Bn)
TABLE 20 Global Chemical Processing Catalysts Market, by Production of Isobutylene, By Region, 2023-2030 (US$ Bn)
TABLE 21 Global Chemical Processing Catalysts Market, by Chemicals, By Region, 2017-2022 (US$ Bn)
TABLE 22 Global Chemical Processing Catalysts Market, by Chemicals, By Region, 2023-2030 (US$ Bn)
TABLE 23 Global Chemical Processing Catalysts Market, by Others, By Region, 2017-2022 (US$ Bn)
TABLE 24 Global Chemical Processing Catalysts Market, by Others, By Region, 2023-2030 (US$ Bn)
TABLE 25 Global Chemical Processing Catalysts Market, by Type, 2017-2022 (US$ Bn)
TABLE 26 Global Chemical Processing Catalysts Market, by Type, 2023-2030 (US$ Bn)
TABLE 27 Global Chemical Processing Catalysts Market, by Application, 2017-2022 (US$ Bn)
TABLE 28 Global Chemical Processing Catalysts Market, by Application, 2023-2030 (US$ Bn)
TABLE 29 Global Chemical Processing Catalysts Market, by Region, 2017-2022 (US$ Bn)
TABLE 30 Global Chemical Processing Catalysts Market, by Region, 2023-2030 (US$ Bn)
TABLE 31 North America Chemical Processing Catalysts Market, by Type, 2017-2022 (US$ Bn)
TABLE 32 North America Chemical Processing Catalysts Market, by Type, 2023-2030 (US$ Bn)
TABLE 33 North America Chemical Processing Catalysts Market, by Application, 2017-2022 (US$ Bn)
TABLE 34 North America Chemical Processing Catalysts Market, by Application, 2023-2030 (US$ Bn)
TABLE 35 North America Chemical Processing Catalysts Market, by Country, 2017-2022 (US$ Bn)
TABLE 36 North America Chemical Processing Catalysts Market, by Country, 2023-2030 (US$ Bn)
TABLE 37 United States Chemical Processing Catalysts Market, by Type, 2017-2022 (US$ Bn)
TABLE 38 United States Chemical Processing Catalysts Market, by Type, 2023-2030 (US$ Bn)
TABLE 39 United States Chemical Processing Catalysts Market, by Application, 2017-2022 (US$ Bn)
TABLE 40 United States Chemical Processing Catalysts Market, by Application, 2023-2030 (US$ Bn)
TABLE 41 Canada Chemical Processing Catalysts Market, by Type, 2017-2022 (US$ Bn)
TABLE 42 Canada Chemical Processing Catalysts Market, by Type, 2023-2030 (US$ Bn)
TABLE 43 Canada Chemical Processing Catalysts Market, by Application, 2017-2022 (US$ Bn)
TABLE 44 Canada Chemical Processing Catalysts Market, by Application, 2023-2030 (US$ Bn)
TABLE 45 Mexico Chemical Processing Catalysts Market, by Type, 2017-2022 (US$ Bn)
TABLE 46 Mexico Chemical Processing Catalysts Market, by Type, 2023-2030 (US$ Bn)
TABLE 47 Mexico Chemical Processing Catalysts Market, by Application, 2017-2022 (US$ Bn)
TABLE 48 Mexico Chemical Processing Catalysts Market, by Application, 2023-2030 (US$ Bn)
TABLE 49 Europe Chemical Processing Catalysts Market, by Type, 2017-2022 (US$ Bn)
TABLE 50 Europe Chemical Processing Catalysts Market, by Type, 2023-2030 (US$ Bn)
TABLE 51 Europe Chemical Processing Catalysts Market, by Application, 2017-2022 (US$ Bn)
TABLE 52 Europe Chemical Processing Catalysts Market, by Application, 2023-2030 (US$ Bn)
TABLE 53 Europe Chemical Processing Catalysts Market, by Country, 2017-2022 (US$ Bn)
TABLE 54 Europe Chemical Processing Catalysts Market, by Country, 2023-2030 (US$ Bn)
TABLE 55 Germany Chemical Processing Catalysts Market, by Type, 2017-2022 (US$ Bn)
TABLE 56 Germany Chemical Processing Catalysts Market, by Type, 2023-2030 (US$ Bn)
TABLE 57 Germany Chemical Processing Catalysts Market, by Application, 2017-2022 (US$ Bn)
TABLE 58 Germany Chemical Processing Catalysts Market, by Application, 2023-2030 (US$ Bn)
TABLE 59 France Chemical Processing Catalysts Market, by Type, 2017-2022 (US$ Bn)
TABLE 60 France Chemical Processing Catalysts Market, by Type, 2023-2030 (US$ Bn)
TABLE 61 France Chemical Processing Catalysts Market, by Application, 2017-2022 (US$ Bn)
TABLE 62 France Chemical Processing Catalysts Market, by Application, 2023-2030 (US$ Bn)
TABLE 63 United Kingdom Chemical Processing Catalysts Market, by Type, 2017-2022 (US$ Bn)
TABLE 64 United Kingdom Chemical Processing Catalysts Market, by Type, 2023-2030 (US$ Bn)
TABLE 65 United Kingdom Chemical Processing Catalysts Market, by Application, 2017-2022 (US$ Bn)
TABLE 66 United Kingdom Chemical Processing Catalysts Market, by Application, 2023-2030 (US$ Bn)
TABLE 67 Italy Chemical Processing Catalysts Market, by Type, 2017-2022 (US$ Bn)
TABLE 68 Italy Chemical Processing Catalysts Market, by Type, 2023-2030 (US$ Bn)
TABLE 69 Italy Chemical Processing Catalysts Market, by Application, 2017-2022 (US$ Bn)
TABLE 70 Italy Chemical Processing Catalysts Market, by Application, 2023-2030 (US$ Bn)
TABLE 71 Spain Chemical Processing Catalysts Market, by Type, 2017-2022 (US$ Bn)
TABLE 72 Spain Chemical Processing Catalysts Market, by Type, 2023-2030 (US$ Bn)
TABLE 73 Spain Chemical Processing Catalysts Market, by Application, 2017-2022 (US$ Bn)
TABLE 74 Spain Chemical Processing Catalysts Market, by Application, 2023-2030 (US$ Bn)
TABLE 75 Rest of Europe Chemical Processing Catalysts Market, by Type, 2017-2022 (US$ Bn)
TABLE 76 Rest of Europe Chemical Processing Catalysts Market, by Type, 2023-2030 (US$ Bn)
TABLE 77 Rest of Europe Chemical Processing Catalysts Market, by Application, 2017-2022 (US$ Bn)
TABLE 78 Rest of Europe Chemical Processing Catalysts Market, by Application, 2023-2030 (US$ Bn)
TABLE 79 Asia Pacific Chemical Processing Catalysts Market, by Type, 2017-2022 (US$ Bn)
TABLE 80 Asia Pacific Chemical Processing Catalysts Market, by Type, 2023-2030 (US$ Bn)
TABLE 81 Asia Pacific Chemical Processing Catalysts Market, by Application, 2017-2022 (US$ Bn)
TABLE 82 Asia Pacific Chemical Processing Catalysts Market, by Application, 2023-2030 (US$ Bn)
TABLE 83 China Chemical Processing Catalysts Market, by Type, 2017-2022 (US$ Bn)
TABLE 84 China Chemical Processing Catalysts Market, by Type, 2023-2030 (US$ Bn)
TABLE 85 China Chemical Processing Catalysts Market, by Application, 2017-2022 (US$ Bn)
TABLE 86 China Chemical Processing Catalysts Market, by Application, 2023-2030 (US$ Bn)
TABLE 87 Japan Chemical Processing Catalysts Market, by Type, 2017-2022 (US$ Bn)
TABLE 88 Japan Chemical Processing Catalysts Market, by Type, 2023-2030 (US$ Bn)
TABLE 89 Japan Chemical Processing Catalysts Market, by Application, 2017-2022 (US$ Bn)
TABLE 90 Japan Chemical Processing Catalysts Market, by Application, 2023-2030 (US$ Bn)
TABLE 91 India Chemical Processing Catalysts Market, by Type, 2017-2022 (US$ Bn)
TABLE 92 India Chemical Processing Catalysts Market, by Type, 2023-2030 (US$ Bn)
TABLE 93 India Chemical Processing Catalysts Market, by Application, 2017-2022 (US$ Bn)
TABLE 94 India Chemical Processing Catalysts Market, by Application, 2023-2030 (US$ Bn)
TABLE 95 South Korea Chemical Processing Catalysts Market, by Type, 2017-2022 (US$ Bn)
TABLE 96 South Korea Chemical Processing Catalysts Market, by Type, 2023-2030 (US$ Bn)
TABLE 97 South Korea Chemical Processing Catalysts Market, by Application, 2017-2022 (US$ Bn)
TABLE 98 South Korea Chemical Processing Catalysts Market, by Application, 2023-2030 (US$ Bn)
TABLE 99 South-East Asia Chemical Processing Catalysts Market, by Type, 2017-2022 (US$ Bn)
TABLE 100 South-East Asia Chemical Processing Catalysts Market, by Type, 2023-2030 (US$ Bn)
TABLE 101 South-East Asia Chemical Processing Catalysts Market, by Application, 2017-2022 (US$ Bn)
TABLE 102 South-East Asia Chemical Processing Catalysts Market, by Application, 2023-2030 (US$ Bn)
TABLE 103 Rest of Asia Pacific Chemical Processing Catalysts Market, by Type, 2017-2022 (US$ Bn)
TABLE 104 Rest of Asia Pacific Chemical Processing Catalysts Market, by Type, 2023-2030 (US$ Bn)
TABLE 105 Rest of Asia Pacific Chemical Processing Catalysts Market, by Application, 2017-2022 (US$ Bn)
TABLE 106 Rest of Asia Pacific Chemical Processing Catalysts Market, by Application, 2023-2030 (US$ Bn)
TABLE 107 Latin America Chemical Processing Catalysts Market, by Type, 2017-2022 (US$ Bn)
TABLE 108 Latin America Chemical Processing Catalysts Market, by Type, 2023-2030 (US$ Bn)
TABLE 109 Latin America Chemical Processing Catalysts Market, by Application, 2017-2022 (US$ Bn)
TABLE 110 Latin America Chemical Processing Catalysts Market, by Application, 2023-2030 (US$ Bn)
TABLE 111 Brazil Chemical Processing Catalysts Market, by Type, 2017-2022 (US$ Bn)
TABLE 112 Brazil Chemical Processing Catalysts Market, by Type, 2023-2030 (US$ Bn)
TABLE 113 Brazil Chemical Processing Catalysts Market, by Application, 2017-2022 (US$ Bn)
TABLE 114 Brazil Chemical Processing Catalysts Market, by Application, 2023-2030 (US$ Bn)
TABLE 115 Argentina Chemical Processing Catalysts Market, by Type, 2017-2022 (US$ Bn)
TABLE 116 Argentina Chemical Processing Catalysts Market, by Type, 2023-2030 (US$ Bn)
TABLE 117 Argentina Chemical Processing Catalysts Market, by Application, 2017-2022 (US$ Bn)
TABLE 118 Argentina Chemical Processing Catalysts Market, by Application, 2023-2030 (US$ Bn)
TABLE 119 Rest of Latin America Chemical Processing Catalysts Market, by Type, 2017-2022 (US$ Bn)
TABLE 120 Rest of Latin America Chemical Processing Catalysts Market, by Type, 2023-2030 (US$ Bn)
TABLE 121 Rest of Latin America Chemical Processing Catalysts Market, by Application, 2017-2022 (US$ Bn)
TABLE 122 Rest of Latin America Chemical Processing Catalysts Market, by Application, 2023-2030 (US$ Bn)
TABLE 123 Middle East and Africa Chemical Processing Catalysts Market, by Type, 2017-2022 (US$ Bn)
TABLE 124 Middle East and Africa Chemical Processing Catalysts Market, by Type, 2023-2030 (US$ Bn)
TABLE 125 Middle East and Africa Chemical Processing Catalysts Market, by Application, 2017-2022 (US$ Bn)
TABLE 126 Middle East and Africa Chemical Processing Catalysts Market, by Application, 2023-2030 (US$ Bn)
TABLE 127 GCC Countries Chemical Processing Catalysts Market, by Type, 2017-2022 (US$ Bn)
TABLE 128 GCC Countries Chemical Processing Catalysts Market, by Type, 2023-2030 (US$ Bn)
TABLE 129 GCC Countries Chemical Processing Catalysts Market, by Application, 2017-2022 (US$ Bn)
TABLE 130 GCC Countries Chemical Processing Catalysts Market, by Application, 2023-2030 (US$ Bn)
TABLE 131 South Africa Chemical Processing Catalysts Market, by Type, 2017-2022 (US$ Bn)
TABLE 132 South Africa Chemical Processing Catalysts Market, by Type, 2023-2030 (US$ Bn)
TABLE 133 South Africa Chemical Processing Catalysts Market, by Application, 2017-2022 (US$ Bn)
TABLE 134 South Africa Chemical Processing Catalysts Market, by Application, 2023-2030 (US$ Bn)
TABLE 135 Rest of Middle East and Africa Chemical Processing Catalysts Market, by Type, 2017-2022 (US$ Bn)
TABLE 136 Rest of Middle East and Africa Chemical Processing Catalysts Market, by Type, 2023-2030 (US$ Bn)
TABLE 137 Rest of Middle East and Africa Chemical Processing Catalysts Market, by Application, 2017-2022 (US$ Bn)
TABLE 138 Rest of Middle East and Africa Chemical Processing Catalysts Market, by Application, 2023-2030 (US$ Bn)