
Market Overview
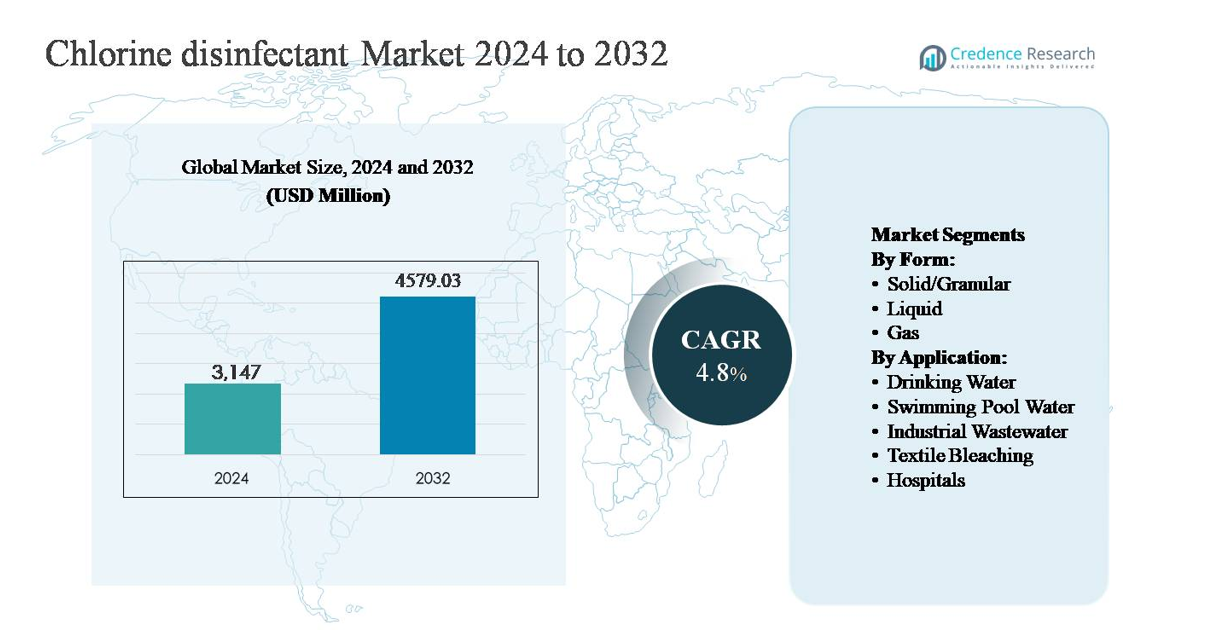
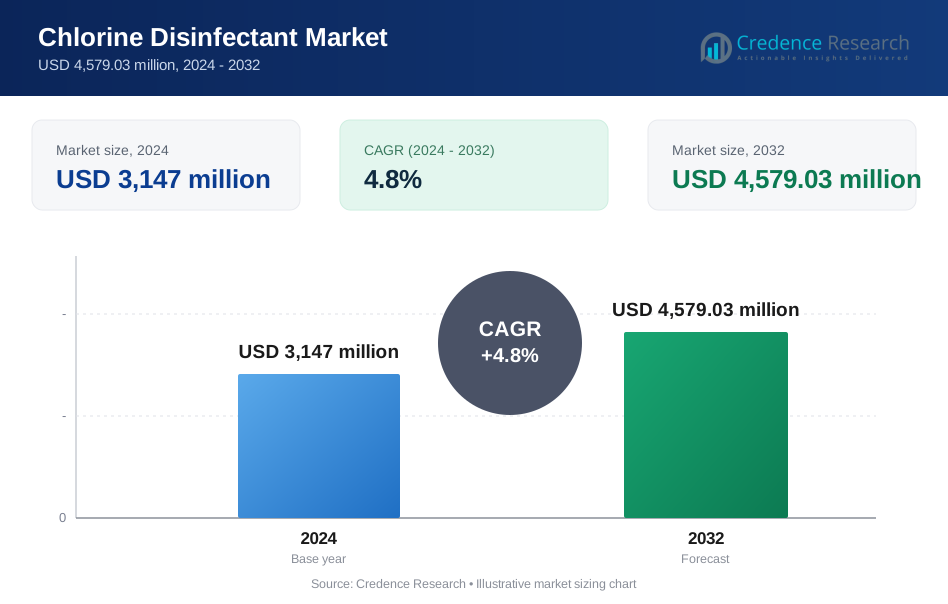
The global chlorine disinfectant market was valued at USD 3,147 million in 2024 and is projected to reach USD 4,579.03 million by 2032, expanding at a compound annual growth rate (CAGR) of 4.8% over the forecast period.
| REPORT ATTRIBUTE | DETAILS |
|---|---|
| Historical Period | 2020-2023 |
| Base Year | 2024 |
| Forecast Period | 2025-2032 |
| Chlorine Disinfectant Market Size 2024 | USD 3,147 million |
| Chlorine Disinfectant Market, CAGR | 4.8% |
| Chlorine Disinfectant Market Size 2032 | USD 4,579.03 million |
The chlorine disinfectant market is led by a mix of global consumer goods companies, specialty chemical manufacturers, and professional hygiene solution providers. Key players such as Ecolab, The Clorox Company, Procter & Gamble, Reckitt Benckiser, and 3M Company leverage strong brand recognition, broad product portfolios, and established distribution networks to serve municipal, industrial, healthcare, and household applications. Companies including VWR International, Nyco Products Company, Chemtex Speciality Ltd., Hind Pharma, and Deluxe Chemicals strengthen competition through regional presence and application-specific formulations. North America remains the leading region, accounting for approximately 34% of the global market share, supported by advanced water treatment infrastructure, strict sanitation regulations, and sustained demand from municipal utilities, healthcare facilities, and industrial users.
Market Insights
- The chlorine disinfectant market was valued at USD 3,147 million in 2024 and is projected to reach USD 4,579.03 million by 2032, growing at a CAGR of 4.8% during the forecast period, reflecting steady demand across water treatment, sanitation, and industrial applications.
- Market growth is primarily driven by rising demand for safe drinking water, stricter municipal water quality regulations, and expanding industrial wastewater treatment activities, with drinking water treatment emerging as the dominant application segment due to mandatory disinfection requirements and continuous consumption by utilities.
- Key market trends include increased adoption of solid and granular chlorine formulations, which hold the largest form-based segment share due to ease of handling and storage, alongside growing use of automated dosing and on-site chlorine generation systems to improve safety and operational efficiency.
- The competitive landscape is moderately consolidated, led by multinational players such as Ecolab, Clorox Company, Procter & Gamble, Reckitt Benckiser, and 3M, supported by strong brands, diversified portfolios, and long-term supply contracts with municipal and industrial customers.
- Regionally, North America leads with approximately 34% market share, followed by Asia Pacific at around 28% driven by infrastructure expansion, Europe with about 26% supported by strict regulations, while Latin America and the Middle East & Africa collectively account for the remaining share, supported by gradual sanitation improvements.
Market Segmentation Analysis:
By Form:
The chlorine disinfectant market by form is segmented into solid/granular, liquid, and gas, with solid/granular chlorine emerging as the dominant sub-segment, accounting for the largest market share. This dominance is driven by its high stability, longer shelf life, ease of storage and transportation, and widespread use in municipal water treatment and swimming pool sanitation. Calcium hypochlorite tablets and granules are particularly preferred in regions with decentralized water systems. Liquid chlorine follows, supported by continuous dosing requirements in large treatment plants, while gas chlorine remains limited to controlled industrial and municipal installations due to handling and safety constraints.
- For instance, Ecolab supplies bulk sodium hypochlorite solutions (such as their product line under the Nalco Water brand) paired with associated chemical feed systems for high-throughput municipal water facilities.
By Application:
By application, drinking water treatment represents the dominant sub-segment, holding the highest market share due to mandatory disinfection regulations and rising investments in water infrastructure. Municipal utilities rely heavily on chlorine for its proven effectiveness against pathogens and cost efficiency. Swimming pool water treatment is another significant segment, driven by recreational facility expansion and hygiene standards. Industrial wastewater treatment demand is supported by stricter effluent discharge norms, while textile bleaching and hospital sanitation contribute steadily, driven by chlorine’s strong oxidizing properties and critical role in infection control environments.
- For instance,"Hayward Industries' commercial pool sanitization systems, such as the AquaRite® HC and AquaRite® Flo Commercial, are designed to assist operators in maintaining free chlorine concentrations typically within the industry-standard range of 1 mg/L to 3 mg/L (or ppm), as recommended by health organizations and outlined in Hayward's own water chemistry guidelines.
Key Growth Drivers
Rising Demand for Safe Drinking Water and Municipal Sanitation
The increasing need for safe, potable water remains a primary growth driver for the chlorine disinfectant market. Rapid urbanization, population growth, and aging water infrastructure are compelling governments and utilities to strengthen water treatment systems. Chlorine disinfectants are widely adopted due to their proven efficacy against bacteria, viruses, and protozoa, as well as their ability to provide residual disinfection throughout distribution networks. Regulatory mandates on water quality standards further reinforce consistent demand, particularly in developing economies expanding piped water access. Additionally, public health awareness following disease outbreaks has increased investments in municipal sanitation programs, positioning chlorine as a cost-effective and scalable solution for large-volume water disinfection.
- For instance, SUEZ deploys sodium hypochlorite disinfection units in urban water schemes designed to maintain free chlorine residuals of 0.2–0.5 milligrams per liter at consumer endpoints, a range consistent with World Health Organization (WHO) guidelines for drinking-water quality.
Expansion of Industrial and Wastewater Treatment Activities
Growth in industrial activity across sectors such as chemicals, power generation, food processing, and manufacturing is driving demand for chlorine disinfectants in industrial wastewater treatment. Stricter environmental regulations governing effluent discharge are compelling industries to adopt reliable disinfection solutions before releasing treated water into the environment. Chlorine-based disinfectants are favored for their strong oxidizing capability, compatibility with existing treatment systems, and effectiveness across varying water qualities. As industrial facilities scale operations and comply with sustainability mandates, chlorine continues to play a critical role in meeting regulatory requirements while maintaining operational efficiency.
- For instance, Evoqua Water Technologies, through brands such as Wallace & Tiernan, provides highly engineered chlorine contact systems and advanced analytics for use in demanding industrial applications like power and chemical plants.
Increasing Emphasis on Public Health and Infection Control
Heightened focus on hygiene, infection prevention, and disease control in healthcare and public facilities is significantly supporting market growth. Hospitals, laboratories, and public institutions rely on chlorine disinfectants for surface sanitation, medical equipment cleaning, and water system disinfection. Their broad-spectrum antimicrobial performance and rapid action make them essential in high-risk environments. Governments and healthcare providers are also strengthening sanitation protocols to reduce hospital-acquired infections, driving consistent consumption. This sustained emphasis on preventive healthcare infrastructure continues to reinforce chlorine disinfectants as a foundational component of infection control strategies.
Key Trends & Opportunities
Adoption of Automated and On-Site Chlorine Generation Systems
A key trend shaping the market is the growing adoption of automated dosing and on-site chlorine generation systems. Utilities and industrial users are increasingly deploying systems that produce chlorine from salt or hypochlorite solutions to improve safety, reduce transportation risks, and ensure continuous supply. These systems enable precise dosing, lower handling hazards, and improved operational control, creating opportunities for equipment-integrated chlorine solutions. The trend is particularly prominent in large municipal water plants and industrial facilities seeking to optimize chemical usage while enhancing worker safety and compliance.
- For instance, De Nora Water Technologies integrates its on-site electrolytic chlorine generation systems, such as the ClorTec® and MIOX® product lines, with automated control platforms, typically using a Programmable Logic Controller (PLC) and operator interface.
Growth Opportunities in Emerging Economies and Infrastructure Development
Emerging economies present strong growth opportunities due to expanding water treatment infrastructure and rising investments in sanitation and industrial development. Governments across Asia, Africa, and Latin America are prioritizing access to clean drinking water and effective wastewater management, driving new installations of treatment plants. Chlorine disinfectants benefit from their affordability, scalability, and compatibility with both centralized and decentralized systems. As urban infrastructure projects accelerate and regulatory enforcement strengthens, demand for chlorine-based disinfection solutions is expected to expand steadily across these regions.
- For instance, “Larsen & Toubro (L&T) Water & Effluent Treatment executes numerous engineering, procurement, and construction (EPC) contracts for rural water supply schemes in India, which include the implementation of various chlorination and disinfection systems to ensure safe drinking water, serving millions of people."
Key Challenges
Health, Safety, and Handling Risks Associated with Chlorine
Despite its effectiveness, chlorine disinfectants face challenges related to safety, storage, and handling risks. Chlorine gas, in particular, poses significant hazards if improperly managed, leading to strict regulatory controls and higher compliance costs. Accidental leaks or exposure incidents can impact worker safety and public perception, prompting some end users to explore alternative disinfection methods. These concerns necessitate investments in safety systems, training, and monitoring, which can increase operational complexity and limit adoption in smaller facilities.
Competition from Alternative Disinfection Technologies
The market also faces growing competition from alternative disinfection technologies such as ultraviolet (UV) treatment, ozone, and advanced oxidation processes. These alternatives appeal to users seeking chemical-free solutions or reduced formation of disinfection by-products. In applications where residual disinfection is less critical, these technologies can partially substitute chlorine. Continuous innovation and regulatory scrutiny around by-products challenge chlorine disinfectants to maintain relevance, requiring manufacturers and utilities to optimize formulations and application practices to balance effectiveness, safety, and compliance.
Regional Analysis
North America
North America holds a leading share of approximately 34% of the global chlorine disinfectant market, driven by well-established municipal water treatment infrastructure and strict regulatory enforcement on water quality and sanitation. The United States dominates regional demand due to extensive use of chlorine in drinking water systems, swimming pools, and industrial wastewater treatment. High awareness of public health, combined with strong compliance requirements for hospitals and food processing facilities, sustains consistent consumption. Ongoing investments in upgrading aging water infrastructure and maintaining residual disinfection across distribution networks further reinforce chlorine’s continued dominance in the region.
Europe
Europe accounts for around 26% of the global market share, supported by stringent environmental regulations and advanced water and wastewater treatment practices. Countries such as Germany, France, and the United Kingdom maintain steady demand for chlorine disinfectants in municipal water treatment and industrial effluent management. The region’s focus on compliance with drinking water directives and industrial discharge standards drives consistent usage. While alternative disinfection technologies are gaining attention, chlorine remains widely used due to its cost efficiency and residual protection capabilities, particularly in large-scale municipal and industrial applications.
Asia Pacific
Asia Pacific represents the fastest-growing region, holding approximately 28% market share, driven by rapid urbanization, population growth, and expanding water treatment infrastructure. China and India are major contributors due to large-scale investments in drinking water supply, wastewater treatment, and industrial expansion. Government-led sanitation initiatives and rising awareness of waterborne diseases are accelerating chlorine adoption. The region’s reliance on cost-effective and scalable disinfection solutions favors chlorine disinfectants, particularly in emerging economies where centralized and decentralized water treatment systems are being developed at scale.
Latin America
such as Brazil and Mexico drive regional demand through investments in drinking water infrastructure and industrial wastewater management. Regulatory frameworks around water quality are strengthening, encouraging utilities to adopt reliable disinfection solutions. Chlorine remains the preferred option due to affordability and ease of application. However, uneven infrastructure development and budget constraints in certain countries limit faster adoption across the broader region.
Middle East & Africa
The Middle East & Africa region holds an estimated 5% market share, driven by water scarcity concerns and the need for effective disinfection in desalination and water reuse projects. Gulf countries rely heavily on chlorine disinfectants to ensure safe potable water supply, while parts of Africa are expanding basic water treatment infrastructure. Government and international initiatives focused on improving access to clean drinking water support market growth. Despite challenges related to infrastructure gaps, chlorine’s effectiveness, low cost, and adaptability make it a critical solution across the region.
Market Segmentations:
By Form:
- Solid/Granular
- Liquid
- Gas
By Application:
- Drinking Water
- Swimming Pool Water
- Industrial Wastewater
- Textile Bleaching
- Hospitals
By Geography
- North America
- U.S.
- Canada
- Mexico
- Europe
- Germany
- France
- U.K.
- Italy
- Spain
- Rest of Europe
- Asia Pacific
- China
- Japan
- India
- South Korea
- South-east Asia
- Rest of Asia Pacific
- Latin America
- Brazil
- Argentina
- Rest of Latin America
- Middle East & Africa
- GCC Countries
- South Africa
- Rest of the Middle East and Africa
Competitive Landscape
The chlorine disinfectant market features a moderately consolidated competitive landscape, characterized by the presence of large multinational chemical companies alongside regional and local producers. Leading players compete primarily on product reliability, supply consistency, safety compliance, and long-term contracts with municipal utilities and industrial customers. Established manufacturers benefit from vertically integrated production, strong distribution networks, and the ability to supply chlorine in multiple forms, including gas, liquid, and solid formulations. Competition is further shaped by regulatory compliance capabilities, particularly related to safe handling, transportation, and storage of chlorine products. Companies are increasingly investing in advanced packaging, automated dosing systems, and on-site chlorine generation solutions to differentiate offerings and reduce end-user safety risks. Strategic partnerships with water utilities, capacity expansions in emerging markets, and process efficiency improvements remain key competitive strategies. Overall, competitive intensity remains stable, supported by consistent demand across water treatment, industrial sanitation, and public health applications.
Key Player Analysis
- Ecolab
- Clorox Company
- Procter & Gamble
- Reckitt Benckiser
- 3M Company
- VWR International, LLC
- Nyco Products Company
- Chemtex Speciality Ltd.
- Hind Pharma
- Deluxe Chemicals
Recent Developments
- In October 2025, Ecolab Launch of Klercide™ Rapid Sporicide Ecolab Life Sciences introduced Klercide™ Rapid Sporicide on October 29, 2025, a new sporicidal disinfectant designed for cleanroom and pharmaceutical production environments. This solution is formulated to enhance microbial control while reducing surface corrosiveness and improving cleanroom turnover times for manufacturers.
- In March 2025, The Clorox Company announced updates in its CloroxPro professional hygiene lineup, expanding its disinfectant and surface cleaning products for institutional and commercial use. While specific chlorine formulations were part of this expanded portfolio, details were highlighted in the company’s official March 3, 2025 press releases.
- In July 2, 2024, Ecolab launched its Disinfectant 1 Wipe, the first EPA-registered 100% plastic-free, degradable disinfectant wipe, delivering hospital-level disinfection with a 1-minute contact time and demonstrating rapid efficacy including as little as 30-second kill times against SARS-CoV-2 in tests.
Report Coverage
The research report offers an in-depth analysis based on Form, Application and Geography. It details leading market players, providing an overview of their business, product offerings, investments, revenue streams, and key applications. Additionally, the report includes insights into the competitive environment, SWOT analysis, current market trends, as well as the primary drivers and constraints. Furthermore, it discusses various factors that have driven market expansion in recent years. The report also explores market dynamics, regulatory scenarios, and technological advancements that are shaping the industry. It assesses the impact of external factors and global economic changes on market growth. Lastly, it provides strategic recommendations for new entrants and established companies to navigate the complexities of the market.
Future Outlook
- Demand for chlorine disinfectants will remain stable due to their essential role in municipal drinking water treatment and residual disinfection.
- Expansion of water and wastewater infrastructure in emerging economies will continue to support long-term market growth.
- Solid and granular chlorine forms are expected to retain strong preference because of easier handling, storage stability, and safety advantages.
- Adoption of automated dosing and on-site chlorine generation systems will increase to enhance operational efficiency and safety.
- Industrial wastewater treatment will remain a key consumption area as environmental compliance requirements become more stringent.
- Healthcare and public sanitation applications will continue to drive consistent demand for chlorine-based disinfectants.
- Technological improvements will focus on safer packaging, controlled-release formulations, and reduced handling risks.
- Competition from alternative disinfection technologies will encourage optimization of chlorine application practices rather than displacement.
- Regional growth will be strongest in Asia Pacific and parts of Africa due to infrastructure development and sanitation initiatives.
- Chlorine disinfectants will remain a cost-effective and widely adopted solution across both centralized and decentralized treatment systems.
Request a Free Sample
Fill in your details and we'll send you a free sample report.
- Sample data tables & charts
- Research methodology
Need a Custom Version of This Report?
Tailor the scope, geography, or segments to your exact requirements.
- Custom geography or segment scope
- Direct access to our analyst team
Frequently Asked Questions
What is the current market size for the chlorine disinfectant market, and what is its projected size in 2032?
At what Compound Annual Growth Rate is the chlorine disinfectant market projected to grow between 2024 and 2032?
What are some key drivers fueling the growth of the chlorine disinfectant market?
Who are the leading companies in the chlorine disinfectant market?
Which region commanded the largest share of the chlorine disinfectant market in 2024?
Table of Content
Chapter 1. Report Introduction
- 1.1 Report Description & Purpose
- 1.1.1 Report Title & Market Definition
- 1.1.2 Unique Selling Propositions (USP) & Key Differentiators
- 1.1.3 Value Proposition for Stakeholders
- 1.2 Research Objectives
- 1.2.1 Market Sizing Objectives (Volume & Revenue)
- 1.2.2 Segmentation Objectives
- 1.2.3 Competitive Intelligence Objectives
- 1.2.4 Forecast & Scenario Objectives
- 1.3 Report Scope
- 1.3.1 Chlorine Disinfectant Scope – Types & Subtypes Covered
- 1.3.2 Geographic Scope – Regions & Countries Covered
- 1.3.3 Historical Period, Base Year & Forecast Period (2024; forecast to 2032)
- 1.3.4 Inclusions & Exclusions
- 1.4 HS Code & Classification Framework
- 1.5 Currency, Units & Pricing Basis
- 1.6 Target Stakeholders
- 1.7 Limitations & Assumptions
Chapter 2. Executive Summary
- 2.1 Global Chlorine Disinfectant Market Snapshot
- 2.1.1 Market Size – Historical (2024) & Forecast (2024-2032) (2024: USD 3,147 million → 2032: USD 4,579.03 million)
- 2.1.2 Volume & Revenue – Global Totals
- 2.1.3 Key Market Highlights – Top Five Facts
- 2.2 Chlorine Disinfectant Market Segmentation Snapshot
- 2.2.1 Market Split by Region – 2024 vs. 2032
- 2.3 Competitive Snapshot
- 2.3.1 Top 10 Players by Revenue Share – 2024
- 2.3.2 Top 10 Players by Volume Share – 2024
- 2.3.3 Recent Strategic Developments (18-Month Summary)
- 2.4 Key Investment Highlights & Strategic Conclusions
Chapter 3. Chlorine Disinfectant Market Dynamics & Industry Analysis
- 3.1 Market Overview & Context
- 3.1.1 Chlorine Disinfectant Market Position in the Broader Automotive Value Chain
- 3.1.2 OEM vs. Replacement Market Dynamics
- 3.1.3 Market Maturity & Development Stage by Region
- 3.2 Chlorine Disinfectant Market Drivers
- 3.3 Chlorine Disinfectant Market Restraints & Challenges
- 3.4 Chlorine Disinfectant Market Opportunities
- 3.5 Porter's Five Forces Analysis
- 3.5.1 Threat of New Entrants
- 3.5.2 Bargaining Power of Suppliers
- 3.5.3 Bargaining Power of Buyers
- 3.5.4 Threat of Substitutes
- 3.5.5 Competitive Rivalry – Intensity Assessment
- 3.6 Chlorine Disinfectant Value Chain Analysis
- 3.6.1 Upstream – Raw Material/Input Suppliers
- 3.6.1.1 Raw Material/Input 1
- 3.6.1.2 Raw Material/Input 2
- 3.6.1.3 Raw Material/Input 3
- 3.6.2 Midstream – Production/Manufacturing/Service Delivery
- 3.6.2.1 Production/Process Overview
- 3.6.2.2 Key Facility Locations & Capacity by Manufacturer
- 3.6.3 Downstream – Distribution & End Consumer
- 3.6.3.1 Primary Channel – B2B/OEM
- 3.6.3.2 Secondary Channels – Dealer, Retail, Online, Direct
- 3.6.4 Value Chain Profitability Analysis
- 3.6.1 Upstream – Raw Material/Input Suppliers
- 3.7 PESTEL Analysis
- 3.7.1 Political Factors
- 3.7.2 Economic Factors
- 3.7.3 Social Factors
- 3.7.4 Technological Factors
- 3.7.5 Environmental Factors
- 3.7.6 Legal Factors
- 3.8 Chlorine Disinfectant Supply Chain Analysis
- 3.8.1 Raw Material/Input Supply Risk Assessment
- 3.8.2 Manufacturing Concentration Risk (Geographic Exposure)
- 3.8.3 Trade Disruption Impact Analysis
- 3.9 Regulatory & Policy Landscape
Note: The regulatory and policy landscape section covers regulations based on their applicability to the market, Chlorine Disinfectant category, geography, and scope of the study. Only regulatory frameworks with a material impact on operations, compliance, trade, sustainability, or market access are analyzed in detail.
Chapter 4. Key Investment Pockets & Opportunity Analysis
- 4.1 Chlorine Disinfectant Market Attractiveness Analysis
- 4.1.1 By Region – Investment Attractiveness Matrix (Volume × CAGR)
- 4.2 Absolute Revenue Growth Opportunity
- 4.2.1 By Region – Absolute USD Growth Through 2032
- 4.3 Incremental Volume Opportunity
- 4.3.1 By Region – Incremental Volume Through 2032
- 4.3.2 Segment – Incremental Volume
- 4.4 Emerging Submarket Opportunity Deep Dive (Subject to Applicability)
- 4.5 Emerging Market Opportunity Scorecards
- 4.5.1 United States
- 4.5.2 Europe
- 4.5.3 Asia
- 4.5.4 Middle East & Africa
Note: Emerging Market Opportunity Scorecards will be included based on relevance and strategic importance. Regions listed are indicative and may vary depending on data availability and market dynamics.
Chapter 5. Chlorine Disinfectant Import-Export Analysis & Trade Flows
- 5.1 Global Trade Overview
- 5.1.1 Global Export Value by Country (2024)
- 5.1.2 Global Export Volume by Country (2024)
- 5.1.3 Global Import Value by Country (2024)
- 5.1.4 Global Import Volume by Country (2024)
- 5.1.5 Net Trade Balance by Country (2024)
- 5.2 Export Analysis – Segment
- 5.2.1 Type 1 (HS Code)
- 5.2.2 Type 2 (HS Code)
- 5.2.3 Type 3 (HS Code)
- 5.2.4 Type 4 (HS Code)
- 5.2.5 Type 5 (HS Code)
- 5.3 Import Analysis – Segment
- 5.3.1 Type 1 (HS Code)
- 5.3.2 Type 2 (HS Code)
- 5.3.3 Type 3 (HS Code)
- 5.3.4 Type 4 (HS Code)
- 5.3.5 Type 5 (HS Code)
- 5.4 Average Unit Trade Prices
- 5.4.1 Average Export Price – Segment & Country
- 5.4.2 Average Import Price – Segment & Source Country
- 5.4.3 Price Trends (2024)
- 5.5 Key Trade Route Analysis
- 5.5.1 Trade Route 1
- 5.5.2 Trade Route 2
- 5.5.3 Trade Route 3
- 5.5.4 Trade Route 4
- 5.5.5 Trade Route 5
- 5.6 Trade Policy Impact Assessment
- 5.6.1 US Anti-Dumping & Section 301 Tariffs
- 5.6.2 EU Customs Union Impact
- 5.6.3 Major Free Trade Agreements
- 5.6.4 USMCA Rules of Origin
Note: Trade policy analysis will be included only where relevant to the Chlorine Disinfectant market.
Chapter 6. Competitive Landscape & Company Benchmarking
- 6.1 Chlorine Disinfectant Market Concentration & Structure
- 6.1.1 Herfindahl-Hirschman Index (HHI) – vs. 2024
- 6.1.2 Tier 1, Tier 2 & Tier 3 Market Structure
- 6.1.3 Global, Regional & Local Player Dynamics
- 6.2 Chlorine Disinfectant Market Share Analysis – 2024
- 6.2.1 Global Revenue Share by Company
- 6.2.2 Global Volume Share by Company
- 6.2.3 Regional Revenue Share
- 6.2.4 Market Share Evolution ( vs. 2024)
- 6.2.5 OEM Segment Share by Company
- 6.2.6 Replacement Segment Share by Company
- 6.3 Production/Delivery Capacity & Facility Analysis
- 6.3.1 Global Installed Capacity
- 6.3.2 Capacity Utilization Rates
- 6.3.3 Production/Output Volume
- 6.3.4 Facility Locations & Capacity Map
- 6.3.5 Planned Capacity Additions
- 6.4 Chlorine Disinfectant Competitive Benchmarking Matrix
- 6.4.1 Revenue, Volume, CAGR & Profitability Comparison
- 6.4.2 Channel Revenue Mix
- 6.4.3 Geographic Revenue Exposure
- 6.4.4 R&D Intensity
- 6.4.5 Sustainability Maturity
- 6.5 Strategic Developments in Chlorine Disinfectant (Last 24 Months)
- 6.5.1 Mergers, Acquisitions & Divestments
- 6.5.2 New Chlorine Disinfectant Launches
- 6.5.3 Facility Expansions
- 6.5.4 Strategic Alliances, Joint Ventures & Partnerships
- 6.5.5 Distribution Expansion & Market Entry
- 6.5.6 Sustainability & ESG Initiatives
- 6.6 Competitive Strategy Mapping
- 6.6.1 Leader, Challenger, Follower & Niche Classification
- 6.6.2 Pricing Strategy Comparison
- 6.6.3 Channel Strategy Matrix
Note: Strategic developments are included based on their materiality and the availability of reliable information.
Chapter 7. Global Chlorine Disinfectant Market – By Distribution Channel
- 7.1 Segment Overview
- 7.1.1 Volume & Revenue Split by Channel (2024 & 2032)
- 7.1.2 Channel Mix Evolution (2024-2032)
Chapter 8. Regional Market Analysis – Global Overview
- 8.1 Global Regional Overview
- 8.1.1 Regional Volume Share
- 8.1.2 Regional Revenue Share
- 8.1.3 Regional Volume by Region
- 8.1.4 Regional Revenue by Region
- 8.1.5 Regional Forecast Through 2032
- 8.2 Cross-Regional Segment Analysis
- 8.2.1 By Distribution Channel
- 8.2.2 By Brand/Price Tier
Chapter 9. North America Chlorine Disinfectant Market
- 9.1 United States
- 9.2 Canada
- 9.3 Mexico
Chapter 10. Europe Chlorine Disinfectant Market
- 10.1 Germany
- 10.2 France
- 10.3 Italy
- 10.4 United Kingdom
- 10.5 Spain
- 10.6 Poland
- 10.7 Russia
- 10.8 Netherlands
- 10.9 Belgium
- 10.10 Sweden
- 10.11 Denmark
- 10.12 Norway
- 10.13 Rest of Europe
Chapter 11. Asia Pacific Chlorine Disinfectant Market
- 11.1 China
- 11.2 India
- 11.3 Japan
- 11.4 South Korea
- 11.5 Thailand
- 11.6 Indonesia
- 11.7 Vietnam
- 11.8 Malaysia
- 11.9 Australia
- 11.10 Rest of Asia Pacific
Chapter 12. Latin America Chlorine Disinfectant Market
- 12.1 Brazil
- 12.2 Argentina
- 12.3 Colombia
- 12.4 Chile
- 12.5 Rest of Latin America
Chapter 13. Middle East Chlorine Disinfectant Market
- 13.1 Saudi Arabia
- 13.2 United Arab Emirates
- 13.3 Turkey
- 13.4 Israel
- 13.5 Iran
- 13.6 Rest of the Middle East
Chapter 14. Africa Chlorine Disinfectant Market
- 14.1 South Africa
- 14.2 Egypt
- 14.3 Nigeria
- 14.4 Morocco
- 14.5 Rest of Africa
Chapter 15. Chlorine Disinfectant Company Profiles
- 15.1 [Company 01]
- 15.1.1 Company Overview
- 15.1.2 Key Management Personnel
- 15.1.3 Products & Services Portfolio
- 15.1.4 Financial Performance
- 15.1.5 Key Market Focus & Geographic Presence
- 15.1.6 Recent Developments & Strategic Initiatives
Note: The company profile list is preliminary and may change based on research findings, market developments, data availability, and client requirements.
Chapter 16. Appendices
- Appendix A – List of Abbreviations & Acronyms
- Appendix B – Industry Classification Code Reference – Full Series
- Appendix C – Production & Capacity Data Tables
- Appendix D – End-Use & Demand Base Tables
- Appendix E – Consumption & Replacement Rate Assumptions
- Appendix F – ASP Reference Tables
- Appendix G – Manufacturing & Facility Database
- Appendix H – Import-Export Data Tables
- Appendix I – Regulatory Summary Tables
- Appendix J – Primary Research Participant List (Anonymized)
- Appendix K – Primary Research Questionnaire Framework
- Appendix L – Data Sources & Bibliography
- Appendix M – Market Size Divergence & Source Comparison
Chapter 17. Research Methodology
- 17.1 Research Framework & Philosophy
- 17.2 Secondary Research – Sources, Hierarchy & Data Extraction
- 17.3 Data Modeling – Bottom-Up & Top-Down Market Sizing
- 17.4 Primary Research – Stakeholder Framework, LOI & Sample Sizes
- 17.5 Forecast Methodology – Regression, Scenario & Sensitivity Analysis
- 17.6 Quality Control – Four-Layer Validation Framework
- 17.7 Limitations & Standard Assumptions
- 17.8 Disclaimer
