Market Overview:
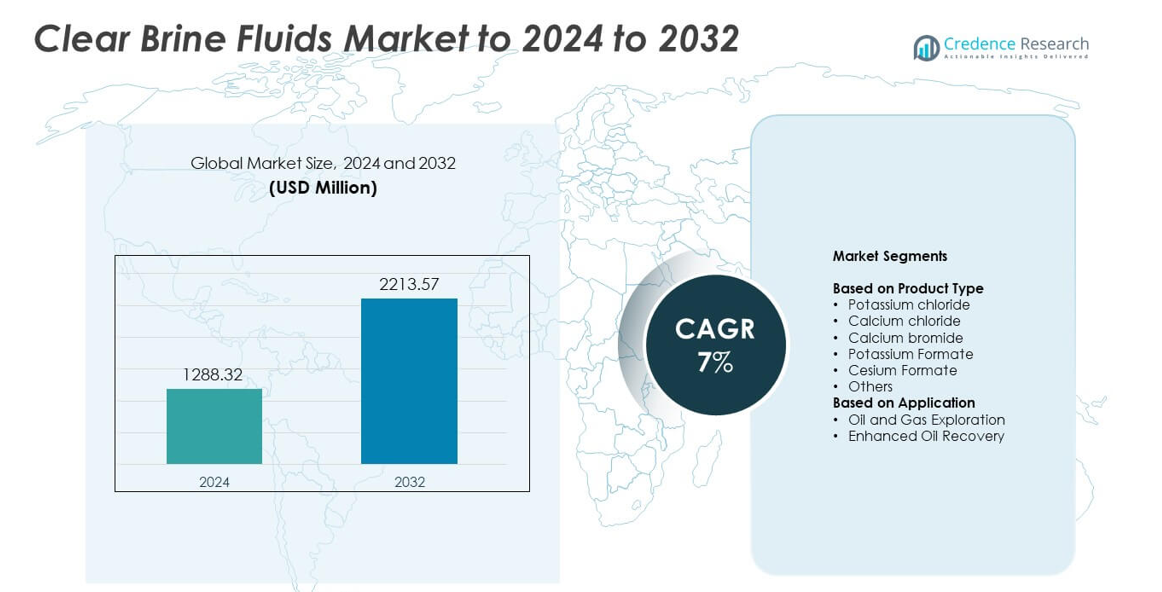
Clear Brine Fluids Market size was valued at USD 1288.32 Million in 2024 and is anticipated to reach USD 2213.57 Million by 2032, at a CAGR of 7% during the forecast period.
| REPORT ATTRIBUTE |
DETAILS |
| Historical Period |
2020-2023 |
| Base Year |
2024 |
| Forecast Period |
2025-2032 |
| Clear Brine Fluids Market Size 2024 |
USD 1288.32 Million |
| Clear Brine Fluids Market, CAGR |
7% |
| Clear Brine Fluids Market Size 2032 |
USD 2213.57 Million |
The Clear Brine Fluids Market includes major players such as Halliburton, Albemarle Corporation, Tetra Technologies, Clements Fluids, Sinomine Specialty Fluids, Schlumberger Ltd., ICL Group Ltd., LANXESS, Egyptian Mud Engineering & Chemicals Company, and Lanxess AG. These companies supply high-density and environmentally compliant brines that support drilling, completion, and workover operations across global oilfields. Asia Pacific led the market in 2024 with around 28% share, driven by rising offshore projects and national exploration programs. North America followed with about 38% share due to strong shale activity and Gulf of Mexico operations, while Europe held nearly 22% share, supported by North Sea redevelopment.
Market Insights
- Clear Brine Fluids Market reached USD 1288.32 Million in 2024 and is projected to hit USD 2213.57 Million by 2032, growing at a CAGR of 7%.
- Market growth is driven by rising deepwater drilling, high-density brine adoption, and expanding horizontal drilling, with oil and gas exploration holding about 71% share in 2024.
- Key trends include increasing use of high-density bromide and formate brines, digital monitoring in fluid management, and stronger demand from mature field redevelopment programs.
- Competition intensifies as leading providers invest in advanced formulations, corrosion-control technologies, and brine recycling systems, shifting focus toward safer and more sustainable fluid solutions.
- North America held around 38% share, Asia Pacific captured about 28%, and Europe accounted for nearly 22% in 2024, while potassium chloride dominated product type with about 34% share due to strong compatibility with major drilling environments.
Access crucial information at unmatched prices!
Request your sample report today & start making informed decisions powered by Credence Research Inc.!
Download Sample
Market Segmentation Analysis:
By Product Type
Potassium chloride led the product type segment in 2024 with about 34% share due to its wide use in maintaining wellbore stability and controlling formation pressures during drilling. The compound offered strong compatibility with sensitive shale formations and reduced clay swelling, which increased adoption across major drilling programs. Calcium chloride and calcium bromide followed with steady demand for high-density fluid systems. Potassium formate and cesium formate gained traction in high-pressure and high-temperature wells where operators required safer, non-corrosive, and environmentally compliant brines.
- For instance, ATDM Drilling markets calcium bromide clear brine with a reported density of about 1.7 kilograms per liter for high-density completion and workover fluids.
By Application
Oil and gas exploration dominated the application segment in 2024 with nearly 71% share as clear brine fluids supported stable drilling performance, enhanced lubrication, and reduced formation damage. Exploration wells required precise density control, and clear brines provided clean, solids-free compositions that improved rate of penetration and minimized reservoir impairment. Enhanced oil recovery expanded with rising use of specialty brines in mature fields where operators aimed to boost sweep efficiency and sustain production from aging reservoirs.
- For instance, Baker Hughes’ PERFFLOW CM system was run in Mexico with a solids-free 9.0 pounds-per-gallon potassium chloride brine across an openhole completion using 4½-inch stand-alone screens
Key Growth Drivers
Rising Deepwater and Ultra-Deepwater Drilling
Deepwater drilling activity continues to expand as energy companies target harder-to-reach reserves. Clear brine fluids support high-pressure and high-temperature environments due to their stable density control and low solid content. Operators favor these fluids to minimize formation damage and maintain well integrity in complex offshore wells. Growing offshore investments across Brazil, the Gulf of Mexico, and West Africa strengthen demand. This momentum makes deepwater exploration one of the strongest growth drivers in the clear brine fluids market.
- For instance, by 2011, Statoil (now Equinor) had used cesium formate brine for a total of 432 days of HPHT operations across 29 deep HPHT gas wells in various fields, resulting in zero well-control incidents.
Shift Toward High-Performance and Environment-Friendly Brines
Energy companies are adopting high-performance and low-toxicity brines to meet stricter global environmental policies. Potassium formate and cesium formate solutions offer better biodegradability and improved safety while delivering superior thermal stability. These fluids reduce corrosion risks and enhance drilling efficiency in sensitive ecosystems. Their rising acceptance reflects a broader industry move toward cleaner chemistry, making the transition to sustainable clear brines a major growth driver in the market.
- For instance, Sinomine Specialty Fluids specifies cesium formate clear brine with density 2.20 grams per cubic centimeter, water activity 0.33 and true crystallization temperature 5.1 degrees Celsius
Increased Horizontal and Directional Drilling Activity
Shale and tight reservoir development continue to grow, increasing demand for stable, solids-free fluids. Clear brine formulations support high-angle wells by improving lubrication, reducing torque and drag, and preserving reservoir productivity. Horizontal drilling projects depend on precise density management, which enhances the appeal of advanced brine systems. Expansion of unconventional drilling in North America and emerging global basins positions this trend as a key growth driver for the clear brine fluids market.
Key Trends & Opportunities
Rising Adoption of High-Density Bromide and Formate Brines
High-density brine systems such as calcium bromide and formate blends are gaining wider use due to their strong performance in high-pressure and high-temperature wells. These fluids help operators reduce well control risks and improve reservoir protection. The shift from traditional chloride systems toward premium high-density brines creates strong opportunities for suppliers that offer advanced formulations. Growing global demand for safe and efficient fluid systems establishes high-density brines as a major trend and opportunity.
- For instance, Petra’s calcium bromide completion brine is supplied at a specific gravity of about 1.7 grams per cubic centimeter, allowing operators to formulate high-density, solids-free systems for well control and reservoir protection.
Automation and Digital Optimization in Fluid Management
Oilfield operators are integrating real-time monitoring and digital fluid management tools to improve drilling consistency. Automated systems help adjust density and viscosity with higher accuracy, cutting non-productive time and reducing wellbore risks. Service providers that combine clear brine chemistry with digital optimization stand to gain competitive advantages. This convergence of chemistry and digitalization is becoming a key trend and opportunity in the clear brine fluids market.
- For instance, SLB’s digital program in Ecuador’s Shushufindi field uses its Delfi environment to plan and coordinate pads with up to 12 wells per platform, integrating real-time data and automated workflows to optimize drilling and production performance across clustered wells.
Expansion of Mature Field Redevelopment Programs
Many producing regions are advancing redevelopment projects to enhance output from aging reservoirs. Clear brine fluids support these activities by improving wellbore cleanout and reducing damage during workover operations. Increased investment in production optimization presents new opportunities for brine suppliers. The need for safe, efficient workover fluids makes mature field redevelopment a growing trend and opportunity for the market.
Key Challenges
High Cost of Premium Brine Formulations
Cesium formate and other high-performance brines deliver superior thermal stability but come with high production and transportation costs. Their pricing limits adoption in cost-sensitive drilling programs, especially in onshore and shallow-water wells. Operators often choose lower-cost chloride-based fluids despite performance trade-offs. This economic barrier remains a major challenge that affects market penetration of advanced clear brine systems.
Stringent Environmental and Disposal Regulations
Clear brine fluids must comply with strict rules covering chemical toxicity, discharge limits, and waste handling. Disposal and recycling of spent brines add logistical complexity and operational cost for drilling contractors. Regions with sensitive ecosystems maintain tighter oversight, slowing project approvals. These regulatory pressures form a key challenge for manufacturers and operators, influencing formulation choices and increasing compliance demands.
Regional Analysis
North America
North America held about 38% share in 2024, driven by strong drilling activity across the United States and Canada. The region benefited from robust shale development, expanding horizontal wells, and consistent offshore operations in the Gulf of Mexico. Clear brine fluids gained steady demand due to strict performance standards and the need to reduce formation damage in complex wells. Service companies supplied high-density and environmentally compliant brines to support deeper and hotter plays. Rising workover and completion activity further strengthened consumption across major basins.
Europe
Europe accounted for nearly 22% share in 2024, supported by offshore projects in the North Sea and rising redevelopment of mature fields. Operators in the region focused on high-density calcium bromide and formate brines to handle harsh offshore conditions and elevated reservoir pressures. Environmental rules encouraged the use of safer, low-toxicity formulations that reduce ecological impact. Increased interest in optimizing output from aging assets maintained demand for advanced clear brine systems. Regional service providers also expanded recycling practices to meet sustainability goals.
Asia Pacific
Asia Pacific captured around 28% share in 2024, driven by growing exploration activity in China, India, Indonesia, and Australia. The region saw rising adoption of clear brine fluids in deepwater and ultra-deepwater projects across Southeast Asia. National oil companies expanded drilling investments, which increased the need for stable, solids-free fluid systems. Demand for chloride and bromide brines grew due to their cost efficiency and compatibility with regional formations. Rapid industrialization, higher energy demand, and new offshore blocks reinforced regional market expansion.
Middle East and Africa
Middle East and Africa held close to 9% share in 2024, supported by large-scale drilling programs in Saudi Arabia, the UAE, Qatar, and offshore West Africa. Operators relied on clear brine fluids to maintain reservoir integrity during workovers and completion operations in high-temperature wells. Expanding gas exploration and redevelopment of mature fields also increased consumption. The region emphasized reliable chloride-based and bromide-based brines to balance performance and cost. Rising long-term energy investments sustained steady market growth across major national oil producers.
Latin America
Latin America represented about 7% share in 2024, driven by strong offshore drilling growth in Brazil and rising onshore activity in Argentina and Colombia. The region used clear brine fluids extensively in pre-salt and deepwater wells where stable density control is essential. Demand increased for advanced fluid systems that reduce formation damage and improve drilling efficiency. Governments encouraged new exploration programs, which enhanced procurement of high-density brines. Workover campaigns in mature fields further supported regional market expansion across key producing countries.
Market Segmentations:
By Product Type
- Potassium chloride
- Calcium chloride
- Calcium bromide
- Potassium Formate
- Cesium Formate
- Others
By Application
- Oil and Gas Exploration
- Enhanced Oil Recovery
By Geography
- North America
- Europe
- Germany
- France
- U.K.
- Italy
- Spain
- Rest of Europe
- Asia Pacific
- China
- Japan
- India
- South Korea
- South-east Asia
- Rest of Asia Pacific
- Latin America
- Brazil
- Argentina
- Rest of Latin America
- Middle East & Africa
- GCC Countries
- South Africa
- Rest of the Middle East and Africa
Competitive Landscape
The Clear Brine Fluids Market features major players such as Halliburton, Albemarle Corporation, Tetra Technologies, Clements Fluids, Sinomine Specialty Fluids, Schlumberger Ltd., ICL Group Ltd., LANXESS, Egyptian Mud Engineering & Chemicals Company, and Lanxess AG. These companies focus on delivering advanced high-density and low-toxicity brine solutions tailored for deepwater, high-pressure, and high-temperature drilling environments. Market participants invest in research to improve thermal stability, reduce corrosion, and enhance compatibility with sensitive formations. Strategic initiatives include expanding production facilities, improving recycling capabilities, and developing environmentally compliant formulations to meet evolving regulations. Many providers strengthen partnerships with national oil companies and global exploration operators to secure long-term contracts. Growing interest in digital monitoring and automated fluid management systems further shapes competition, encouraging suppliers to integrate technology with brine solutions to reduce operational risks and improve well performance. Overall, innovation, cost-efficiency, and compliance remain the core competitive priorities in this market.
Shape Your Report to Specific Countries or Regions & Enjoy 30% Off!
Key Player Analysis
- Halliburton
- Albemarle Corporation
- Tetra Technologies
- Clements Fluids
- Sinomine Specialty Fluids
- Schlumberger Ltd.
- ICL Group Ltd.
- LANXESS
- Egyptian Mud Engineering & Chemicals Company
- Lanxess AG
Recent Developments
- In 2025, Tetra Technologies has continued to innovate in fluid chemistry to improve operational efficiency and reduce environmental impact, collaborating with major oilfield service companies.
- In 2024, SLB (Schlumberger) announced the acquisition of ChampionX Corporation, a notable supplier of production chemical technologies and artificial lift systems, to bolster its market position in the oil and gas sector, the acquisition completed in 2025.
- In 2023, LANXESS Disclosed plans to expand its production capacity for clear brine fluids in the U.S. to meet rising demand.
Report Coverage
The research report offers an in-depth analysis based on Product Type, Application and Geography. It details leading market players, providing an overview of their business, product offerings, investments, revenue streams, and key applications. Additionally, the report includes insights into the competitive environment, SWOT analysis, current market trends, as well as the primary drivers and constraints. Furthermore, it discusses various factors that have driven market expansion in recent years. The report also explores market dynamics, regulatory scenarios, and technological advancements that are shaping the industry. It assesses the impact of external factors and global economic changes on market growth. Lastly, it provides strategic recommendations for new entrants and established companies to navigate the complexities of the market.
Future Outlook
- The market will grow as deepwater and ultra-deepwater drilling projects expand globally.
- Demand will rise for high-density bromide and formate brines in high-temperature wells.
- Environmental rules will push operators toward safer and more sustainable brine formulations.
- Digital fluid monitoring systems will enhance accuracy and reduce operational risks.
- Mature field redevelopment will increase the need for efficient workover and completion fluids.
- National oil companies will boost procurement as exploration programs expand.
- Service providers will invest in brine recycling and waste reduction technologies.
- Unconventional drilling growth will strengthen consumption of solids-free clear brine systems.
- Innovation in corrosion-resistant additives will improve fluid performance in harsh reservoirs.
- Global energy demand growth will support long-term investment in advanced brine technologies.


