Market Overview:
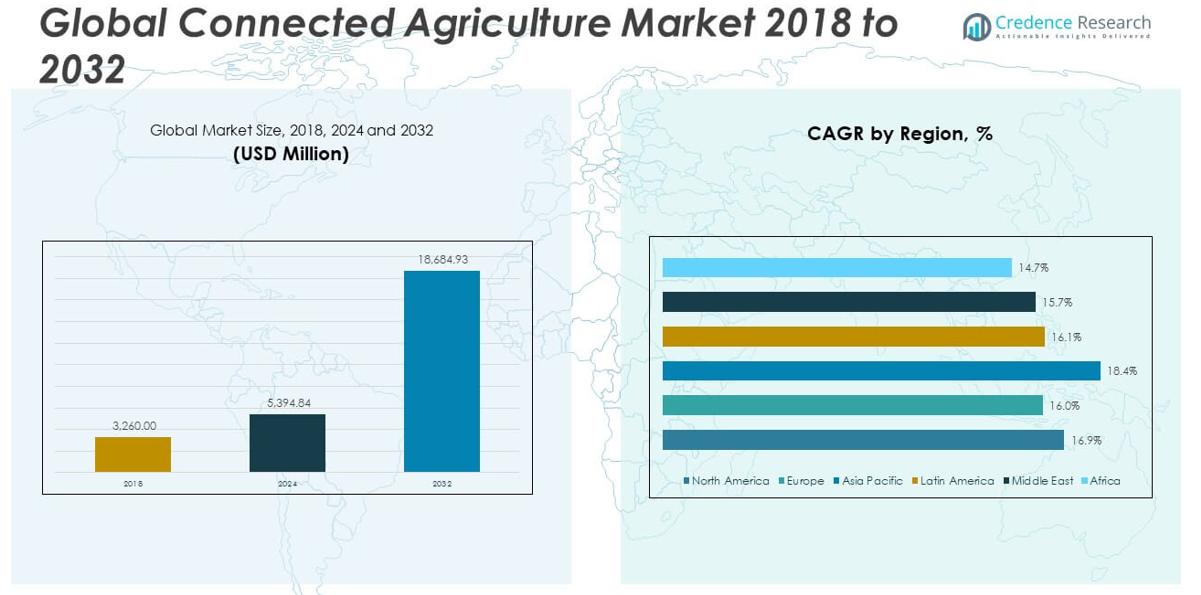
The Connected Agriculture Market size was valued at USD 3,260.00 million in 2018 to USD 5,394.84 million in 2024 and is anticipated to reach USD 18,684.93 million by 2032, at a CAGR of 16.88% during the forecast period.
| REPORT ATTRIBUTE |
DETAILS |
| Historical Period |
2020-2023 |
| Base Year |
2024 |
| Forecast Period |
2025-2032 |
| Connected Agriculture Market Size 2024 |
USD 5,394.84 million |
| Connected Agriculture Market, CAGR |
16.88% |
| Connected Agriculture Market Size 2032 |
USD 18,684.93 million |
The market is primarily driven by the growing need for sustainable and efficient farming solutions in response to global challenges such as population growth, climate change, and labor shortages. The rising demand for higher crop yields and resource optimization has led to increased integration of precision agriculture tools, including GPS-guided equipment, soil moisture sensors, and drone-based monitoring systems. Furthermore, advancements in wireless connectivity, smart farming equipment, and big data analytics have enabled real-time decision-making and automation across farm operations. Government initiatives supporting digital farming technologies and climate-resilient agriculture—especially in emerging economies—are also playing a pivotal role in boosting market adoption. Additionally, increased awareness about food safety and traceability is driving demand for platforms that can track crop and livestock conditions throughout the supply chain, ensuring compliance with quality and safety standards.
Regionally, North America dominates the connected agriculture market, accounting for the largest share in 2023 due to the region’s well-established digital infrastructure, high adoption of smart farming solutions, and strong governmental support. The U.S. leads in implementation, backed by investments in research and innovation through institutions and public-private partnerships. Asia Pacific, however, is anticipated to register the highest CAGR over the forecast period, driven by rising food security concerns, expanding agritech ecosystems, and supportive government policies in countries such as China, India, Japan, and Australia. Europe is also a key market, fueled by sustainability goals under the EU’s Green Deal and a strong emphasis on environmental stewardship through smart agriculture. Meanwhile, the Middle East & Africa and Latin America are emerging as potential growth regions. While challenges such as limited infrastructure and high initial costs persist, increasing digital connectivity and pilot programs are fostering gradual adoption of connected agricultural technologies in these regions.
Market Insights:
- The Connected Agriculture Market was valued at USD 5,394.84 million in 2024 and is projected to reach USD 18,684.93 million by 2032, growing at a CAGR of 16.88%.
- Rising demand for higher crop yields and efficient resource management is accelerating the use of precision tools like GPS-guided systems, sensors, and drones.
- Integration of IoT and cloud technologies is improving real-time decision-making, automation, and overall farm productivity across large-scale operations.
- Supportive government policies, digital farming subsidies, and public-private partnerships are expanding market adoption, particularly in emerging economies.
- Food traceability and supply chain transparency needs are pushing innovation in blockchain-based tracking, ensuring safety, compliance, and accountability.
- High upfront costs and lack of digital infrastructure are limiting adoption among small and medium-sized farms, creating gaps in access and scalability.
- North America leads the market share due to advanced infrastructure and high-tech adoption, while Asia Pacific is expected to grow fastest, driven by food security concerns and proactive government support.
Access crucial information at unmatched prices!
Request your sample report today & start making informed decisions powered by Credence Research Inc.!
Download Sample
Market Drivers:
Rising Need for Precision in Resource Management to Boost Agricultural Output
Global population growth is straining food supply chains and pressuring the agricultural sector to produce more with fewer resources. Connected Agriculture Market solutions address this need by enabling real-time monitoring and data-driven decisions that optimize inputs such as water, fertilizers, and pesticides. These tools help reduce operational inefficiencies and mitigate environmental damage while improving crop yield and profitability. IoT sensors, GPS-guided equipment, and drone surveillance offer granular visibility into soil health, weather conditions, and pest activity. Farmers using these technologies can respond faster to threats and fine-tune resource allocation based on actionable insights. This level of control makes connected agriculture a valuable asset in modern farm management.
- For example, John Deere’s Operations Center, as of 2025, provides farmers with granular, real-time data about machinery and field conditions. According to company reports, their advanced IoT-enabled sensors deployed on equipment such as the 8R Tractor series deliver readings with moisture accuracy to within 1.5%, guiding the application of water and nutrients based on live field maps.
Integration of IoT and Cloud Technologies Strengthens Operational Efficiency
The digital transformation of farming is being fueled by the integration of IoT, cloud computing, and big data analytics. The Connected Agriculture Market benefits significantly from the rising availability of low-cost sensors, wireless connectivity, and remote monitoring systems. These technologies enable seamless communication across farm equipment, storage units, and supply chain nodes. Cloud-based platforms centralize data for easy access, enabling stakeholders to monitor performance metrics and make informed decisions from anywhere. Real-time insights into weather patterns, irrigation needs, and equipment health lead to optimized farm operations and lower downtime. It supports data-driven agriculture by ensuring timely responses and consistent output across large-scale farms.
Government Policies and Investments in Agri-Digitalization Accelerate Adoption
Public and private sector involvement is accelerating the growth of the Connected Agriculture Market. Government initiatives supporting digital farming and sustainable agriculture practices have led to an increase in infrastructure investments and pilot projects. Subsidies for smart irrigation, drone-based surveillance, and precision farming systems help offset initial implementation costs. Countries like India, the U.S., and members of the European Union are actively launching programs to modernize farming and promote food security. These regulatory moves encourage agri-tech startups and large-scale operators to invest in scalable connected solutions. It also fosters collaboration between technology providers and farmers to expand access to digital tools in underserved regions.
- For instance, In India, the government-backed e-NAM digital trading platform facilitated the onboarding of over 18 million smallholder farmers to real-time digital supply chains, as cited in official Ministry of Agriculture data.
Demand for Food Traceability and Supply Chain Transparency Drives Innovation
Consumers and regulatory bodies are placing growing emphasis on food safety, sustainability, and ethical sourcing. The Connected Agriculture Market is evolving to meet these demands by offering traceability solutions that monitor crops and livestock throughout the production cycle. Blockchain integration, RFID tracking, and sensor-driven data collection ensure end-to-end visibility and verification. Food producers and distributors gain a competitive edge by demonstrating accountability and meeting certification standards. Retailers and importers use connected systems to monitor shelf life, storage conditions, and logistics in real time. It enables a transparent, efficient supply chain that aligns with global demands for quality and accountability.
Market Trends:
Adoption of Autonomous Farming Equipment is Gaining Momentum
The development and deployment of autonomous machinery are transforming traditional farming methods. Farmers are increasingly turning to self-driving tractors, robotic harvesters, and unmanned aerial vehicles to reduce manual labor and enhance productivity. These machines integrate with digital farm management platforms to operate with precision and consistency across various terrains. The Connected Agriculture Market is witnessing growing interest in autonomous solutions that reduce dependency on skilled labor and increase operational efficiency. Manufacturers are investing in AI-powered control systems and obstacle detection technologies to improve equipment safety and performance. It reflects the broader trend of automating core agricultural functions to achieve scalability and consistency.
- For example, Monarch Tractor launched the world’s first fully electric, driver-optional smart tractor with real-time data collection and remote fleet management, promising a 30% reduction in operating costs due to labor automation and electric propulsion.
Growing Influence of Data Monetization and Agri-Analytics Platforms
Data generated from connected agriculture systems is emerging as a strategic asset across the value chain. Companies are launching analytics platforms that offer tailored recommendations, risk forecasts, and financial planning based on farm data. These platforms help farmers unlock actionable insights while enabling agribusinesses to monetize aggregated information. The Connected Agriculture Market is expanding beyond operational tools to include digital ecosystems where data becomes a revenue source. Agri-tech startups and financial institutions are using these insights to develop credit scoring models and insurance products tailored to farmer risk profiles. It supports a data-driven economy that rewards transparency and performance.
Integration of Blockchain to Strengthen Agri-Supply Chain Integrity
Blockchain technology is gaining traction for its ability to create secure, immutable records across the agricultural supply chain. The Connected Agriculture Market is leveraging blockchain for traceability, contract enforcement, and fraud prevention. Producers can log data about seed origins, pesticide usage, and harvest conditions that cannot be tampered with or lost. Buyers and regulators verify claims instantly, improving trust across global markets. Smart contracts automate payments and compliance tasks, reducing administrative burden and delays. It enhances accountability and transparency, making food systems more resilient to disruptions and reputational risks.
- For example, IBM Food Trust, in partnership with Walmart and Nestlé, has implemented blockchain food provenance systems allowing retailers to trace contaminated food batches from shelf to farm in under 2.2 seconds down from several days previously accelerating food recalls and compliance
Expansion of Vertical Farming and Urban Agriculture Solutions
Urbanization and land scarcity are prompting innovations in vertical farming and indoor agriculture. These models use connected systems for climate control, nutrient delivery, and crop monitoring in controlled environments. The Connected Agriculture Market is increasingly catering to startups and enterprises building tech-enabled urban farms. IoT sensors and AI models help regulate lighting, humidity, and temperature to maximize yield and reduce resource waste. Cities are adopting these solutions to meet local food demand and reduce supply chain dependency. It represents a shift toward localized, high-tech food production that aligns with sustainability goals and consumer expectations.
Market Challenges Analysis:
High Cost of Technology Implementation Limits Access for Small and Medium Farms
The integration of IoT, AI, and data analytics into farming operations demands significant upfront investment. High costs related to hardware, connectivity infrastructure, and software subscriptions create barriers for small and medium-sized farmers. The Connected Agriculture Market continues to face resistance from this segment, which lacks the financial flexibility to adopt advanced digital solutions. It often requires additional training, support, and technical assistance, which further increases the total cost of ownership. Without scalable, cost-effective packages or government subsidies, many smallholders remain dependent on traditional practices. This limits the market’s full potential and creates unequal adoption across geographies and farm sizes.
Data Privacy, Connectivity Gaps, and Lack of Interoperability Create Operational Hurdles
Concerns around data security and limited rural connectivity also hinder the seamless deployment of connected agricultural systems. Farmers remain cautious about sharing sensitive data with third-party platforms, fearing misuse or lack of control. Weak network coverage in remote farming regions disrupts real-time data transmission and reduces system reliability. The Connected Agriculture Market struggles with standardization issues, where devices and platforms from different vendors fail to integrate efficiently. It complicates system maintenance, raises operational costs, and lowers confidence in long-term adoption. Addressing these technical and regulatory challenges is critical to building trust and unlocking broader market participation.
Market Opportunities:
Rising Demand for Climate-Smart Agriculture Opens New Avenues for Innovation
Changing climate patterns are forcing farmers to seek adaptive technologies that enhance resilience and sustainability. The Connected Agriculture Market can capitalize on this shift by offering precision tools that optimize irrigation, predict weather impacts, and manage crop cycles more efficiently. It supports farmers in adjusting to erratic rainfall, soil degradation, and temperature fluctuations through data-informed decisions. Policymakers and global agencies are also funding climate-smart initiatives, creating demand for scalable digital solutions. This presents a strong opportunity for providers to align their offerings with environmental goals and access new funding channels. Companies that deliver measurable climate benefits will gain a competitive advantage.
Emerging Markets and Digital Inclusion Programs Expand Market Reach
Developing regions in Asia, Africa, and Latin America are witnessing increased focus on rural digitization. Governments and NGOs are launching programs to improve internet access, subsidize agri-tech tools, and train farmers in digital literacy. The Connected Agriculture Market stands to benefit from these initiatives by entering untapped regions with high agricultural dependence. It can introduce modular, low-cost solutions that suit diverse farm scales and conditions. Strategic partnerships with local stakeholders will help accelerate market penetration and build long-term customer relationships. Expanding into these markets offers growth potential and addresses the global need for inclusive agricultural innovation.
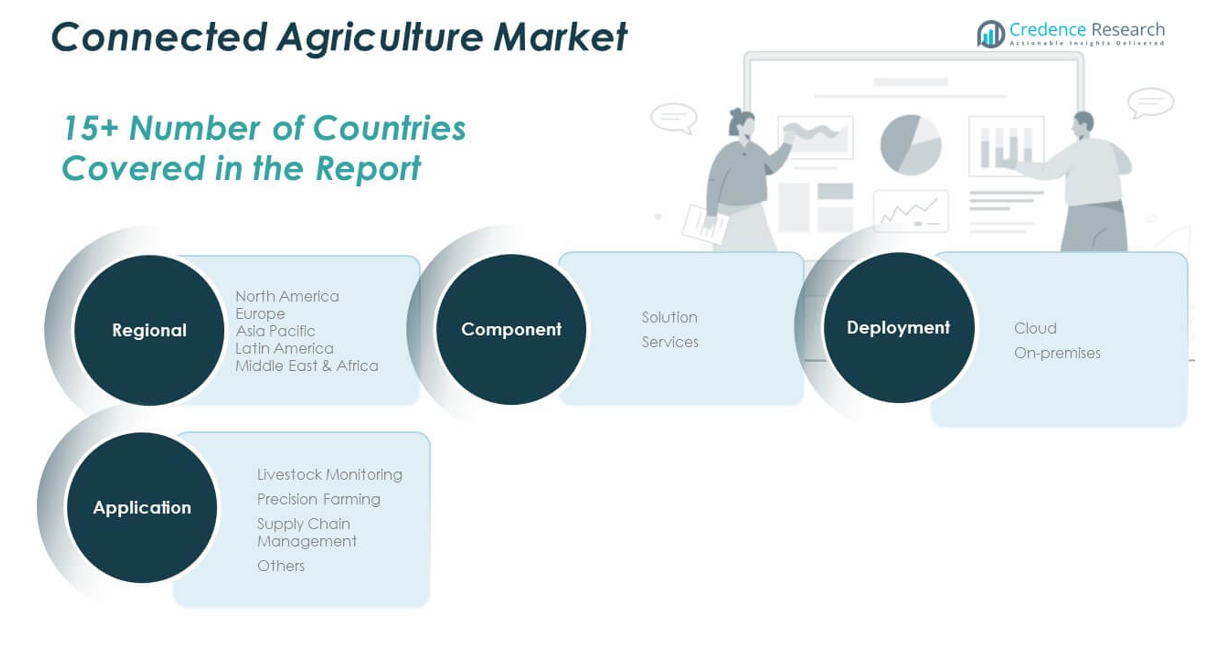
Market Segmentation Analysis:
The Connected Agriculture Market is segmented by component, application, and deployment, each playing a distinct role in shaping its growth trajectory.
By component, the market is divided into solution and services. Solutions dominate the segment due to the widespread use of platforms for farm management, analytics, and automation. Services are gaining traction, particularly in system integration, support, and consulting, which help optimize technology adoption and performance.
- For example, Climate FieldView(by Climate LLC, a Bayer subsidiary) is a leading digital agriculture platform, now used on over 210 million acres globally as of 2024.
By application, the Connected Agriculture Market includes livestock monitoring, precision farming, supply chain management, and others. Precision farming holds the largest share, driven by the demand for efficient input utilization and higher yield optimization. Livestock monitoring is expanding with the adoption of sensors and wearable devices for health tracking and productivity management. Supply chain management is gaining importance due to rising concerns about food traceability and regulatory compliance.
- For instance, Trimble’s precision agriculture product line which includes automated steering systems like Autopilot™, EZ‑Steer®, and EZ‑Pilot® Pro, as well as variable rate technology and flow control is widely used globally.
By deployment, the market is categorized into cloud and on-premises models. Cloud deployment leads the segment, favored for its scalability, remote accessibility, and cost-efficiency. On-premises deployment remains relevant for organizations prioritizing data control and custom configurations. It continues to evolve as digital infrastructure expands across farming regions.
Segmentation:
By Component
By Application
- Livestock Monitoring
- Precision Farming
- Supply Chain Management
- Others
By Deployment
By Region
- North America
- Europe
- Germany
- France
- U.K.
- Italy
- Spain
- Rest of Europe
- Asia Pacific
- China
- Japan
- India
- South Korea
- South-east Asia
- Rest of Asia Pacific
- Latin America
- Brazil
- Argentina
- Rest of Latin America
- Middle East & Africa
- GCC Countries
- South Africa
- Rest of the Middle East and Africa
Regional Analysis:
North America
The North America Connected Agriculture Market size was valued at USD 1,236.19 million in 2018 to USD 2,021.95 million in 2024 and is anticipated to reach USD 6,993.80 million by 2032, at a CAGR of 16.9% during the forecast period. North America holds the largest market share, accounting for over 35% of the global revenue in 2024. The region benefits from high technology adoption, well-established digital infrastructure, and strong investments in agri-tech startups. Government-backed initiatives and public-private collaborations further support widespread integration of precision farming and IoT-based systems. The U.S. leads in deploying connected tools for large-scale farms, focusing on efficiency and sustainability. It continues to serve as a hub for innovation in agricultural automation, AI-driven analytics, and cloud-based farm management platforms. The presence of major agri-tech companies fuels consistent product development and market expansion.
Europe
The Europe Connected Agriculture Market size was valued at USD 778.16 million in 2018 to USD 1,232.57 million in 2024 and is anticipated to reach USD 4,007.03 million by 2032, at a CAGR of 16.0% during the forecast period. Europe commands a market share of nearly 22% in 2024, driven by strong policy alignment with sustainability and digital transformation. The European Union’s Green Deal and Common Agricultural Policy emphasize smart farming practices and carbon-efficient agriculture. Countries like Germany, France, and the Netherlands are at the forefront of integrating AI, robotics, and IoT across farming operations. The market benefits from funding support and regulatory frameworks that promote precision agriculture and traceability. It is also seeing increased demand for advanced analytics tools that help monitor compliance and enhance productivity. Europe remains focused on building resilient and environmentally sound food systems.
Asia Pacific
The Asia Pacific Connected Agriculture Market size was valued at USD 741.00 million in 2018 to USD 1,284.76 million in 2024 and is anticipated to reach USD 4,944.05 million by 2032, at a CAGR of 18.4% during the forecast period. Asia Pacific holds a 23% share of the global market in 2024, led by rapid digitalization across key agricultural economies such as China, India, Japan, and Australia. Rising food demand, shrinking arable land, and government-backed digital farming programs contribute to strong market momentum. National policies like India’s Digital Agriculture Mission and China’s Smart Agriculture strategy fuel technology adoption. The region is experiencing growth in AI-driven irrigation, drone surveillance, and cloud-based farm solutions. It represents a high-growth frontier where connected agriculture offers transformative potential for food security and yield optimization. It continues to attract both local and international agri-tech investments.
Latin America
The Latin America Connected Agriculture Market size was valued at USD 268.30 million in 2018 to USD 440.70 million in 2024 and is anticipated to reach USD 1,441.92 million by 2032, at a CAGR of 16.1% during the forecast period. Latin America captures nearly 8% of the global market share in 2024, led by countries such as Brazil, Argentina, and Mexico. Large-scale commercial farms in the region are adopting GPS-enabled machinery, satellite mapping, and yield monitoring systems. The market is shaped by the need to increase productivity in soybean, corn, and coffee plantations. Governments and regional bodies are also promoting digital agriculture initiatives to support sustainable practices. It shows growing interest in data analytics platforms and mobile-based advisory services for smallholder farmers. Latin America holds promise as infrastructure improves and technology becomes more accessible.
Middle East
The Middle East Connected Agriculture Market size was valued at USD 148.66 million in 2018 to USD 233.02 million in 2024 and is anticipated to reach USD 741.89 million by 2032, at a CAGR of 15.7% during the forecast period. The region contributes about 4% to global market share in 2024, with countries like the UAE and Saudi Arabia investing in agri-tech to reduce food import dependency. Vertical farming, hydroponics, and climate-controlled agriculture are gaining traction in arid zones. It is leveraging IoT and automation to manage scarce water resources and improve crop productivity. Government strategies focus on food resilience and sustainability, driving innovation in desert farming technologies. Pilot projects and agribusiness investments are encouraging adoption across private farms and agri-cooperatives. The market is expanding steadily as digital solutions address environmental and resource constraints.
Africa
The Africa Connected Agriculture Market size was valued at USD 87.69 million in 2018 to USD 181.83 million in 2024 and is anticipated to reach USD 556.24 million by 2032, at a CAGR of 14.7% during the forecast period. Africa holds around 3% of the global market share in 2024, reflecting its early stage of digital agriculture adoption. Fragmented land ownership, weak infrastructure, and affordability barriers pose challenges to large-scale implementation. However, mobile connectivity and agri-tech hubs are gradually bridging the digital divide. The market is seeing growing interest in weather forecasting apps, mobile crop advisory services, and sensor-based irrigation. Governments and NGOs are rolling out digital inclusion initiatives that aim to empower smallholder farmers. It remains a key opportunity area where scalable, low-cost solutions can deliver high social and economic impact.
Shape Your Report to Specific Countries or Regions & Enjoy 30% Off!
Key Player Analysis:
- Deere & Company
- Trimble Inc.
- AGCO Corporation
- BASF SE
- Bayer AG
- Hexagon AB
- Topcon
- Sentera
- Farmers Edge Inc.
- CLAAS KGaA mbH
Competitive Analysis:
The Connected Agriculture Market features a competitive landscape defined by innovation, strategic partnerships, and regional expansion. Key players include IBM Corporation, Microsoft Corporation, Trimble Inc., Deere & Company, AG Leader Technology, Cisco Systems, and Accenture. These companies invest heavily in IoT integration, AI-based analytics, and cloud-enabled farm management solutions. It demonstrates a high level of technological advancement and product diversification, with companies offering tailored platforms for crop monitoring, supply chain traceability, and predictive analytics. Startups and regional players are also entering the market with affordable, scalable solutions to address smallholder needs. Strategic alliances between agri-tech firms and telecom providers are accelerating digital infrastructure in emerging regions. Competitive intensity remains strong, with players focusing on expanding their product portfolios and geographical presence to capture untapped market potential. It continues to evolve through constant innovation, driven by the need for sustainable, data-driven agriculture.
Recent Developments:
- In January 2025, John Deere enhanced its connected agriculture portfolio by launching an advanced autonomous tractor, integrated with AI-powered software for real-time field monitoring and automated crop management. The new product is designed to help farmers optimize resources and increase yield, reinforcing John Deere’s position as a leader in precision agriculture.
- In February 2025, AGCO Corporation announced a strategic supply agreement with SDF to strengthen its position in low- to mid-horsepower tractors for its Massey Ferguson brand. This partnership will result in SDF manufacturing proprietary tractors with up to 85 horsepower, which will be distributed globally from mid-2025. The move is designed to expand AGCO’s connected machinery portfolio and increase competitiveness in smart farm solutions.
- In April 2025, Topcon launched the CR-H1, a handheld reality capture solution using iPhone LiDAR and Pix4Dcatch integration. This device enables fast, accurate 3D data capture in the field, supporting connected agriculture with advanced GNSS positioning and data workflows. The product stems from a recent strategic cooperation agreement with Pix4D, further enhancing Topcon’s global portfolio in 3D digital workflow solutions.
- In September 2024, Trimble Inc. entered a significant partnership agreement for Platform Science to acquire its global transportation telematics business. As part of this deal, Trimble took a 32.5% stake in Platform Science. The objective is to enhance fleet mobility and offer customers broader in-cab software and solution ecosystems, ultimately driving digitalization across connected agriculture and transportation sectors.
Market Concentration & Characteristics:
The Connected Agriculture Market is moderately concentrated, with a mix of established technology giants and emerging agri-tech startups shaping the competitive environment. It features companies with strong capabilities in IoT, cloud computing, AI, and data analytics, creating a technologically advanced and innovation-driven landscape. The market reflects a high degree of specialization, with firms offering tailored solutions for crop management, livestock monitoring, and supply chain optimization. Barriers to entry remain moderate due to high initial investment and infrastructure requirements, but growing demand in emerging economies is creating space for niche players. It shows rapid technological adoption, a shift toward platform-based ecosystems, and increasing focus on interoperability across devices and services. The presence of both global and regional vendors ensures diverse offerings that cater to farms of varying scales and digital maturity.
Report Coverage:
The research report offers an in-depth analysis based on component, application, and deployment. It details leading market players, providing an overview of their business, product offerings, investments, revenue streams, and key applications. Additionally, the report includes insights into the competitive environment, SWOT analysis, current market trends, as well as the primary drivers and constraints. Furthermore, it discusses various factors that have driven market expansion in recent years. The report also explores market dynamics, regulatory scenarios, and technological advancements that are shaping the industry. It assesses the impact of external factors and global economic changes on market growth. Lastly, it provides strategic recommendations for new entrants and established companies to navigate the complexities of the market.
Future Outlook:
- Increased integration of AI and machine learning will enhance real-time decision-making in farm operations.
- Expansion of 5G and rural connectivity will improve access to cloud-based agricultural platforms.
- Demand for climate-resilient farming tools will accelerate innovation in precision agriculture solutions.
- Growth in blockchain adoption will strengthen food traceability and supply chain transparency.
- Investment in low-cost IoT devices will drive broader adoption among smallholder farmers.
- Government policies and subsidies will continue to support digital agriculture infrastructure development.
- Rise in agri-fintech collaborations will create new financing and insurance models based on farm data.
- Development of multilingual mobile platforms will improve user engagement in emerging markets.
- Increasing urban agriculture and vertical farming projects will open new markets for connected systems.
- Strategic partnerships between tech firms and agribusinesses will drive global market expansion.


