Market Overview
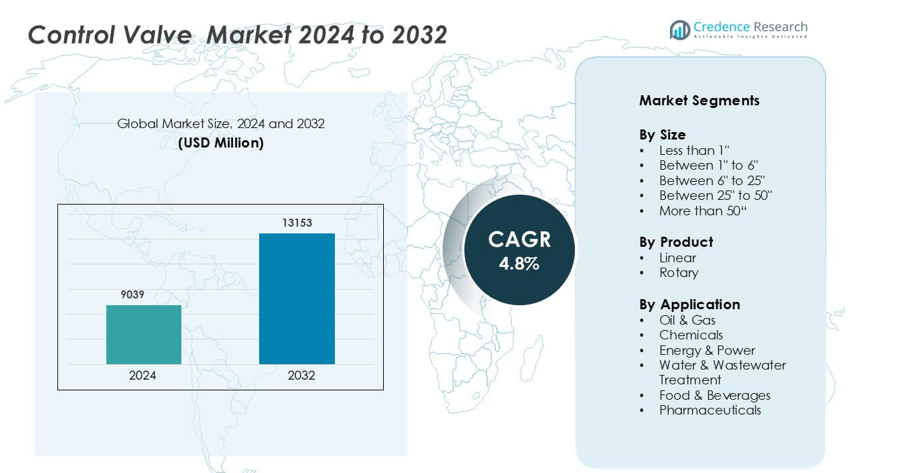
Control Valve Market was valued at USD 9039 million in 2024 and is anticipated to reach USD 13153 million by 2032, growing at a CAGR of 4.8 % during the forecast period.
| REPORT ATTRIBUTE |
DETAILS |
| Historical Period |
2020-2023 |
| Base Year |
2024 |
| Forecast Period |
2025-2032 |
| Control Valve Market Size 2024 |
USD 9039 million |
| Control Valve Market, CAGR |
4.8% |
| Control Valve Market Size 2032 |
USD 13153 million |
The control valve market is led by key players including Emerson Electric Co., Flowserve Corporation, IMI plc, Alfa Laval AB, AVK Holding A/S, Eaton, Honeywell International, Inc., Velan Inc., Burkert Fluid Control System, and Valvitalia SpA. These companies dominate through advanced product portfolios, automation integration, and global distribution networks. Emerson and Honeywell hold strong positions due to their extensive range of smart and high-precision control solutions. Regionally, Asia-Pacific leads the global market with a 34% share, driven by rapid industrialization, expanding oil and gas projects, and strong investments in power generation and water management infrastructure across China, India, and Japan.
Market Insights
- The global control valve market was valued at USD 9039 million in 2024 and is projected to reach USD 13153 million by 2032, growing at a CAGR of 4.8%.
- Rising industrial automation and increasing investments in oil, gas, and power generation sectors are driving steady demand for advanced flow control systems.
- Smart valve technologies with IoT integration and predictive maintenance capabilities are reshaping operational efficiency across key industries.
- The market is moderately competitive, with major players like Emerson, Honeywell, and Flowserve focusing on innovation and strategic expansion, while high maintenance costs remain a restraint.
- Asia-Pacific leads with a 34% share, followed by North America at 32%; linear valves dominate the product segment, holding a 58% share due to their precision and reliability in complex industrial processes.
Access crucial information at unmatched prices!
Request your sample report today & start making informed decisions powered by Credence Research Inc.!
Download Sample
Market Segmentation Analysis:
By Size
Control valves below 1 inch lead the market due to their wide adoption in precision flow applications. These compact valves are ideal for industries such as pharmaceuticals, food and beverages, and chemicals where accurate flow regulation is critical. Their ability to handle low flow rates and pressure drops enhances performance efficiency. The segment holds the largest market share as miniaturized process systems and automated equipment become more common. Rising investments in micro-process control systems and cleanroom facilities continue to strengthen demand for smaller valve sizes.
- For instance, Bürkert Fluid Control Systems does produce the Type 3360, an electromotive 2-way angle seat control valve known for high precision control in demanding and hygienic conditions, suitable for applications in the pharmaceutical industry.
By Product
Linear control valves dominate the market owing to their high accuracy, easy maintenance, and reliability in controlling pressure and flow. They are preferred in industries requiring precise control under varying pressure conditions, such as oil and gas and power generation. The segment maintains the highest market share as globe and diaphragm valves remain the standard for critical control tasks. Growing adoption of digital positioners and smart linear actuators enhances process efficiency, driving product preference across both legacy and new automated systems.
- For instance, the Fisher GX series is available in different pressure ratings, including ASME Class 150, Class 300 and PN 10, PN 16, PN 25, PN 40
By Application
The oil and gas segment leads the control valve market, accounting for the largest market share. These valves are vital in upstream, midstream, and downstream operations to regulate flow, pressure, and temperature in complex pipelines. Increasing global energy demand and ongoing refinery expansions sustain strong growth. Advanced materials and corrosion-resistant coatings further boost adoption in harsh environments. Automation in exploration and refining activities continues to expand control valve use, particularly in high-pressure and high-temperature applications worldwide.
Key Growth Drivers
Rising Demand for Industrial Automation and Process Efficiency
The growing adoption of industrial automation across sectors is a key driver for the control valve market. Automated systems rely on precise flow control to optimize process performance, reduce waste, and ensure safety. Control valves integrated with smart sensors and digital positioners enable real-time monitoring and predictive maintenance, minimizing downtime. Industries such as oil and gas, power generation, and water treatment increasingly use automated valve solutions to achieve higher accuracy and operational reliability. Manufacturers are developing advanced control valves compatible with Industrial Internet of Things (IIoT) platforms to support remote monitoring and predictive diagnostics, driving further adoption of intelligent flow control solutions in large-scale industrial plants.
- For instance, Honeywell International, Inc. developed the SmartLine Pressure Transmitter integrated with its Experion PKS control system, offering real-time diagnostics with data refresh rates of 100 milliseconds and operational uptime above 99.95%, significantly improving automated valve performance and predictive maintenance in industrial facilities.
Expansion of the Oil, Gas, and Energy Sector
The oil, gas, and energy industries remain major consumers of control valves due to their critical role in regulating fluid flow under extreme pressure and temperature conditions. Global investments in upstream exploration, refining capacity expansion, and liquefied natural gas (LNG) projects continue to strengthen market demand. The shift toward cleaner energy sources also drives the use of control valves in renewable energy systems, such as geothermal and hydrogen production facilities. Advanced valve designs with high corrosion resistance and temperature tolerance enhance operational safety and reliability. This ongoing infrastructure development, combined with the modernization of existing energy networks, reinforces the long-term growth prospects of the control valve market.
- For instance, Flowserve Corporation supplies the Valtek Mark One globe control valve, which can be engineered for applications with pressures up to 1034 bar (15,000 psi) and temperatures potentially exceeding 593°C (1100°F), depending on the specific configuration and materials.
Rising Focus on Water and Wastewater Management
Growing concerns about water scarcity and environmental sustainability have accelerated the adoption of control valves in water and wastewater treatment facilities. Governments worldwide are investing heavily in modernizing water distribution systems to improve efficiency and reduce leakage. Control valves ensure accurate pressure and flow regulation in filtration, desalination, and sewage treatment processes. Increasing urbanization and industrialization are boosting the need for effective water management infrastructure, further expanding the market. Smart control valves equipped with IoT-based monitoring help utilities achieve better control over complex distribution networks. This technological integration is promoting operational efficiency, reducing maintenance costs, and supporting global water conservation initiatives.
Key Trends & Opportunities
Integration of Smart Valve Technology and IIoT Connectivity
The integration of smart valve technology is transforming the control valve market by enabling enhanced system visibility and predictive maintenance. Manufacturers are embedding sensors and communication modules in valves to monitor performance metrics such as pressure, temperature, and vibration. These connected solutions support early fault detection and help reduce unplanned shutdowns. The growing use of digital twins and advanced data analytics allows operators to simulate valve performance and improve system design. As industries move toward Industry 4.0, the demand for intelligent, data-driven control systems continues to rise, offering significant opportunities for technology providers to develop next-generation valve management platforms.
- For instance, Emerson Electric Co. launched the Fisher FIELDVUE DVC6200 digital valve controller, equipped with 32-bit microprocessors capable of processing 500 measurements per second and supporting HART 7 communication protocols, enabling predictive diagnostics that reduce maintenance costs and extend valve life across automated process industries.
Material Innovation and Development of Corrosion-Resistant Valves
Advancements in materials and coatings are creating new opportunities in the control valve market, especially for harsh industrial environments. Manufacturers are developing valves using stainless steel, duplex alloys, and ceramic linings to enhance durability and chemical resistance. These materials extend product life and reduce maintenance frequency in sectors such as chemicals, marine, and oil refining. Innovative coatings like fluoropolymers and tungsten carbide improve erosion resistance and minimize leakage risks. This trend toward advanced materials supports the growing need for reliability and sustainability in fluid handling systems. Companies investing in R&D for specialized valve materials are expected to gain a competitive edge in demanding process applications.
- For instance, IMI plc introduced its IMI CCI DRAG valve trim technology constructed from duplex stainless steel and tungsten carbide coatings, proven to withstand pressures exceeding 690 bar and fluid velocities up to 100 meters per second, significantly improving erosion resistance and extending operational lifespan in severe service oil refining systems.
Expanding Adoption in Renewable and Green Energy Applications
The transition toward renewable energy sources is driving new opportunities for control valve manufacturers. Valves play a crucial role in biofuel processing, hydrogen storage, and geothermal energy systems by managing flow, pressure, and temperature with high precision. The rise in government-backed clean energy projects has increased demand for energy-efficient and environmentally sustainable control components. Manufacturers are focusing on developing valves that meet strict safety and emission standards while maintaining superior operational performance. As global efforts toward decarbonization accelerate, the integration of smart and durable valve solutions within renewable infrastructure offers strong long-term growth potential for the industry.
Key Challenges
High Maintenance Costs and Complex Installation Requirements
Despite their importance in process industries, control valves involve high maintenance costs and complex installation procedures that can hinder market adoption. Precision calibration, regular servicing, and material wear management add to operational expenses. In industries like oil and gas, downtime caused by valve malfunction can lead to significant revenue losses. The integration of smart systems, though beneficial, often increases setup complexity and requires skilled technicians for operation. Many end-users face challenges aligning valve designs with existing infrastructure, especially in older plants. These factors collectively raise the total cost of ownership and can delay new investments, particularly among small and medium enterprises.
Limited Standardization and Compatibility Across Valve Systems
A major challenge in the control valve market is the lack of universal standards and interoperability among valve systems and control platforms. Different manufacturers follow varied design specifications, making integration with automation systems difficult. Inconsistent compliance with international standards can lead to compatibility issues and performance inefficiencies. End-users often face challenges in replacing or upgrading components without full system redesigns. The absence of harmonized regulations also affects global trade and product certification processes. To overcome this, industry players must focus on developing standardized communication protocols and modular valve systems that ensure seamless integration and long-term operational reliability.
Regional Analysis
North America
North America holds a 32% share of the control valve market, driven by strong demand from oil and gas, power generation, and water treatment industries. The U.S. leads due to widespread adoption of automation technologies and advanced valve systems for process optimization. The region benefits from significant investments in shale gas exploration and refinery modernization. Strict safety and emission standards encourage industries to adopt high-performance, corrosion-resistant valve systems. Leading manufacturers continue to integrate smart sensors and predictive control solutions, strengthening North America’s dominance in advanced flow management and industrial automation applications.
Europe
Europe accounts for 27% of the global control valve market, supported by strong industrial automation adoption and regulatory focus on energy efficiency. Germany, the UK, and France lead due to their established manufacturing and chemical sectors. Investments in renewable energy infrastructure, such as wind and bioenergy plants, further accelerate market demand. The implementation of Industry 4.0 standards drives the need for smart and digital valve technologies. Additionally, modernization of water and wastewater facilities across the EU contributes to sustained growth, reinforcing Europe’s position as a mature yet innovation-driven regional market.
Asia-Pacific
Asia-Pacific dominates the control valve market with a 34% share, led by China, India, and Japan. Rapid industrialization, expanding energy demand, and government-led infrastructure investments drive market growth. The region experiences strong demand from oil refining, chemical processing, and water management sectors. China’s focus on smart manufacturing and India’s growing power generation capacity foster adoption of automated valve systems. Additionally, increasing investment in renewable energy and LNG terminals strengthens market prospects. Favorable industrial policies and local production initiatives further support Asia-Pacific’s position as the fastest-growing regional market for control valves.
Latin America
Latin America captures a 4% share of the global control valve market, with Brazil and Mexico leading adoption. The region’s oil, gas, and mining sectors remain the primary growth drivers, supported by modernization projects and automation upgrades. Expanding chemical and food processing industries also contribute to rising demand for durable and efficient valve systems. Government efforts to improve water management infrastructure create additional opportunities. However, budget constraints and dependence on imported components limit widespread adoption. Despite challenges, gradual technological advancements and foreign investments are helping Latin America improve its industrial control capabilities.
Middle East & Africa
The Middle East & Africa region holds a 3% share of the control valve market, primarily driven by oil and gas, power generation, and desalination projects. Countries such as Saudi Arabia, the UAE, and South Africa are investing heavily in refining, petrochemical, and water infrastructure. Growing energy diversification efforts are promoting the use of advanced control systems for process optimization. Rising urbanization and industrial expansion create steady demand for robust valve technologies. While the region still faces supply chain and cost challenges, increasing automation adoption supports long-term growth across multiple industrial sectors.
Shape Your Report to Specific Countries or Regions & Enjoy 30% Off!
Market Segmentations:
By Size
- Less than 1″
- Between 1″ to 6″
- Between 6″ to 25″
- Between 25″ to 50″
- More than 50″
By Product
By Application
- Oil & Gas
- Chemicals
- Energy & Power
- Water & Wastewater Treatment
- Food & Beverages
- Pharmaceuticals
By Geography
- North America
- Europe
- Germany
- France
- U.K.
- Italy
- Spain
- Rest of Europe
- Asia Pacific
- China
- Japan
- India
- South Korea
- South-east Asia
- Rest of Asia Pacific
- Latin America
- Brazil
- Argentina
- Rest of Latin America
- Middle East & Africa
- GCC Countries
- South Africa
- Rest of the Middle East and Africa
Competitive Landscape
The competitive landscape of the control valve market features prominent players such as AVK Holding A/S, Valvitalia SpA, Burkert Fluid Control System, IMI plc, Honeywell International, Inc., Emerson Electric Co., Velan Inc., Eaton, Flowserve Corporation, and Alfa Laval AB. These companies compete through technological innovation, strategic partnerships, and expansion into emerging markets. Leading firms focus on developing smart and automated valve solutions integrated with IoT and predictive maintenance capabilities to enhance operational efficiency. Product reliability, precision control, and energy efficiency remain core differentiation factors. Mergers, acquisitions, and regional collaborations strengthen market positions, while investments in R&D drive new product development for demanding industrial applications. With industries increasingly adopting digital control systems, market competition is intensifying among global and regional manufacturers aiming to deliver high-performance valves that meet evolving regulatory and efficiency standards.
Key Player Analysis
Recent Developments
- In June 2023, Aquana announced the launch of the Actuator Valve Serial (AVS), a new remote cutoff valve that is part of the Water IoT platform. The valve, manufactured and designed in the U.S., serves as a remote disconnect ball valve with an IP68 rating and can be integrated with any current Advanced Metering Infrastructure (AMI) platform.
- In June 2023, Honeywell International, Inc. and Fokker Services entered into a memorandum of understanding in which Honeywell authorized Fokker to fulfil its requirements as a channel partner and service center for their pre-cooler control valve (PCCV) repair & reworking services. This partnership is anticipated to offer airline operators with more options for services of component repair.
Report Coverage
The research report offers an in-depth analysis based on Size, Product, Application, and Geography. It details leading market players, providing an overview of their business, product offerings, investments, revenue streams, and key applications. Additionally, the report includes insights into the competitive environment, SWOT analysis, current market trends, as well as the primary drivers and constraints. Furthermore, it discusses various factors that have driven market expansion in recent years. The report also explores market dynamics, regulatory scenarios, and technological advancements that are shaping the industry. It assesses the impact of external factors and global economic changes on market growth. Lastly, it provides strategic recommendations for new entrants and established companies to navigate the complexities of the market.
Future Outlook
- The control valve market will continue expanding with growing industrial automation worldwide.
- Demand for smart and connected valve systems will increase across process industries.
- Oil, gas, and power sectors will remain major contributors to market growth.
- Manufacturers will focus on developing energy-efficient and corrosion-resistant valve designs.
- Integration of IoT and predictive maintenance tools will enhance system reliability.
- The Asia-Pacific region will sustain its lead, supported by rapid industrialization and infrastructure projects.
- Technological innovation and digital control integration will drive competitive differentiation.
- Stringent environmental and safety regulations will boost adoption of advanced valve solutions.
- Strategic mergers and acquisitions will accelerate global market consolidation.
- Rising investments in renewable and water treatment sectors will create new long-term opportunities.


