
Custom Procedure Packs Market Overview:
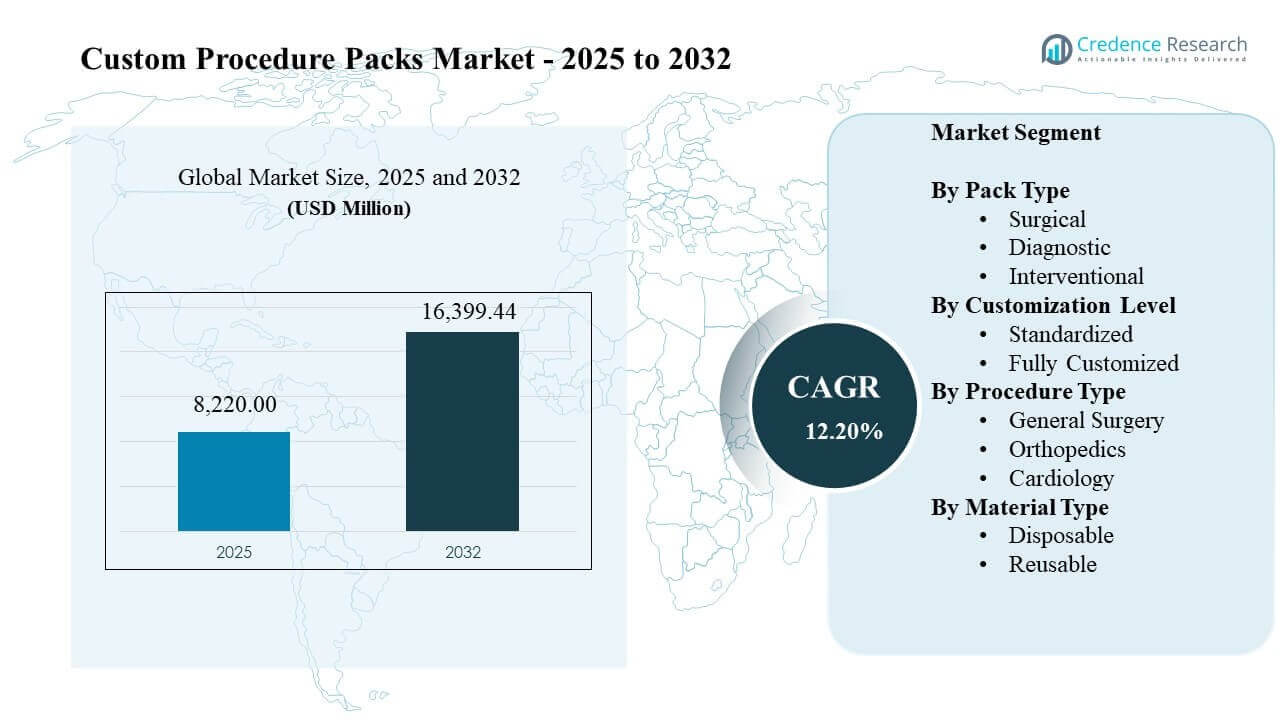
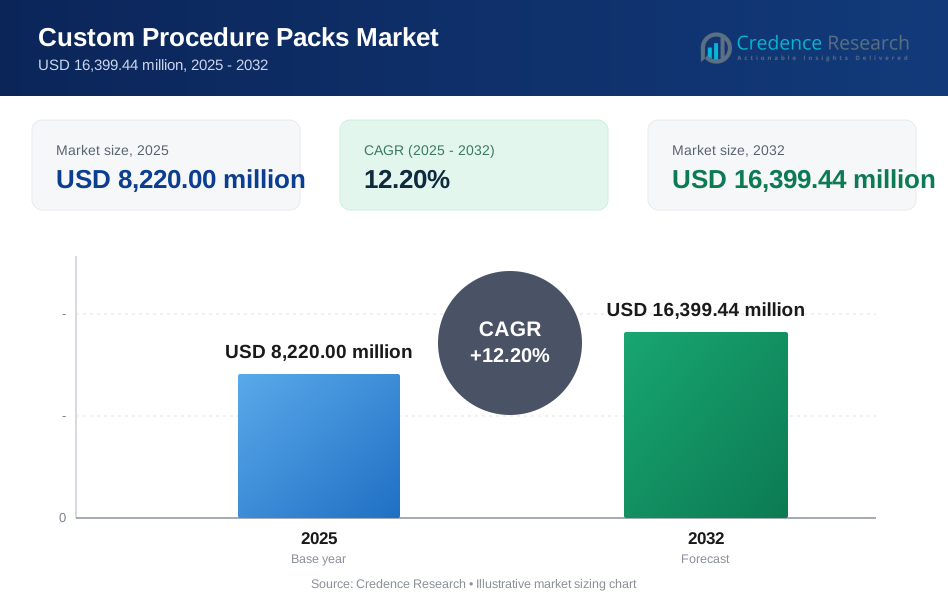
The global Custom Procedure Packs Market size was estimated at USD 8,220.00 million in 2025 and is expected to reach USD 16,399.44 million by 2032, growing at a CAGR of 12.20% from 2025 to 2032. Growth is driven by operating room standardization needs that push hospitals and ambulatory surgical centers to reduce setup variability, streamline inventory handling, and improve case readiness across high-throughput surgical schedules. North America remains the largest demand center, with broad adoption across perioperative supply chains and strong penetration of procedure-based purchasing models.
| REPORT ATTRIBUTE | DETAILS |
|---|---|
| Historical Period | 2020-2024 |
| Base Year | 2025 |
| Forecast Period | 2026-2032 |
| Custom Procedure Packs Market Size 2025 | USD 8,220.00 million |
| Custom Procedure Packs Market, CAGR | 12.20% |
| Custom Procedure Packs Market Size 2032 | USD 16,399.44 million |
Key Market Trends & Insights
- The Custom Procedure Packs Market is projected to expand at a CAGR of 12.20% during 2025–2032, supported by rising procedure volumes and workflow standardization.
- The Custom Procedure Packs Market is forecast to increase from USD 8,220.00 million (2025) to USD 16,399.44 million (2032) as kitting adoption deepens across care sites.
- Disposable accounted for the largest share of 69.60% in 2025, reflecting infection control priorities and simplified perioperative logistics.
- General Surgery held 35.80% share in 2025, supported by high case volumes and repeatable preference-card driven configurations.
- North America led with a 45.35% share in 2025, reinforced by mature supply-chain services and standardized surgical pathways.
Segment Analysis
Custom Procedure Packs Market demand is shaped by provider focus on time efficiency, consistency, and inventory simplification across surgical workflows. Pack programs reduce the number of individual pick items per case and improve standardization across teams, which supports throughput in busy perioperative environments. Supply reliability and packaging integrity remain central procurement filters, which increases the value of traceability, lot control, and standardized labeling across facilities. The Custom Procedure Packs Market also benefits from care migration toward outpatient surgery, where predictable setup and compact logistics support faster room turnover.
Customization continues to move from basic bundling toward tighter alignment with procedure-specific preference cards and clinician workflows. Standardized configurations remain attractive for high-volume pathways, and fully customized solutions gain traction in specialty procedures where variability is higher. Materials strategy remains a key purchasing lever because disposable-heavy kits prioritize sterility assurance and reduced reprocessing burden, and reusable elements appeal where sustainability goals and reprocessing capacity are strong. The Custom Procedure Packs Market maintains strong linkage to hospital purchasing groups, distributor relationships, and supplier-managed inventory models.
By Pack Type Insights
Surgical packs remain the primary demand anchor for the Custom Procedure Packs Market because surgical suites value repeatable setup and predictable component availability. Diagnostic packs benefit from protocol-led workflows that prioritize consistent consumable availability and simplified storage. Interventional packs are supported by procedure growth in cath labs and minimally invasive settings that require rapid preparation and standardized component sets. Pack type performance often depends on site-of-care mix, clinician preference variability, and the complexity of component selection.
By Customization Level Insights
Standardized solutions remain important in the Custom Procedure Packs Market because high-volume pathways prioritize repeatability, simpler forecasting, and fewer configuration changes across facilities. Fully customized solutions expand where clinician preference cards drive high variation and where health systems seek tighter alignment with specialty procedures. Procurement teams favor customization programs that reduce substitutions, improve component standardization, and maintain predictable fulfillment performance. Digital ordering tools and component traceability capabilities support wider adoption of customization in multi-site networks.
By Procedure Type Insights
General Surgery accounted for the largest share of 35.80% in 2025. General Surgery demand leads because case volumes are high and procedure steps are consistent, which supports standardized pack configurations across surgeons and facilities. Preference card discipline also improves component predictability, which increases kitting feasibility and reduces variability in case setup. Orthopedics supports pack complexity because implants, draping, and ancillary items require tight coordination with sterile workflow. Cardiology supports growth where interventional procedures expand and cath lab efficiency programs prioritize consistent preparation.
By Material Type Insights
Disposable accounted for the largest share of 69.60% in 2025. Disposable configurations lead because sterile assurance and infection control requirements remain central in perioperative pathways. Disposable-heavy packs also reduce reliance on reprocessing capacity and support faster turnover by limiting the number of items that must be cleaned and re-sterilized. Supply-chain teams favor disposable packs when standardization reduces picking errors and improves component availability per case. Reusable elements gain traction where sustainability targets, reprocessing infrastructure, and cost governance programs support broader reuse.
Custom Procedure Packs Market Drivers
Operating room efficiency and standardization priorities
Custom Procedure Packs Market growth is reinforced by provider focus on reducing setup time and minimizing variability across surgical cases. Standardized kitting supports predictable case readiness and reduces manual picking across dozens of individual SKUs. Preference-card driven pack building also supports consistent availability of core items across shifts and teams. Health systems use standardized packs to improve workflow consistency across multi-site networks and to support higher utilization of operating rooms.
Infection prevention and sterile workflow requirements
Custom Procedure Packs Market demand is supported by infection prevention policies that favor tightly controlled sterile supply handling. Procedure packs reduce touch points across components and support consistent sterile presentation at the point of use. Disposable-heavy configurations align with protocols that reduce reprocessing complexity and improve standard operating procedures. Procurement teams also prioritize packaging integrity, traceability, and lot control, which supports pack adoption across high-acuity service lines.
- For instance, HALYARD cites a study showing that 100% of wrapped trays maintained sterility versus 87% of rigid containers, highlighting the measurable value of packaging integrity in sterile workflow control.
Expansion of outpatient and ambulatory surgical care
Custom Procedure Packs Market adoption benefits from expanding ambulatory surgery capacity and growth in outpatient case volumes. Outpatient settings prioritize fast setup, compact storage, and predictable replenishment cycles that align well with procedure-based kitting. Standardized kits support consistent care delivery across rotating clinical staff and multiple rooms. Providers also use procedure packs to reduce backroom inventory complexity and align supply consumption with procedure scheduling.
- For instance, Medline reported that a 12-facility case study of comprehensive custom kitting reduced case pick time by 48%, reduced setup time by 54%, and increased space utilization by 15% to 20%.
Supply-chain modernization and inventory optimization
Custom Procedure Packs Market growth is supported by hospital efforts to streamline supply rooms and reduce waste from overstocking. Bundled kits simplify demand planning by linking consumption to procedure volume rather than individual item utilization. Pack programs also support improved charge capture and reduce the risk of missing components that disrupt case flow. Distributor services, integrated fulfillment, and vendor-managed inventory approaches reinforce pack adoption across large health systems.
Custom Procedure Packs Market Challenges
Custom Procedure Packs Market execution can be constrained by preference-card variability and frequent configuration changes that increase complexity for suppliers and providers. Component standardization can be difficult when clinician preferences differ across sites, which can lead to substitution risk and inconsistent pack performance. Tight supply availability for specific items can disrupt pack fulfillment, creating backorders that force manual picking and reduce workflow gains. Quality deviations also carry outsized operational impact because a single pack defect can delay a scheduled case.
Custom Procedure Packs Market expansion also faces challenges related to cost governance and contract alignment across stakeholders. Price pressure can intensify when procurement teams compare bundled pricing against itemized purchasing in short-term cycles. Reusable and sustainability initiatives can conflict with disposable-heavy pack designs unless programs balance infection control, reprocessing capacity, and waste targets. Complex regulatory and documentation requirements for labeling, traceability, and lot control can increase compliance overhead for pack programs.
- For instance, Mölnlycke reported that European hospitals using ProcedurePak trays achieved 40% to 55% time savings, and Coxa Hospital in Finland increased procedures by 17% after redesigning two existing trays into four color-coded trays for easier stock management, showing how structured pack configuration and documented tray redesign can improve control when clinical, procurement, and operational requirements must be aligned.
Custom Procedure Packs Market Trends and Opportunities
Custom Procedure Packs Market opportunities are expanding through digitized ordering and configuration management that improves pack accuracy and reduces change-order friction. Health systems increasingly standardize item formularies across facilities, which supports wider deployment of standardized pack templates and stronger forecasting. Procedure packs also benefit from greater integration with hospital ERP and inventory tools that improve replenishment timing and consumption visibility. These capabilities help providers link pack demand to surgery schedules and reduce stocking variability.
- For instance, Medline’s MedPack App enables clinicians to customize and manage pack inventory in real time, and Medline also reports that one 47-component sterile procedure tray configuration eliminated 220,800 touchpoints over one year based on 480 surgeries.
Custom Procedure Packs Market growth is also supported by sustainability-driven redesign of pack components and packaging formats. Providers and suppliers are evaluating material reductions, right-sizing, and selective reusable components where reprocessing capacity is reliable. Vendor programs that offer optimization services and waste audits can strengthen long-term pack adoption. Demand is also rising for procedure-specific kits tailored to outpatient pathways, where consistent setup supports faster room turnover and staff efficiency.
Regional Insights
North America
North America held a 45.35% share in 2025, supported by mature hospital procurement structures and broad adoption of standardized perioperative workflows. The Custom Procedure Packs Market benefits from high surgical throughput and strong reliance on distributor-led supply services. Large health systems emphasize preference-card alignment and multi-site standardization, which supports higher penetration of pack programs. Ambulatory surgery growth strengthens demand for predictable kit-based replenishment.
Europe
Europe captured 23.10% share in 2025, supported by strong hospital infrastructure and standardized surgical protocols across major health systems. The Custom Procedure Packs Market in Europe is influenced by structured procurement processes that emphasize compliance, traceability, and cost governance. Standardization programs in large hospital networks support stable adoption of packs, particularly for repeatable pathways. Supplier performance often differentiates through fulfillment reliability and configuration management.
Asia Pacific
Asia Pacific accounted for 21.80% share in 2025, supported by expanding surgical capacity and hospital modernization in major markets. The Custom Procedure Packs Market benefits from increasing adoption of standardized perioperative processes in urban tertiary centers. Procurement maturation and supply-chain digitization improve the feasibility of pack programs across multi-site providers. Outpatient care expansion supports demand for streamlined kitting aligned to procedure schedules.
Latin America
Latin America held 5.90% share in 2025, with demand concentrated in private hospital groups and higher-capability urban centers. The Custom Procedure Packs Market growth depends on improvements in supply consistency, broader standardization of surgical pathways, and distributor reach. Budget constraints and variable purchasing structures can slow pack penetration in public systems. Pack programs advance fastest where providers prioritize predictable setup and inventory simplification.
Middle East & Africa
Middle East & Africa represented 3.85% share in 2025, driven by investment in tertiary hospitals and surgical service expansion in select markets. The Custom Procedure Packs Market demand concentrates where procurement modernization and standardized perioperative pathways are advancing. Adoption grows where providers seek consistent sterile readiness and improved operating room throughput. Variation in infrastructure and supply availability can limit broader regional penetration.
Competitive Landscape
Custom Procedure Packs Market competition is shaped by the ability to deliver reliable fulfillment, configuration accuracy, and scalable customization programs across multi-site provider networks. Suppliers differentiate through component breadth, quality systems, packaging integrity, and support services that optimize preference cards and reduce variation. Distributor reach and medical-surgical category depth remain important for contracting and supply assurance. Operational performance, defect control, and rapid response to configuration changes are key competitive levers.
Mölnlycke focuses on procedure pack programs that align with perioperative workflow needs, emphasizing consistent sterile presentation and pack configuration discipline across surgical environments. Mölnlycke supports hospital efficiency initiatives through standardized pack design and component rationalization that reduces setup variability. Mölnlycke pack programs typically compete on quality controls, configuration reliability, and workflow-focused service support. Mölnlycke positioning aligns with health systems seeking repeatable processes across operating rooms and procedure suites.
The industry research and growth report includes detailed analyses of the competitive landscape of the market and information about key companies, including:
- Mölnlycke
- Medline Industries
- Cardinal Health
- Owens & Minor
- 3M
- Halyard Health
- STERIS
- B. Braun
- Hartmann Group
- Paul Hartmann
Qualitative and quantitative analysis of companies has been conducted to help clients understand the wider business environment as well as the strengths and weaknesses of key industry players. Data is qualitatively analyzed to categorize companies as pure play, category-focused, industry-focused, and diversified; it is quantitatively analyzed to categorize companies as dominant, leading, strong, tentative, and weak.
Recent Developments
- In April 2025, Lohmann & Rauscher Group announced the acquisition of Unisurge International Ltd., with the deal effective from March 31, 2025. Unisurge is a UK manufacturer and supplier of Custom Procedure Packs, and the acquisition strengthens L&R’s position in the UK hospital and European OR products market.
Report Scope
| Report Attribute | Details |
| Market size value in 2025 | USD 8,220.00 million |
| Revenue forecast in 2032 | USD 16,399.44 million |
| Growth rate (CAGR) | 12.20% (2025–2032) |
| Base year | 2025 |
| Forecast period | 2026-2032 |
| Quantitative units | USD million |
| Segments covered | By Pack Type Outlook: Surgical, Diagnostic, Interventional; By Customization Level Outlook: Standardized, Fully Customized; By Procedure Type Outlook: General Surgery, Orthopedics, Cardiology; By Material Type Outlook: Disposable, Reusable |
| Regional scope | North America, Europe, Asia Pacific, Latin America, Middle East & Africa |
| Key companies profiled | Mölnlycke, Medline Industries, Cardinal Health, Owens & Minor, 3M, Halyard Health, STERIS, B. Braun, Hartmann Group, Paul Hartmann |
| No. of Pages | 328 |
Segmentation
By Pack Type
- Surgical
- Diagnostic
- Interventional
By Customization Level
- Standardized
- Fully Customized
By Procedure Type
- General Surgery
- Orthopedics
- Cardiology
By Material Type
- Disposable
- Reusable
By Region
- North America
- U.S.
- Canada
- Mexico
- Europe
- Germany
- France
- U.K.
- Italy
- Spain
- Rest of Europe
- Asia Pacific
- China
- Japan
- India
- South Korea
- South-east Asia
- Rest of Asia Pacific
- Latin America
- Brazil
- Argentina
- Rest of Latin America
- Middle East & Africa
- GCC Countries
- South Africa
- Rest of the Middle East and Africa
Request a Free Sample
Fill in your details and we'll send you a free sample report.
- Sample data tables & charts
- Research methodology
Need a Custom Version of This Report?
Tailor the scope, geography, or segments to your exact requirements.
- Custom geography or segment scope
- Direct access to our analyst team
Frequently Asked Questions
What is the current size of the Custom Procedure Packs Market and what is the forecast size?
What is the CAGR for the Custom Procedure Packs Market during 2025–2032?
What is the largest segment in the Custom Procedure Packs Market?
What factors are driving growth in the Custom Procedure Packs Market?
Which companies are leading in the Custom Procedure Packs Market?
Which region leads the Custom Procedure Packs Market?
Table of Content
Chapter 1. Report Introduction
- 1.1 Report Description & Purpose
- 1.1.1 Report Title & Market Definition
- 1.1.2 Unique Selling Propositions (USP) & Key Differentiators
- 1.1.3 Value Proposition for Stakeholders
- 1.2 Research Objectives
- 1.2.1 Market Sizing Objectives (Volume & Revenue)
- 1.2.2 Segmentation Objectives
- 1.2.3 Competitive Intelligence Objectives
- 1.2.4 Forecast & Scenario Objectives
- 1.3 Report Scope
- 1.3.1 Custom Procedure Packs Scope – Types & Subtypes Covered
- 1.3.2 Geographic Scope – Regions & Countries Covered
- 1.3.3 Historical Period, Base Year & Forecast Period (2025; forecast to 2032)
- 1.3.4 Inclusions & Exclusions
- 1.4 HS Code & Classification Framework
- 1.5 Currency, Units & Pricing Basis
- 1.6 Target Stakeholders
- 1.7 Limitations & Assumptions
Chapter 2. Executive Summary
- 2.1 Global Custom Procedure Packs Market Snapshot
- 2.1.1 Market Size – Historical (2025) & Forecast (2025-2032) (2025: USD 8,220.00 million → 2032: USD 16,399.44 million)
- 2.1.2 Volume & Revenue – Global Totals
- 2.1.3 Key Market Highlights – Top Five Facts
- 2.2 Custom Procedure Packs Market Segmentation Snapshot
- 2.2.1 Market Split by Region – 2025 vs. 2032
- 2.3 Competitive Snapshot
- 2.3.1 Top 10 Players by Revenue Share – 2025
- 2.3.2 Top 10 Players by Volume Share – 2025
- 2.3.3 Recent Strategic Developments (18-Month Summary)
- 2.4 Key Investment Highlights & Strategic Conclusions
Chapter 3. Custom Procedure Packs Market Dynamics & Industry Analysis
- 3.1 Market Overview & Context
- 3.1.1 Custom Procedure Packs Market Position in the Broader Automotive Value Chain
- 3.1.2 OEM vs. Replacement Market Dynamics
- 3.1.3 Market Maturity & Development Stage by Region
- 3.2 Custom Procedure Packs Market Drivers
- 3.3 Custom Procedure Packs Market Restraints & Challenges
- 3.4 Custom Procedure Packs Market Opportunities
- 3.5 Porter's Five Forces Analysis
- 3.5.1 Threat of New Entrants
- 3.5.2 Bargaining Power of Suppliers
- 3.5.3 Bargaining Power of Buyers
- 3.5.4 Threat of Substitutes
- 3.5.5 Competitive Rivalry – Intensity Assessment
- 3.6 Custom Procedure Packs Value Chain Analysis
- 3.6.1 Upstream – Raw Material/Input Suppliers
- 3.6.1.1 Raw Material/Input 1
- 3.6.1.2 Raw Material/Input 2
- 3.6.1.3 Raw Material/Input 3
- 3.6.2 Midstream – Production/Manufacturing/Service Delivery
- 3.6.2.1 Production/Process Overview
- 3.6.2.2 Key Facility Locations & Capacity by Manufacturer
- 3.6.3 Downstream – Distribution & End Consumer
- 3.6.3.1 Primary Channel – B2B/OEM
- 3.6.3.2 Secondary Channels – Dealer, Retail, Online, Direct
- 3.6.4 Value Chain Profitability Analysis
- 3.6.1 Upstream – Raw Material/Input Suppliers
- 3.7 PESTEL Analysis
- 3.7.1 Political Factors
- 3.7.2 Economic Factors
- 3.7.3 Social Factors
- 3.7.4 Technological Factors
- 3.7.5 Environmental Factors
- 3.7.6 Legal Factors
- 3.8 Custom Procedure Packs Supply Chain Analysis
- 3.8.1 Raw Material/Input Supply Risk Assessment
- 3.8.2 Manufacturing Concentration Risk (Geographic Exposure)
- 3.8.3 Trade Disruption Impact Analysis
- 3.9 Regulatory & Policy Landscape
Note: The regulatory and policy landscape section covers regulations based on their applicability to the market, Custom Procedure Packs category, geography, and scope of the study. Only regulatory frameworks with a material impact on operations, compliance, trade, sustainability, or market access are analyzed in detail.
Chapter 4. Key Investment Pockets & Opportunity Analysis
- 4.1 Custom Procedure Packs Market Attractiveness Analysis
- 4.1.1 By Region – Investment Attractiveness Matrix (Volume × CAGR)
- 4.2 Absolute Revenue Growth Opportunity
- 4.2.1 By Region – Absolute USD Growth Through 2032
- 4.3 Incremental Volume Opportunity
- 4.3.1 By Region – Incremental Volume Through 2032
- 4.3.2 Segment – Incremental Volume
- 4.4 Emerging Submarket Opportunity Deep Dive (Subject to Applicability)
- 4.5 Emerging Market Opportunity Scorecards
- 4.5.1 United States
- 4.5.2 Europe
- 4.5.3 Asia
- 4.5.4 Middle East & Africa
Note: Emerging Market Opportunity Scorecards will be included based on relevance and strategic importance. Regions listed are indicative and may vary depending on data availability and market dynamics.
Chapter 5. Custom Procedure Packs Import-Export Analysis & Trade Flows
- 5.1 Global Trade Overview
- 5.1.1 Global Export Value by Country (2025)
- 5.1.2 Global Export Volume by Country (2025)
- 5.1.3 Global Import Value by Country (2025)
- 5.1.4 Global Import Volume by Country (2025)
- 5.1.5 Net Trade Balance by Country (2025)
- 5.2 Export Analysis – Segment
- 5.2.1 Type 1 (HS Code)
- 5.2.2 Type 2 (HS Code)
- 5.2.3 Type 3 (HS Code)
- 5.2.4 Type 4 (HS Code)
- 5.2.5 Type 5 (HS Code)
- 5.3 Import Analysis – Segment
- 5.3.1 Type 1 (HS Code)
- 5.3.2 Type 2 (HS Code)
- 5.3.3 Type 3 (HS Code)
- 5.3.4 Type 4 (HS Code)
- 5.3.5 Type 5 (HS Code)
- 5.4 Average Unit Trade Prices
- 5.4.1 Average Export Price – Segment & Country
- 5.4.2 Average Import Price – Segment & Source Country
- 5.4.3 Price Trends (2025)
- 5.5 Key Trade Route Analysis
- 5.5.1 Trade Route 1
- 5.5.2 Trade Route 2
- 5.5.3 Trade Route 3
- 5.5.4 Trade Route 4
- 5.5.5 Trade Route 5
- 5.6 Trade Policy Impact Assessment
- 5.6.1 US Anti-Dumping & Section 301 Tariffs
- 5.6.2 EU Customs Union Impact
- 5.6.3 Major Free Trade Agreements
- 5.6.4 USMCA Rules of Origin
Note: Trade policy analysis will be included only where relevant to the Custom Procedure Packs market.
Chapter 6. Competitive Landscape & Company Benchmarking
- 6.1 Custom Procedure Packs Market Concentration & Structure
- 6.1.1 Herfindahl-Hirschman Index (HHI) – vs. 2025
- 6.1.2 Tier 1, Tier 2 & Tier 3 Market Structure
- 6.1.3 Global, Regional & Local Player Dynamics
- 6.2 Custom Procedure Packs Market Share Analysis – 2025
- 6.2.1 Global Revenue Share by Company
- 6.2.2 Global Volume Share by Company
- 6.2.3 Regional Revenue Share
- 6.2.4 Market Share Evolution ( vs. 2025)
- 6.2.5 OEM Segment Share by Company
- 6.2.6 Replacement Segment Share by Company
- 6.3 Production/Delivery Capacity & Facility Analysis
- 6.3.1 Global Installed Capacity
- 6.3.2 Capacity Utilization Rates
- 6.3.3 Production/Output Volume
- 6.3.4 Facility Locations & Capacity Map
- 6.3.5 Planned Capacity Additions
- 6.4 Custom Procedure Packs Competitive Benchmarking Matrix
- 6.4.1 Revenue, Volume, CAGR & Profitability Comparison
- 6.4.2 Channel Revenue Mix
- 6.4.3 Geographic Revenue Exposure
- 6.4.4 R&D Intensity
- 6.4.5 Sustainability Maturity
- 6.5 Strategic Developments in Custom Procedure Packs (Last 24 Months)
- 6.5.1 Mergers, Acquisitions & Divestments
- 6.5.2 New Custom Procedure Packs Launches
- 6.5.3 Facility Expansions
- 6.5.4 Strategic Alliances, Joint Ventures & Partnerships
- 6.5.5 Distribution Expansion & Market Entry
- 6.5.6 Sustainability & ESG Initiatives
- 6.6 Competitive Strategy Mapping
- 6.6.1 Leader, Challenger, Follower & Niche Classification
- 6.6.2 Pricing Strategy Comparison
- 6.6.3 Channel Strategy Matrix
Note: Strategic developments are included based on their materiality and the availability of reliable information.
Chapter 7. Global Custom Procedure Packs Market – By Distribution Channel
- 7.1 Segment Overview
- 7.1.1 Volume & Revenue Split by Channel (2025 & 2032)
- 7.1.2 Channel Mix Evolution (2025-2032)
Chapter 8. Regional Market Analysis – Global Overview
- 8.1 Global Regional Overview
- 8.1.1 Regional Volume Share
- 8.1.2 Regional Revenue Share
- 8.1.3 Regional Volume by Region
- 8.1.4 Regional Revenue by Region
- 8.1.5 Regional Forecast Through 2032
- 8.2 Cross-Regional Segment Analysis
- 8.2.1 By Distribution Channel
- 8.2.2 By Brand/Price Tier
Chapter 9. North America Custom Procedure Packs Market
- 9.1 United States
- 9.2 Canada
- 9.3 Mexico
Chapter 10. Europe Custom Procedure Packs Market
- 10.1 Germany
- 10.2 France
- 10.3 Italy
- 10.4 United Kingdom
- 10.5 Spain
- 10.6 Poland
- 10.7 Russia
- 10.8 Netherlands
- 10.9 Belgium
- 10.10 Sweden
- 10.11 Denmark
- 10.12 Norway
- 10.13 Rest of Europe
Chapter 11. Asia Pacific Custom Procedure Packs Market
- 11.1 China
- 11.2 India
- 11.3 Japan
- 11.4 South Korea
- 11.5 Thailand
- 11.6 Indonesia
- 11.7 Vietnam
- 11.8 Malaysia
- 11.9 Australia
- 11.10 Rest of Asia Pacific
Chapter 12. Latin America Custom Procedure Packs Market
- 12.1 Brazil
- 12.2 Argentina
- 12.3 Colombia
- 12.4 Chile
- 12.5 Rest of Latin America
Chapter 13. Middle East Custom Procedure Packs Market
- 13.1 Saudi Arabia
- 13.2 United Arab Emirates
- 13.3 Turkey
- 13.4 Israel
- 13.5 Iran
- 13.6 Rest of the Middle East
Chapter 14. Africa Custom Procedure Packs Market
- 14.1 South Africa
- 14.2 Egypt
- 14.3 Nigeria
- 14.4 Morocco
- 14.5 Rest of Africa
Chapter 15. Custom Procedure Packs Company Profiles
- 15.1 [Company 01]
- 15.1.1 Company Overview
- 15.1.2 Key Management Personnel
- 15.1.3 Products & Services Portfolio
- 15.1.4 Financial Performance
- 15.1.5 Key Market Focus & Geographic Presence
- 15.1.6 Recent Developments & Strategic Initiatives
Note: The company profile list is preliminary and may change based on research findings, market developments, data availability, and client requirements.
Chapter 16. Appendices
- Appendix A – List of Abbreviations & Acronyms
- Appendix B – Industry Classification Code Reference – Full Series
- Appendix C – Production & Capacity Data Tables
- Appendix D – End-Use & Demand Base Tables
- Appendix E – Consumption & Replacement Rate Assumptions
- Appendix F – ASP Reference Tables
- Appendix G – Manufacturing & Facility Database
- Appendix H – Import-Export Data Tables
- Appendix I – Regulatory Summary Tables
- Appendix J – Primary Research Participant List (Anonymized)
- Appendix K – Primary Research Questionnaire Framework
- Appendix L – Data Sources & Bibliography
- Appendix M – Market Size Divergence & Source Comparison
Chapter 17. Research Methodology
- 17.1 Research Framework & Philosophy
- 17.2 Secondary Research – Sources, Hierarchy & Data Extraction
- 17.3 Data Modeling – Bottom-Up & Top-Down Market Sizing
- 17.4 Primary Research – Stakeholder Framework, LOI & Sample Sizes
- 17.5 Forecast Methodology – Regression, Scenario & Sensitivity Analysis
- 17.6 Quality Control – Four-Layer Validation Framework
- 17.7 Limitations & Standard Assumptions
- 17.8 Disclaimer
