
Diabetic Meal Delivery Services Market Overview:
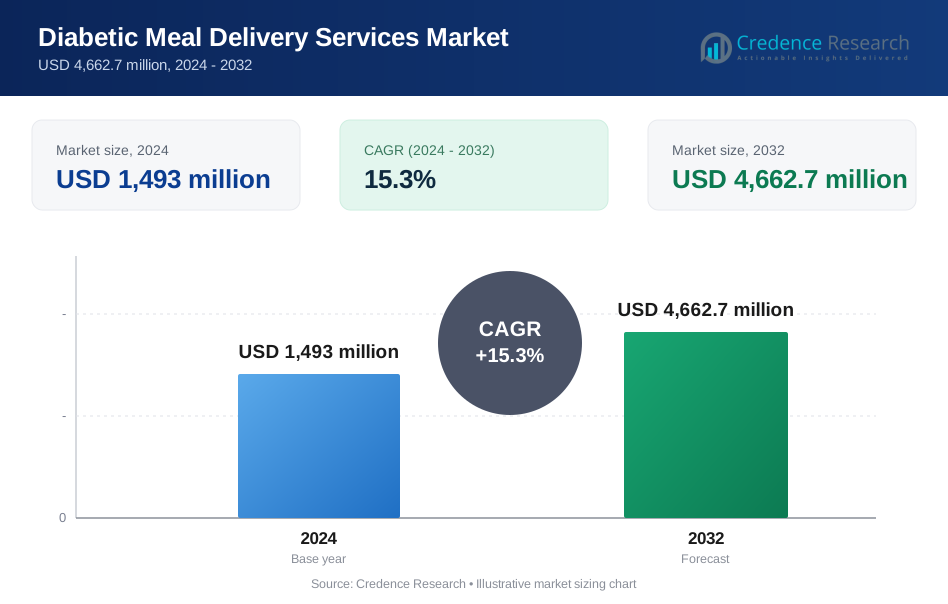
The diabetic meal delivery services market was valued at USD 1,493 million in 2024 and is projected to reach USD 4,662.7 million by 2032, expanding at a compound annual growth rate (CAGR) of 15.3% during the forecast period.
| REPORT ATTRIBUTE | DETAILS |
|---|---|
| Historical Period | 2020-2023 |
| Base Year | 2024 |
| Forecast Period | 2025-2032 |
| Diabetic Meal Delivery Services Market Size 2024 | USD 1,493 million |
| Diabetic Meal Delivery Services Market, CAGR | 15.3% |
| Diabetic Meal Delivery Services Market Size 2032 | USD 4,662.7 million |
Diabetic Meal Delivery Services Market Insights
- Market growth is primarily driven by the rising global prevalence of diabetes, increasing awareness of diet-led disease management, and growing reliance on convenient, portion-controlled meal solutions among working-age and elderly populations.
- Key trends include increasing personalization of meal plans, digital subscription adoption, and integration with wellness and preventive healthcare programs, with the Below 60 Years Old application segment and Cooked Meals type collectively accounting for the dominant share of demand.
- The competitive landscape is moderately fragmented, with leading players competing on nutrition accuracy, menu variety, subscription flexibility, and service coverage, while regional players focus on localized menus and cost competitiveness.
- Regionally, North America holds about 42% market share, followed by Europe (~27%), Asia Pacific (~20%), Latin America (~6%), and Middle East & Africa (~5%), reflecting differences in diabetes prevalence, digital adoption, and healthcare infrastructure.
Diabetic Meal Delivery Services Market Segmentation Analysis:
By Application:
By application, the Below 60 Years Old segment holds the dominant share of the diabetic meal delivery services market, driven by the high prevalence of lifestyle-related Type 2 diabetes among working-age adults and strong adoption of digital subscription platforms. This group prioritizes convenience, portion-controlled meals, and consistent carbohydrate management that aligns with active routines and preventive healthcare goals. The Above 60 Years Old segment represents a significant but smaller share, supported by an aging diabetic population, physician-recommended nutrition, and caregiver-assisted meal planning. However, adoption is comparatively moderated by dependence on family support and institutional care settings.
- For instance, Nutrisystem D structures its diabetes-focused plans around 1,200-1,500 kilocalories per day, with individual entrées typically delivering 30-45 grams of carbohydrates per meal, supported by digital tracking tools that log daily intake and adherence.
By Type:
By type, Cooked Meal offerings account for the dominant market share due to their ready-to-eat convenience, standardized nutritional profiles, and suitability for consistent glycemic control. These meals appeal strongly to elderly consumers and time-constrained individuals seeking minimal preparation and reliable dietary outcomes. Service providers emphasize chef-prepared menus aligned with diabetic dietary guidelines, reinforcing demand. The Uncooked segment, while smaller, is driven by younger, health-conscious consumers who prefer cooking flexibility, ingredient transparency, and customization, supporting diabetes management through controlled home preparation and lifestyle-focused nutrition choices.
- For instance, Mom’s Meals produces diabetes-appropriate cooked meals in centralized facilities with each entrée typically formulated within a 300–600 kilocalorie range and designed to deliver balanced carbohydrate distribution per serving, and the company has publicly disclosed an operational capacity exceeding 30 million medically tailored meals per year, underscoring scalability in ready-to-eat diabetic nutrition.
Key Growth Driver
Rising Global Prevalence of Diabetes
The increasing prevalence of diabetes remains a primary growth driver for diabetic meal delivery services. Sedentary lifestyles, urbanization, dietary shifts toward processed foods, and rising obesity rates have accelerated the incidence of Type 2 diabetes across both developed and emerging economies. As diabetes management increasingly emphasizes nutrition as a frontline intervention, demand for structured, portion-controlled meal solutions continues to rise. Diabetic meal delivery services directly address the need for consistent carbohydrate intake, balanced macronutrients, and calorie regulation, reducing the burden of daily meal planning. Healthcare providers and caregivers increasingly recommend medically aligned meal services to improve adherence and long-term glycemic outcomes. This sustained growth in the diabetic population, including younger age groups, creates a stable and expanding consumer base for specialized meal delivery providers.
- For instance, Diet-to-Go structures its diabetes-friendly programs around daily plans typically delivering 1,200-1,600 kilocalories, with clearly portioned breakfasts, lunches, and dinners designed to standardize intake.
Shift Toward Preventive and Lifestyle-Based Healthcare
A growing focus on preventive healthcare and lifestyle-based disease management significantly supports market expansion. Consumers are increasingly proactive in managing chronic conditions through diet rather than relying solely on medication. Diabetic meal delivery services align closely with this shift by offering nutrition-led solutions that support blood glucose control, weight management, and cardiovascular health. Employers, insurers, and wellness programs are also integrating nutrition services into chronic care initiatives to reduce long-term healthcare costs. This broader acceptance of food-as-medicine approaches strengthens adoption among newly diagnosed patients and prediabetic individuals. As awareness of nutrition’s role in diabetes prevention and control grows, meal delivery services positioned as part of holistic care models gain stronger traction.
- For instance, Sun Basket supports lifestyle-driven disease prevention by offering diabetes-friendly meal kits with published nutrition labels, many recipes formulated between 400 and 800 kilocalories per serving, paired with ingredient transparency that supports informed dietary choices.
Convenience and Digital Subscription Adoption
The rapid adoption of digital platforms and subscription-based food services is another critical growth driver. Consumers increasingly prefer app-based ordering, flexible subscriptions, and home delivery for managing daily dietary needs. Diabetic meal delivery services benefit from this shift by offering customizable plans, automated renewals, and integrated nutrition tracking. For working professionals and elderly users alike, these services reduce time spent on meal preparation while ensuring dietary compliance. The convenience factor is especially compelling for long-term disease management, where consistency is essential. Integration with wearable devices and digital health platforms further enhances user engagement, reinforcing recurring demand and improving customer retention.
Key Trend & Opportunity
Personalization and Nutrition Customization
Personalization has emerged as a key trend and growth opportunity within diabetic meal delivery services. Consumers increasingly expect meal plans tailored to individual glycemic responses, calorie needs, cultural preferences, and comorbid conditions such as hypertension or cholesterol disorders. Providers are responding by offering flexible menus, adjustable macronutrient profiles, and condition-specific meal plans. Advances in data analytics and nutrition science enable more precise personalization, enhancing perceived value and adherence. This trend creates opportunities for premium offerings and long-term subscriptions, particularly among tech-savvy and health-conscious users seeking outcomes-driven nutrition solutions.
- For instance, Blue Apron supports customization through its digital platform by allowing users to choose from 70+ weekly recipe choices across health-forward categories, with full nutritional breakdowns per serving, enabling subscribers managing diabetes to align meal selection with individualized dietary targets and lifestyle preferences.
Integration with Healthcare and Insurance Ecosystems
Partnerships with healthcare providers, hospitals, and insurers represent a significant opportunity for market expansion. Diabetic meal delivery services are increasingly positioned as adjuncts to clinical care, supporting post-diagnosis nutrition, discharge planning, and chronic disease programs. Integration into insurance-covered wellness initiatives improves affordability and credibility while expanding reach among older and high-risk populations. This trend strengthens trust, accelerates adoption, and supports scalable institutional contracts beyond direct-to-consumer models.
- For instance, Magic Kitchen supplies medically tailored, diabetes-appropriate meals to healthcare systems and senior-care organizations, producing prepared meals typically formulated in the 300-600 kilocalorie per meal range and supporting large-volume fulfillment for care-transition and home-health programs.
Key Challenge
Cost Sensitivity and Affordability Constraints
Despite strong demand, cost sensitivity remains a major challenge for diabetic meal delivery services. Medically tailored meals often carry premium pricing due to specialized ingredients, nutrition expertise, and logistics requirements. This limits adoption among lower-income and uninsured diabetic populations, particularly in price-sensitive markets. Long-term subscription commitments may also deter consumers who perceive these services as discretionary rather than essential. Balancing nutritional quality with cost efficiency remains a critical operational challenge for providers seeking broader market penetration.
Taste Preferences and Long-Term Adherence
Maintaining long-term customer adherence poses another significant challenge. While nutritional compliance is essential, repetitive menus or perceived compromises in taste can lead to subscription fatigue. Diabetic consumers often seek variety, cultural relevance, and enjoyable eating experiences alongside clinical benefits. Failure to balance medical requirements with culinary appeal can increase churn rates. Providers must continuously innovate menus and enhance flavor profiles while maintaining strict dietary standards to sustain long-term engagement and customer loyalty.
Regional Analysis
North America:
North America holds the largest share of the diabetic meal delivery services market, accounting for approximately 42% of global revenue. The region’s dominance is driven by a high prevalence of diabetes, strong consumer awareness of nutrition-based disease management, and widespread adoption of subscription-based meal services. Advanced digital infrastructure, high disposable income, and strong penetration of app-based food delivery platforms further support market expansion. Additionally, growing collaboration between meal service providers, healthcare systems, and insurers enhances credibility and repeat adoption. The United States leads regional demand, supported by employer wellness programs and increasing physician endorsement of medically tailored meals.
Europe:
Europe represents around 27% of the global market share, supported by rising diabetes incidence and strong public health emphasis on preventive nutrition. Countries such as the UK, Germany, and France drive adoption through growing demand for portion-controlled, low-glycemic meals aligned with clinical dietary guidelines. Consumers in Europe show high acceptance of subscription meal services focused on clean labels, ingredient transparency, and balanced nutrition. Government-backed healthcare systems and dietitian-led recommendations further reinforce adoption, particularly among elderly populations. However, market growth remains moderately paced due to price sensitivity and strong home-cooking traditions in certain countries.
Asia Pacific:
Asia Pacific accounts for approximately 20% of the global market share and represents the fastest-growing regional segment. Rapid urbanization, rising middle-class populations, and increasing prevalence of Type 2 diabetes across countries such as China, India, and Japan are key drivers. Busy urban lifestyles and growing smartphone penetration support adoption of digital meal delivery platforms. Consumers increasingly seek culturally adapted diabetic meals that balance traditional flavors with nutritional compliance. While awareness and affordability challenges persist in developing markets, expanding health consciousness and private healthcare spending continue to accelerate demand across the region.
Latin America:
Latin America holds about 6% of the global market share, supported by rising diabetes prevalence and gradual adoption of specialized nutrition services. Brazil and Mexico are the primary contributors, driven by urban population growth and increasing exposure to digital food delivery platforms. Demand is strongest among middle-income urban consumers seeking convenient dietary management solutions. However, limited awareness of medically tailored meal programs and price sensitivity constrain wider adoption. Market growth is supported by improving healthcare access, rising preventive health awareness, and increasing availability of localized diabetic meal offerings.
Middle East & Africa:
The Middle East & Africa region accounts for approximately 5% of global market share, with growth driven by high diabetes prevalence, particularly in Gulf Cooperation Council (GCC) countries. Rising lifestyle-related diabetes, increasing healthcare investments, and growing demand for convenience-based nutrition solutions support adoption. Urban centers show stronger uptake of diabetic meal delivery services, particularly among expatriate populations and higher-income consumers. However, limited service availability, logistical challenges, and lower awareness in parts of Africa restrict broader market penetration. Gradual expansion of digital food platforms is expected to support steady regional growth.
Diabetic Meal Delivery Services Market Segmentations:
By Application
- Below 60 Years Old
- Above 60 Years Old
By Type
- Cooked Meal
- Uncooked
By Geography
- North America
- U.S.
- Canada
- Mexico
- Europe
- Germany
- France
- U.K.
- Italy
- Spain
- Rest of Europe
- Asia Pacific
- China
- Japan
- India
- South Korea
- South-east Asia
- Rest of Asia Pacific
- Latin America
- Brazil
- Argentina
- Rest of Latin America
- Middle East & Africa
- GCC Countries
- South Africa
- Rest of the Middle East and Africa
Competitive Landscape
The competitive landscape of the diabetic meal delivery services market is characterized by a mix of specialized medical nutrition providers, health-focused meal kit companies, and digital food delivery platforms expanding into condition-specific offerings. Key players compete on nutritional accuracy, menu personalization, subscription flexibility, and geographic coverage. Companies increasingly differentiate through dietitian-designed meal plans, low-glycemic formulations, and integration with digital health tools that support glucose monitoring and dietary tracking. Strategic partnerships with healthcare providers, insurers, and corporate wellness programs are strengthening credibility and driving recurring demand. Providers are also investing in culinary innovation to balance medical compliance with taste and variety, improving customer retention. Meanwhile, regional and local players compete by offering culturally tailored menus and cost-optimized services. Intense competition continues to drive innovation, operational efficiency, and service quality across the market.
Key Player Analysis
- Nutrisystem
- HelloFresh
- BistroMD
- Sun Basket
- Home Chef
- Diet-to-Go
- Marley Spoon
- Magic Kitchen
- Blue Apron
- Home Bistro
Recent Developments
- In September 2025, Sun Basket introduced a new plant-based meal kit line, incorporating expanded organic ingredients and menu tags that include “Carb-Conscious” and “Diabetes-Friendly” filters. These additions aim to support personalized dietary management through fresh, nutrient-forward meal kits that feature detailed macronutrient disclosures per serving, enabling consumers to manage glycemic load directly through ingredient transparency.
- In June 2025,Nutrisystem launched an expanded suite of “Nutrisystem D” diabetic-friendly meal plans featuring updated frozen entrées with reduced net carbohydrates and enhanced protein content, designed for structured blood glucose support. This new lineup includes meals with explicit nutritional label formats showing gram-level carbohydrate, protein, and fiber statistics standardized across all offerings aimed at clearer diabetes management guidance for subscribers.
Report Coverage
The research report offers an in-depth analysis based on Application, Type and Geography. It details leading market players, providing an overview of their business, product offerings, investments, revenue streams, and key applications. Additionally, the report includes insights into the competitive environment, SWOT analysis, current market trends, as well as the primary drivers and constraints. Furthermore, it discusses various factors that have driven market expansion in recent years. The report also explores market dynamics, regulatory scenarios, and technological advancements that are shaping the industry. It assesses the impact of external factors and global economic changes on market growth. Lastly, it provides strategic recommendations for new entrants and established companies to navigate the complexities of the market.
Future Outlook
- Demand for diabetic meal delivery services will continue to expand as diabetes prevalence rises across both developed and emerging economies.
- Providers will increasingly focus on personalized meal plans tailored to individual glycemic responses and lifestyle needs.
- Integration with digital health platforms and nutrition tracking tools will strengthen customer engagement and long-term adherence.
- Subscription-based models will remain the preferred revenue structure due to convenience and recurring demand.
- Cooked, ready-to-eat meals will maintain dominance, supported by aging populations and busy urban lifestyles.
- Partnerships with healthcare providers and insurers will grow, positioning meal services as part of chronic care management.
- Expansion into emerging markets will accelerate as awareness of nutrition-led diabetes management improves.
- Menu innovation will intensify to balance medical compliance with taste, variety, and cultural relevance.
- Cost optimization and scalable logistics will become critical to improving affordability and market penetration.
- Competition will drive continuous improvements in service quality, customization, and delivery efficiency.
Request a Free Sample
Fill in your details and we'll send you a free sample report.
- Sample data tables & charts
- Research methodology
Need a Custom Version of This Report?
Tailor the scope, geography, or segments to your exact requirements.
- Custom geography or segment scope
- Direct access to our analyst team
Frequently Asked Questions
What is the current market size for Diabetic meal delivery services, and what is its projected size in 2032?
At what Compound Annual Growth Rate is the Diabetic meal delivery services market projected to grow between 2024 and 2032?
Which Diabetic meal delivery services segment held the largest share in 2024?
What are the primary factors fueling the growth of the Diabetic meal delivery services market?
Who are the leading companies in the Diabetic meal delivery services market?
Which region commanded the largest share of the Diabetic meal delivery services market in 2024?
Table of Content
Chapter 1. Report Introduction
- 1.1 Report Description & Purpose
- 1.1.1 Report Title & Market Definition
- 1.1.2 Unique Selling Propositions (USP) & Key Differentiators
- 1.1.3 Value Proposition for Stakeholders
- 1.2 Research Objectives
- 1.2.1 Market Sizing Objectives (Volume & Revenue)
- 1.2.2 Segmentation Objectives
- 1.2.3 Competitive Intelligence Objectives
- 1.2.4 Forecast & Scenario Objectives
- 1.3 Report Scope
- 1.3.1 Diabetic Meal Delivery Services Scope – Types & Subtypes Covered
- 1.3.2 Geographic Scope – Regions & Countries Covered
- 1.3.3 Historical Period, Base Year & Forecast Period (2024; forecast to 2032)
- 1.3.4 Inclusions & Exclusions
- 1.4 HS Code & Classification Framework
- 1.5 Currency, Units & Pricing Basis
- 1.6 Target Stakeholders
- 1.7 Limitations & Assumptions
Chapter 2. Executive Summary
- 2.1 Global Diabetic Meal Delivery Services Market Snapshot
- 2.1.1 Market Size – Historical (2024) & Forecast (2024-2032) (2024: USD 1,493 million → 2032: USD 4,662.7 million)
- 2.1.2 Volume & Revenue – Global Totals
- 2.1.3 Key Market Highlights – Top Five Facts
- 2.2 Diabetic Meal Delivery Services Market Segmentation Snapshot
- 2.2.1 Market Split by Region – 2024 vs. 2032
- 2.3 Competitive Snapshot
- 2.3.1 Top 10 Players by Revenue Share – 2024
- 2.3.2 Top 10 Players by Volume Share – 2024
- 2.3.3 Recent Strategic Developments (18-Month Summary)
- 2.4 Key Investment Highlights & Strategic Conclusions
Chapter 3. Diabetic Meal Delivery Services Market Dynamics & Industry Analysis
- 3.1 Market Overview & Context
- 3.1.1 Diabetic Meal Delivery Services Market Position in the Broader Automotive Value Chain
- 3.1.2 OEM vs. Replacement Market Dynamics
- 3.1.3 Market Maturity & Development Stage by Region
- 3.2 Diabetic Meal Delivery Services Market Drivers
- 3.3 Diabetic Meal Delivery Services Market Restraints & Challenges
- 3.4 Diabetic Meal Delivery Services Market Opportunities
- 3.5 Porter's Five Forces Analysis
- 3.5.1 Threat of New Entrants
- 3.5.2 Bargaining Power of Suppliers
- 3.5.3 Bargaining Power of Buyers
- 3.5.4 Threat of Substitutes
- 3.5.5 Competitive Rivalry – Intensity Assessment
- 3.6 Diabetic Meal Delivery Services Value Chain Analysis
- 3.6.1 Upstream – Raw Material/Input Suppliers
- 3.6.1.1 Raw Material/Input 1
- 3.6.1.2 Raw Material/Input 2
- 3.6.1.3 Raw Material/Input 3
- 3.6.2 Midstream – Production/Manufacturing/Service Delivery
- 3.6.2.1 Production/Process Overview
- 3.6.2.2 Key Facility Locations & Capacity by Manufacturer
- 3.6.3 Downstream – Distribution & End Consumer
- 3.6.3.1 Primary Channel – B2B/OEM
- 3.6.3.2 Secondary Channels – Dealer, Retail, Online, Direct
- 3.6.4 Value Chain Profitability Analysis
- 3.6.1 Upstream – Raw Material/Input Suppliers
- 3.7 PESTEL Analysis
- 3.7.1 Political Factors
- 3.7.2 Economic Factors
- 3.7.3 Social Factors
- 3.7.4 Technological Factors
- 3.7.5 Environmental Factors
- 3.7.6 Legal Factors
- 3.8 Diabetic Meal Delivery Services Supply Chain Analysis
- 3.8.1 Raw Material/Input Supply Risk Assessment
- 3.8.2 Manufacturing Concentration Risk (Geographic Exposure)
- 3.8.3 Trade Disruption Impact Analysis
- 3.9 Regulatory & Policy Landscape
Note: The regulatory and policy landscape section covers regulations based on their applicability to the market, Diabetic Meal Delivery Services category, geography, and scope of the study. Only regulatory frameworks with a material impact on operations, compliance, trade, sustainability, or market access are analyzed in detail.
Chapter 4. Key Investment Pockets & Opportunity Analysis
- 4.1 Diabetic Meal Delivery Services Market Attractiveness Analysis
- 4.1.1 By Region – Investment Attractiveness Matrix (Volume × CAGR)
- 4.2 Absolute Revenue Growth Opportunity
- 4.2.1 By Region – Absolute USD Growth Through 2032
- 4.3 Incremental Volume Opportunity
- 4.3.1 By Region – Incremental Volume Through 2032
- 4.3.2 Segment – Incremental Volume
- 4.4 Emerging Submarket Opportunity Deep Dive (Subject to Applicability)
- 4.5 Emerging Market Opportunity Scorecards
- 4.5.1 United States
- 4.5.2 Europe
- 4.5.3 Asia
- 4.5.4 Middle East & Africa
Note: Emerging Market Opportunity Scorecards will be included based on relevance and strategic importance. Regions listed are indicative and may vary depending on data availability and market dynamics.
Chapter 5. Diabetic Meal Delivery Services Import-Export Analysis & Trade Flows
- 5.1 Global Trade Overview
- 5.1.1 Global Export Value by Country (2024)
- 5.1.2 Global Export Volume by Country (2024)
- 5.1.3 Global Import Value by Country (2024)
- 5.1.4 Global Import Volume by Country (2024)
- 5.1.5 Net Trade Balance by Country (2024)
- 5.2 Export Analysis – Segment
- 5.2.1 Type 1 (HS Code)
- 5.2.2 Type 2 (HS Code)
- 5.2.3 Type 3 (HS Code)
- 5.2.4 Type 4 (HS Code)
- 5.2.5 Type 5 (HS Code)
- 5.3 Import Analysis – Segment
- 5.3.1 Type 1 (HS Code)
- 5.3.2 Type 2 (HS Code)
- 5.3.3 Type 3 (HS Code)
- 5.3.4 Type 4 (HS Code)
- 5.3.5 Type 5 (HS Code)
- 5.4 Average Unit Trade Prices
- 5.4.1 Average Export Price – Segment & Country
- 5.4.2 Average Import Price – Segment & Source Country
- 5.4.3 Price Trends (2024)
- 5.5 Key Trade Route Analysis
- 5.5.1 Trade Route 1
- 5.5.2 Trade Route 2
- 5.5.3 Trade Route 3
- 5.5.4 Trade Route 4
- 5.5.5 Trade Route 5
- 5.6 Trade Policy Impact Assessment
- 5.6.1 US Anti-Dumping & Section 301 Tariffs
- 5.6.2 EU Customs Union Impact
- 5.6.3 Major Free Trade Agreements
- 5.6.4 USMCA Rules of Origin
Note: Trade policy analysis will be included only where relevant to the Diabetic Meal Delivery Services market.
Chapter 6. Competitive Landscape & Company Benchmarking
- 6.1 Diabetic Meal Delivery Services Market Concentration & Structure
- 6.1.1 Herfindahl-Hirschman Index (HHI) – vs. 2024
- 6.1.2 Tier 1, Tier 2 & Tier 3 Market Structure
- 6.1.3 Global, Regional & Local Player Dynamics
- 6.2 Diabetic Meal Delivery Services Market Share Analysis – 2024
- 6.2.1 Global Revenue Share by Company
- 6.2.2 Global Volume Share by Company
- 6.2.3 Regional Revenue Share
- 6.2.4 Market Share Evolution ( vs. 2024)
- 6.2.5 OEM Segment Share by Company
- 6.2.6 Replacement Segment Share by Company
- 6.3 Production/Delivery Capacity & Facility Analysis
- 6.3.1 Global Installed Capacity
- 6.3.2 Capacity Utilization Rates
- 6.3.3 Production/Output Volume
- 6.3.4 Facility Locations & Capacity Map
- 6.3.5 Planned Capacity Additions
- 6.4 Diabetic Meal Delivery Services Competitive Benchmarking Matrix
- 6.4.1 Revenue, Volume, CAGR & Profitability Comparison
- 6.4.2 Channel Revenue Mix
- 6.4.3 Geographic Revenue Exposure
- 6.4.4 R&D Intensity
- 6.4.5 Sustainability Maturity
- 6.5 Strategic Developments in Diabetic Meal Delivery Services (Last 24 Months)
- 6.5.1 Mergers, Acquisitions & Divestments
- 6.5.2 New Diabetic Meal Delivery Services Launches
- 6.5.3 Facility Expansions
- 6.5.4 Strategic Alliances, Joint Ventures & Partnerships
- 6.5.5 Distribution Expansion & Market Entry
- 6.5.6 Sustainability & ESG Initiatives
- 6.6 Competitive Strategy Mapping
- 6.6.1 Leader, Challenger, Follower & Niche Classification
- 6.6.2 Pricing Strategy Comparison
- 6.6.3 Channel Strategy Matrix
Note: Strategic developments are included based on their materiality and the availability of reliable information.
Chapter 7. Global Diabetic Meal Delivery Services Market – By Distribution Channel
- 7.1 Segment Overview
- 7.1.1 Volume & Revenue Split by Channel (2024 & 2032)
- 7.1.2 Channel Mix Evolution (2024-2032)
Chapter 8. Regional Market Analysis – Global Overview
- 8.1 Global Regional Overview
- 8.1.1 Regional Volume Share
- 8.1.2 Regional Revenue Share
- 8.1.3 Regional Volume by Region
- 8.1.4 Regional Revenue by Region
- 8.1.5 Regional Forecast Through 2032
- 8.2 Cross-Regional Segment Analysis
- 8.2.1 By Distribution Channel
- 8.2.2 By Brand/Price Tier
Chapter 9. North America Diabetic Meal Delivery Services Market
- 9.1 United States
- 9.2 Canada
- 9.3 Mexico
Chapter 10. Europe Diabetic Meal Delivery Services Market
- 10.1 Germany
- 10.2 France
- 10.3 Italy
- 10.4 United Kingdom
- 10.5 Spain
- 10.6 Poland
- 10.7 Russia
- 10.8 Netherlands
- 10.9 Belgium
- 10.10 Sweden
- 10.11 Denmark
- 10.12 Norway
- 10.13 Rest of Europe
Chapter 11. Asia Pacific Diabetic Meal Delivery Services Market
- 11.1 China
- 11.2 India
- 11.3 Japan
- 11.4 South Korea
- 11.5 Thailand
- 11.6 Indonesia
- 11.7 Vietnam
- 11.8 Malaysia
- 11.9 Australia
- 11.10 Rest of Asia Pacific
Chapter 12. Latin America Diabetic Meal Delivery Services Market
- 12.1 Brazil
- 12.2 Argentina
- 12.3 Colombia
- 12.4 Chile
- 12.5 Rest of Latin America
Chapter 13. Middle East Diabetic Meal Delivery Services Market
- 13.1 Saudi Arabia
- 13.2 United Arab Emirates
- 13.3 Turkey
- 13.4 Israel
- 13.5 Iran
- 13.6 Rest of the Middle East
Chapter 14. Africa Diabetic Meal Delivery Services Market
- 14.1 South Africa
- 14.2 Egypt
- 14.3 Nigeria
- 14.4 Morocco
- 14.5 Rest of Africa
Chapter 15. Diabetic Meal Delivery Services Company Profiles
- 15.1 [Company 01]
- 15.1.1 Company Overview
- 15.1.2 Key Management Personnel
- 15.1.3 Products & Services Portfolio
- 15.1.4 Financial Performance
- 15.1.5 Key Market Focus & Geographic Presence
- 15.1.6 Recent Developments & Strategic Initiatives
Note: The company profile list is preliminary and may change based on research findings, market developments, data availability, and client requirements.
Chapter 16. Appendices
- Appendix A – List of Abbreviations & Acronyms
- Appendix B – Industry Classification Code Reference – Full Series
- Appendix C – Production & Capacity Data Tables
- Appendix D – End-Use & Demand Base Tables
- Appendix E – Consumption & Replacement Rate Assumptions
- Appendix F – ASP Reference Tables
- Appendix G – Manufacturing & Facility Database
- Appendix H – Import-Export Data Tables
- Appendix I – Regulatory Summary Tables
- Appendix J – Primary Research Participant List (Anonymized)
- Appendix K – Primary Research Questionnaire Framework
- Appendix L – Data Sources & Bibliography
- Appendix M – Market Size Divergence & Source Comparison
Chapter 17. Research Methodology
- 17.1 Research Framework & Philosophy
- 17.2 Secondary Research – Sources, Hierarchy & Data Extraction
- 17.3 Data Modeling – Bottom-Up & Top-Down Market Sizing
- 17.4 Primary Research – Stakeholder Framework, LOI & Sample Sizes
- 17.5 Forecast Methodology – Regression, Scenario & Sensitivity Analysis
- 17.6 Quality Control – Four-Layer Validation Framework
- 17.7 Limitations & Standard Assumptions
- 17.8 Disclaimer
