
Distributed Power Generation Market Overview:
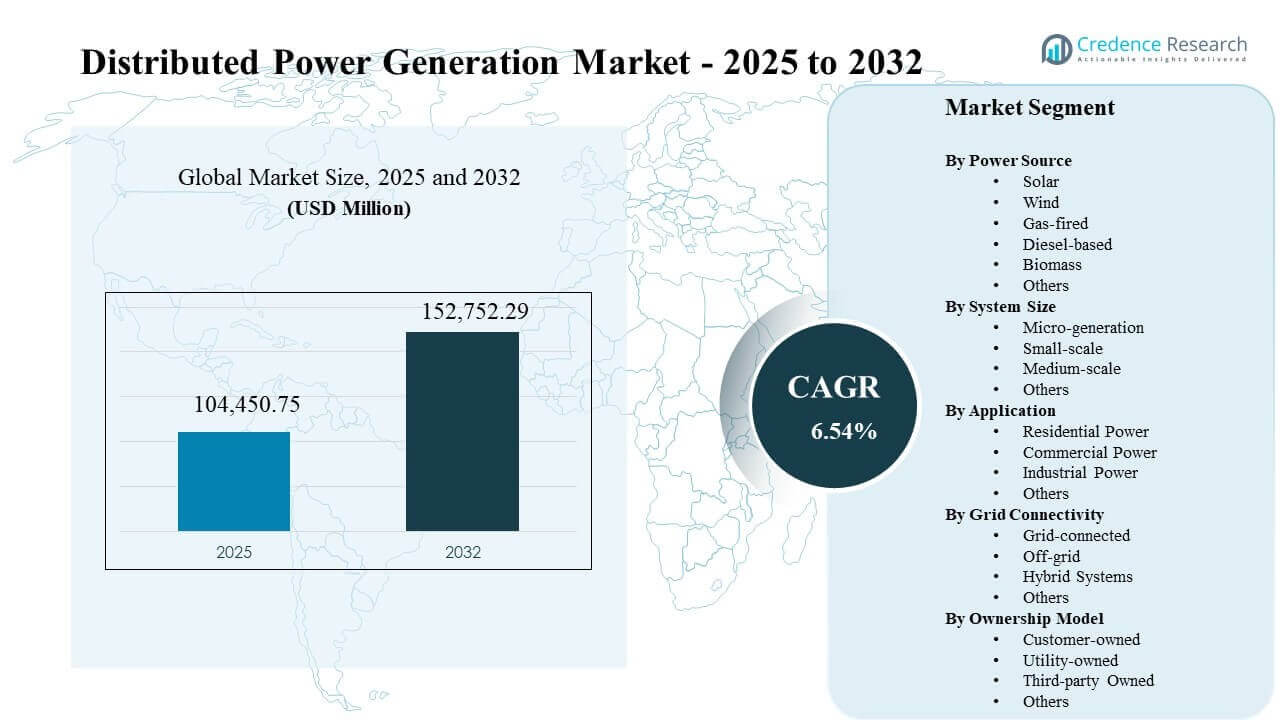
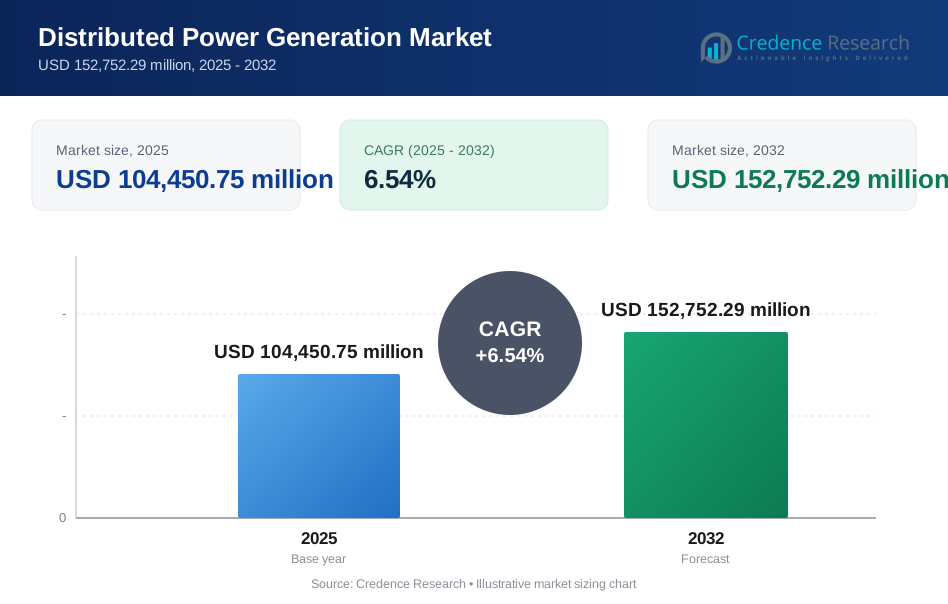
The Distributed Power Generation Market size was estimated at USD 104,450.75 million in 2025 and is expected to reach USD 152,752.29 million by 2032, growing at a CAGR of 6.54% from 2025 to 2032. Growth is anchored in reliability-driven investments as commercial and industrial users add localized generation to reduce outage exposure and manage power-quality requirements. Asia Pacific remains a central demand engine, supported by expanding electricity consumption, faster distributed renewable buildouts, and broader deployment of hybrid configurations across urban and remote sites.
| REPORT ATTRIBUTE | DETAILS |
|---|---|
| Historical Period | 2020-2024 |
| Base Year | 2025 |
| Forecast Period | 2026-2032 |
| Distributed Power Generation Market Size 2025 | USD 104,450.75 million |
| Distributed Power Generation Market, CAGR | 6.54% |
| Distributed Power Generation Market Size 2032 | USD 152,752.29 million |
Key Market Trends & Insights
- Asia Pacific accounted for 41.8% of global revenue in 2025, reflecting the strongest concentration of new distributed capacity additions.
- Grid-connected configurations represented 62.1% share in 2025, supported by easier interconnection and broader suitability for commercial and industrial sites.
- Solar led the power-source mix with a 32.9% share in 2025 as rooftop and onsite PV remained the most scalable distributed option.
- Micro-generation captured 44.0% share in 2025, reflecting buyer preference for modular systems aligned to building- and facility-level loads.
- Commercial Power held a 33.2% share in 2025, driven by demand for resiliency, tariff optimization, and predictable lifecycle operating costs.
Segment Analysis
The Distributed Power Generation Market is shaped by a buyer mix that prioritizes uptime, power-quality stability, and cost predictability. Commercial sites increasingly deploy modular assets to balance capital discipline with resilience targets, especially where grid upgrades face long lead times. Grid-connected architectures dominate because interconnection simplifies operations and broadens eligible sites, improving asset utilization for owners and operators. Hybrid configurations expand adoption where customers require islanding capability and operational flexibility during grid events.
Power-source decisions increasingly pair clean generation with dispatchable assets and controls. Solar leads the mix due to rapid deployment and suitability for distributed footprints, especially across retail, campuses, and industrial estates. Micro-generation remains the largest size band because smaller systems match site loads and reduce installation disruption. Regional variation persists, with Asia Pacific building scale fastest and North America maintaining strong demand from commercial, industrial, and data-intensive users.
By Power Source Insights
Solar accounted for the largest share of 32.9% in 2025. Solar leadership reflects broad rooftop and onsite suitability across commercial and industrial estates that need rapid deployment without fuel logistics. Solar economics improve when paired with storage and controls that raise self-consumption and reduce peak charges. Policy support and decarbonization commitments reinforce solar adoption, especially where local permitting and interconnection processes are well-defined.
By System Size Insights
Micro-generation accounted for the largest share of 44.0% in 2025. Micro-generation fits building-level and site-level load profiles and supports modular rollouts across multi-site operators. Micro-generation projects often require less complex engineering and can be phased as demand grows, improving capital efficiency. Micro-generation also supports hybrid architectures that prioritize resilience in critical facilities such as retail chains, healthcare campuses, and light industrial operations.
By Application Insights
Commercial Power accounted for the largest share of 33.2% in 2025. Commercial buyers prioritize downtime avoidance, stable power quality, and predictable operating costs, supporting steady adoption across office parks, retail, and institutional campuses. Commercial deployments also benefit from standardized designs that reduce engineering effort for repeat builds. Commercial demand rises where tariff structures create high peak costs and where grid service levels remain variable.
By Grid Connectivity Insights
Grid-connected accounted for the largest share of 62.1% in 2025. Grid-connected dominance is supported by easier permitting and interconnection, which improves project bankability and reduces time to energization. Grid-connected systems also enable broader operating modes, including peak shaving and ancillary participation where regulations allow. Grid-connected designs remain preferred for commercial and industrial users that need reliability support without full dependence on onsite fuel supply.
By Ownership Model Insights
Customer-owned leadership remains common in distributed deployments where resilience, operational control, and site-specific economics justify direct investment. Utility-owned models expand where grid constraints or reliability programs support behind-the-meter or feeder-level deployments. Third-party owned structures accelerate adoption by shifting capital costs into service-style contracts and simplifying procurement for budget-limited customers. Ownership selection is frequently driven by risk appetite, tariff design, and operational responsibilities over the asset lifecycle.
Distributed Power Generation Market Drivers
Reliability and resiliency requirements
The Distributed Power Generation Market expands as enterprises treat power continuity as a core operational requirement rather than a contingency. Commercial sites, logistics hubs, and industrial plants increasingly deploy onsite assets to reduce outage exposure and protect sensitive equipment. Localized generation improves response during grid disturbances by supporting critical loads and maintaining power quality. More frequent extreme weather events and aging grid infrastructure reinforce resiliency-driven procurement decisions.
- For instance, Bloom Energy reports that its systems have powered customer facilities through more than 1,750 outages since 2018, and one Bloom microgrid kept a site operating through a 5.5-day outage during California’s 2019 fire season.
Faster capacity delivery than grid upgrades
Distributed projects can be delivered faster than transmission and distribution reinforcements in many constrained regions. Businesses adopt onsite solutions to avoid delays tied to permitting, interconnection queues, and utility upgrade schedules. Modular system designs reduce engineering lead times and allow phased commissioning aligned to demand growth. Faster delivery supports expansion plans for energy-intensive operations and digitally enabled facilities that require predictable energization timelines.
- For instance, Quanta Computer expanded its Bloom Energy solid oxide fuel cell installation by more than 150 percent after utility interconnection delays constrained its Fremont manufacturing expansion, with the islanded microgrid designed to support operations 24/7, 365 days a year.
Decarbonization and onsite clean generation adoption
Sustainability targets drive greater use of solar and biomass options within distributed portfolios, especially when paired with controls and storage. Corporate emissions goals elevate demand for cleaner onsite generation that can be measured and reported at the facility level. Distributed clean assets help reduce exposure to volatile grid emissions intensity and can improve procurement flexibility. Industry electrification trends also increase facility loads, strengthening the case for onsite generation and hybridization.
Economics of peak management and operating cost control
Distributed generation supports tariff optimization by reducing peak demand charges and smoothing facility load profiles. Commercial and industrial users value predictable operating costs where utility pricing is variable or where outages impose high indirect losses. Hybrid setups improve dispatchability, enabling owners to prioritize economics during normal operations and resilience during grid events. Performance monitoring and digital controls help optimize runtime, fuel use, and maintenance, improving lifecycle economics.
Distributed Power Generation Market Challenges
The Distributed Power Generation Market faces procurement and execution hurdles tied to equipment lead times, interconnection constraints, and complex local permitting. Project schedules can slip when utilities require feeder upgrades or when compliance requirements vary by jurisdiction. Fuel logistics and maintenance planning remain important for dispatchable systems, especially where skilled service availability is limited. Integration complexity increases when sites combine solar, engines, storage, and controls, requiring stronger engineering coordination.
Cost and financing barriers can slow adoption in regions with higher interest rates or weaker project bankability. Smaller customers may struggle to justify upfront capital despite strong resilience value, increasing dependence on third-party ownership structures. Policy changes and incentive uncertainty can disrupt payback assumptions for clean distributed systems. Cybersecurity and control-system reliability also emerge as concerns as digital monitoring and remote operations become more common.
- For instance, Schneider Electric introduced its battery energy storage system for EcoStruxure Microgrid Flex in sizes ranging from 60 kW to 2 MW, available in 2-hour and 4-hour configurations and capable of delivering up to 2 MW during outages, while using a pre-integrated architecture with battery, battery management system, power conversion system, and controller to reduce integration time and minimize field errors.
Distributed Power Generation Market Trends and Opportunities
Hybrid distributed architectures represent a major opportunity as buyers combine solar with dispatchable assets, storage, and controls to improve flexibility. Microgrids expand from remote applications into commercial campuses and industrial parks where reliability targets are strict. Standardized modular offerings reduce complexity and shorten deployment timelines, supporting broader adoption across multi-site operators. Digital controls and monitoring improve dispatch decisions and enable performance guarantees under service-based models.
Growing electricity demand from data-intensive operations creates opportunities for dedicated onsite power strategies. Commercial operators increasingly evaluate distributed generation to secure capacity where grid expansion lags demand growth. Fuel-flexible engines and lower-carbon fuels become more relevant as operators seek reliability without locking into high-emission pathways. Partnerships between OEMs, integrators, and energy service providers strengthen go-to-market models for turnkey deployments.
- For instance, Rolls-Royce states that its mtu Series 4000 gas gensets can supply power to data centers at full load within 120 seconds, while its 60 Hz models from 2026 are designed to reach full power in 45 seconds.
Regional Insights
North America
North America held 25.7% share in 2025, supported by mature commercial and industrial adoption and strong demand for resiliency across mission-critical facilities. Data-intensive and industrial loads reinforce demand for faster capacity delivery and predictable energization. Service ecosystems for engines, controls, and integration remain well-developed, supporting lifecycle performance.
Europe
Europe captured 21.3% share in 2025, driven by strong distributed renewable penetration and increasing emphasis on local flexibility. Commercial campuses and industrial sites deploy distributed assets to manage tariff exposure and improve operational continuity. Policy frameworks supporting decarbonization encourage solar-led configurations and hybrid systems that reduce reliance on grid volatility.
Asia Pacific
Asia Pacific led with 41.8% share in 2025 as distributed buildouts scale across high-growth electricity markets. Rapid commercial expansion, industrialization, and reliability gaps sustain demand for localized generation and hybrid microgrids. Diverse grid conditions and faster deployment needs support broad adoption across both urban commercial sites and remote industrial operations.
Latin America
Latin America reached 6.4% share in 2025, led by distributed adoption in industrial, mining, and commercial applications where reliability and cost control matter. Project pipelines often depend on financing conditions and regulatory clarity, creating variability across markets. Hybrid deployments offer strong value where grid stability is inconsistent.
Middle East & Africa
Middle East & Africa represented 4.8% share in 2025, supported by weak-grid and off-grid applications and remote industrial loads. Adoption is influenced by capital availability, fuel supply logistics, and project execution capacity. Hybrid systems can improve reliability outcomes where grid reinforcement remains slow.
Competitive Landscape
The Distributed Power Generation Market remains competitive, with vendors emphasizing lifecycle reliability, fuel flexibility, modular scalability, and strong service networks. OEMs and integrators compete on turnkey delivery capability, controls and monitoring sophistication, and total cost of ownership optimization. Partnerships with EPC firms and energy service providers strengthen customer access and speed deployment. Differentiation often centers on efficiency, uptime guarantees, and the ability to integrate multi-asset hybrids.
Siemens Energy competes by aligning equipment capabilities with system-level performance needs for distributed and flexible power applications. Siemens Energy leverages engineering expertise and service offerings to support reliability targets and lifecycle optimization for commercial and industrial users. Siemens Energy positioning benefits when customers require stronger grid-support features, faster delivery models, and integration with digital monitoring. Siemens Energy also benefits from broader electrification and capacity buildouts that increase demand for flexible power solutions.
The industry research and growth report includes detailed analyses of the competitive landscape of the market and information about key companies, including:
- Siemens Energy
- General Electric
- Wärtsilä
- Caterpillar
- Cummins
- Mitsubishi Heavy Industries
- Rolls-Royce Power Systems
- Schneider Electric
- ABB
- Eaton
Qualitative and quantitative analysis of companies has been conducted to help clients understand the wider business environment as well as the strengths and weaknesses of key industry players. Data is qualitatively analyzed to categorize companies as pure play, category-focused, industry-focused, and diversified; it is quantitatively analyzed to categorize companies as dominant, leading, strong, tentative, and weak.
Recent Developments
- In October 2025, VoltaGrid and Halliburton announced a strategic collaboration to develop, deploy, and operate distributed power generation solutions for data centers, with the initial rollout targeted at the Middle East.
- In March 2026, Kodiak Gas Services announced that it completed its acquisition of Distributed Power Solutions, rebranded the business as Kodiak Power Solutions, and expanded its reach in distributed and behind-the-meter power generation by adding about 395 MW of generation capacity.
- In February 2026, OnSite Partners said it acquired One Power Company to expand its behind-the-meter generation portfolio, broaden its customer base, and strengthen its capabilities in energy infrastructure operations, maintenance, and construction.
- In February 2026, Rolls-Royce introduced modular gas engine power plants for decentralized electricity generation, with turnkey systems ranging from 5 MW to several hundred MW and preconfigured modules designed for grid connection within 12 to 18 months.
Report Scope
Segmentation
By power source
- Solar
- Wind
- Gas-fired
- Diesel-based
- Biomass
- Others
By system size
- Micro-generation
- Small-scale
- Medium-scale
- Others
By application
- Residential Power
- Commercial Power
- Industrial Power
- Others
By grid connectivity
- Grid-connected
- Off-grid
- Hybrid Systems
- Others
By ownership model
- Customer-owned
- Utility-owned
- Third-party Owned
- Others
By Region
- North America
- U.S.
- Canada
- Mexico
- Europe
- Germany
- France
- U.K.
- Italy
- Spain
- Rest of Europe
- Asia Pacific
- China
- Japan
- India
- South Korea
- South-east Asia
- Rest of Asia Pacific
- Latin America
- Brazil
- Argentina
- Rest of Latin America
- Middle East & Africa
- GCC Countries
- South Africa
- Rest of the Middle East and Africa
Request a Free Sample
Fill in your details and we'll send you a free sample report.
- Sample data tables & charts
- Research methodology
Need a Custom Version of This Report?
Tailor the scope, geography, or segments to your exact requirements.
- Custom geography or segment scope
- Direct access to our analyst team
Frequently Asked Questions
What is the market size of the Distributed Power Generation Market in 2025 and 2032?
What is the CAGR for the Distributed Power Generation Market during 2025–2032?
What is the largest segment in the Distributed Power Generation Market?
What factors are driving growth in the Distributed Power Generation Market?
Who are the leading companies in the Distributed Power Generation Market?
Which region leads the Distributed Power Generation Market?
Table of Content
Chapter 1. Report Introduction
- 1.1 Report Description & Purpose
- 1.1.1 Report Title & Market Definition
- 1.1.2 Unique Selling Propositions (USP) & Key Differentiators
- 1.1.3 Value Proposition for Stakeholders
- 1.2 Research Objectives
- 1.2.1 Market Sizing Objectives (Volume & Revenue)
- 1.2.2 Segmentation Objectives
- 1.2.3 Competitive Intelligence Objectives
- 1.2.4 Forecast & Scenario Objectives
- 1.3 Report Scope
- 1.3.1 Distributed Power Generation Scope – Types & Subtypes Covered
- 1.3.2 Geographic Scope – Regions & Countries Covered
- 1.3.3 Historical Period, Base Year & Forecast Period (2025; forecast to 2032)
- 1.3.4 Inclusions & Exclusions
- 1.4 HS Code & Classification Framework
- 1.5 Currency, Units & Pricing Basis
- 1.6 Target Stakeholders
- 1.7 Limitations & Assumptions
Chapter 2. Executive Summary
- 2.1 Global Distributed Power Generation Market Snapshot
- 2.1.1 Market Size – Historical (2025) & Forecast (2025-2032) (2025: USD 104,450.75 million → 2032: USD 152,752.29 million)
- 2.1.2 Volume & Revenue – Global Totals
- 2.1.3 Key Market Highlights – Top Five Facts
- 2.2 Distributed Power Generation Market Segmentation Snapshot
- 2.2.1 Market Split by Region – 2025 vs. 2032
- 2.3 Competitive Snapshot
- 2.3.1 Top 10 Players by Revenue Share – 2025
- 2.3.2 Top 10 Players by Volume Share – 2025
- 2.3.3 Recent Strategic Developments (18-Month Summary)
- 2.4 Key Investment Highlights & Strategic Conclusions
Chapter 3. Distributed Power Generation Market Dynamics & Industry Analysis
- 3.1 Market Overview & Context
- 3.1.1 Distributed Power Generation Market Position in the Broader Automotive Value Chain
- 3.1.2 OEM vs. Replacement Market Dynamics
- 3.1.3 Market Maturity & Development Stage by Region
- 3.2 Distributed Power Generation Market Drivers
- 3.3 Distributed Power Generation Market Restraints & Challenges
- 3.4 Distributed Power Generation Market Opportunities
- 3.5 Porter's Five Forces Analysis
- 3.5.1 Threat of New Entrants
- 3.5.2 Bargaining Power of Suppliers
- 3.5.3 Bargaining Power of Buyers
- 3.5.4 Threat of Substitutes
- 3.5.5 Competitive Rivalry – Intensity Assessment
- 3.6 Distributed Power Generation Value Chain Analysis
- 3.6.1 Upstream – Raw Material/Input Suppliers
- 3.6.1.1 Raw Material/Input 1
- 3.6.1.2 Raw Material/Input 2
- 3.6.1.3 Raw Material/Input 3
- 3.6.2 Midstream – Production/Manufacturing/Service Delivery
- 3.6.2.1 Production/Process Overview
- 3.6.2.2 Key Facility Locations & Capacity by Manufacturer
- 3.6.3 Downstream – Distribution & End Consumer
- 3.6.3.1 Primary Channel – B2B/OEM
- 3.6.3.2 Secondary Channels – Dealer, Retail, Online, Direct
- 3.6.4 Value Chain Profitability Analysis
- 3.6.1 Upstream – Raw Material/Input Suppliers
- 3.7 PESTEL Analysis
- 3.7.1 Political Factors
- 3.7.2 Economic Factors
- 3.7.3 Social Factors
- 3.7.4 Technological Factors
- 3.7.5 Environmental Factors
- 3.7.6 Legal Factors
- 3.8 Distributed Power Generation Supply Chain Analysis
- 3.8.1 Raw Material/Input Supply Risk Assessment
- 3.8.2 Manufacturing Concentration Risk (Geographic Exposure)
- 3.8.3 Trade Disruption Impact Analysis
- 3.9 Regulatory & Policy Landscape
Note: The regulatory and policy landscape section covers regulations based on their applicability to the market, Distributed Power Generation category, geography, and scope of the study. Only regulatory frameworks with a material impact on operations, compliance, trade, sustainability, or market access are analyzed in detail.
Chapter 4. Key Investment Pockets & Opportunity Analysis
- 4.1 Distributed Power Generation Market Attractiveness Analysis
- 4.1.1 By Region – Investment Attractiveness Matrix (Volume × CAGR)
- 4.2 Absolute Revenue Growth Opportunity
- 4.2.1 By Region – Absolute USD Growth Through 2032
- 4.3 Incremental Volume Opportunity
- 4.3.1 By Region – Incremental Volume Through 2032
- 4.3.2 Segment – Incremental Volume
- 4.4 Emerging Submarket Opportunity Deep Dive (Subject to Applicability)
- 4.5 Emerging Market Opportunity Scorecards
- 4.5.1 United States
- 4.5.2 Europe
- 4.5.3 Asia
- 4.5.4 Middle East & Africa
Note: Emerging Market Opportunity Scorecards will be included based on relevance and strategic importance. Regions listed are indicative and may vary depending on data availability and market dynamics.
Chapter 5. Distributed Power Generation Import-Export Analysis & Trade Flows
- 5.1 Global Trade Overview
- 5.1.1 Global Export Value by Country (2025)
- 5.1.2 Global Export Volume by Country (2025)
- 5.1.3 Global Import Value by Country (2025)
- 5.1.4 Global Import Volume by Country (2025)
- 5.1.5 Net Trade Balance by Country (2025)
- 5.2 Export Analysis – Segment
- 5.2.1 Type 1 (HS Code)
- 5.2.2 Type 2 (HS Code)
- 5.2.3 Type 3 (HS Code)
- 5.2.4 Type 4 (HS Code)
- 5.2.5 Type 5 (HS Code)
- 5.3 Import Analysis – Segment
- 5.3.1 Type 1 (HS Code)
- 5.3.2 Type 2 (HS Code)
- 5.3.3 Type 3 (HS Code)
- 5.3.4 Type 4 (HS Code)
- 5.3.5 Type 5 (HS Code)
- 5.4 Average Unit Trade Prices
- 5.4.1 Average Export Price – Segment & Country
- 5.4.2 Average Import Price – Segment & Source Country
- 5.4.3 Price Trends (2025)
- 5.5 Key Trade Route Analysis
- 5.5.1 Trade Route 1
- 5.5.2 Trade Route 2
- 5.5.3 Trade Route 3
- 5.5.4 Trade Route 4
- 5.5.5 Trade Route 5
- 5.6 Trade Policy Impact Assessment
- 5.6.1 US Anti-Dumping & Section 301 Tariffs
- 5.6.2 EU Customs Union Impact
- 5.6.3 Major Free Trade Agreements
- 5.6.4 USMCA Rules of Origin
Note: Trade policy analysis will be included only where relevant to the Distributed Power Generation market.
Chapter 6. Competitive Landscape & Company Benchmarking
- 6.1 Distributed Power Generation Market Concentration & Structure
- 6.1.1 Herfindahl-Hirschman Index (HHI) – vs. 2025
- 6.1.2 Tier 1, Tier 2 & Tier 3 Market Structure
- 6.1.3 Global, Regional & Local Player Dynamics
- 6.2 Distributed Power Generation Market Share Analysis – 2025
- 6.2.1 Global Revenue Share by Company
- 6.2.2 Global Volume Share by Company
- 6.2.3 Regional Revenue Share
- 6.2.4 Market Share Evolution ( vs. 2025)
- 6.2.5 OEM Segment Share by Company
- 6.2.6 Replacement Segment Share by Company
- 6.3 Production/Delivery Capacity & Facility Analysis
- 6.3.1 Global Installed Capacity
- 6.3.2 Capacity Utilization Rates
- 6.3.3 Production/Output Volume
- 6.3.4 Facility Locations & Capacity Map
- 6.3.5 Planned Capacity Additions
- 6.4 Distributed Power Generation Competitive Benchmarking Matrix
- 6.4.1 Revenue, Volume, CAGR & Profitability Comparison
- 6.4.2 Channel Revenue Mix
- 6.4.3 Geographic Revenue Exposure
- 6.4.4 R&D Intensity
- 6.4.5 Sustainability Maturity
- 6.5 Strategic Developments in Distributed Power Generation (Last 24 Months)
- 6.5.1 Mergers, Acquisitions & Divestments
- 6.5.2 New Distributed Power Generation Launches
- 6.5.3 Facility Expansions
- 6.5.4 Strategic Alliances, Joint Ventures & Partnerships
- 6.5.5 Distribution Expansion & Market Entry
- 6.5.6 Sustainability & ESG Initiatives
- 6.6 Competitive Strategy Mapping
- 6.6.1 Leader, Challenger, Follower & Niche Classification
- 6.6.2 Pricing Strategy Comparison
- 6.6.3 Channel Strategy Matrix
Note: Strategic developments are included based on their materiality and the availability of reliable information.
Chapter 7. Global Distributed Power Generation Market – By Distribution Channel
- 7.1 Segment Overview
- 7.1.1 Volume & Revenue Split by Channel (2025 & 2032)
- 7.1.2 Channel Mix Evolution (2025-2032)
Chapter 8. Regional Market Analysis – Global Overview
- 8.1 Global Regional Overview
- 8.1.1 Regional Volume Share
- 8.1.2 Regional Revenue Share
- 8.1.3 Regional Volume by Region
- 8.1.4 Regional Revenue by Region
- 8.1.5 Regional Forecast Through 2032
- 8.2 Cross-Regional Segment Analysis
- 8.2.1 By Distribution Channel
- 8.2.2 By Brand/Price Tier
Chapter 9. North America Distributed Power Generation Market
- 9.1 United States
- 9.2 Canada
- 9.3 Mexico
Chapter 10. Europe Distributed Power Generation Market
- 10.1 Germany
- 10.2 France
- 10.3 Italy
- 10.4 United Kingdom
- 10.5 Spain
- 10.6 Poland
- 10.7 Russia
- 10.8 Netherlands
- 10.9 Belgium
- 10.10 Sweden
- 10.11 Denmark
- 10.12 Norway
- 10.13 Rest of Europe
Chapter 11. Asia Pacific Distributed Power Generation Market
- 11.1 China
- 11.2 India
- 11.3 Japan
- 11.4 South Korea
- 11.5 Thailand
- 11.6 Indonesia
- 11.7 Vietnam
- 11.8 Malaysia
- 11.9 Australia
- 11.10 Rest of Asia Pacific
Chapter 12. Latin America Distributed Power Generation Market
- 12.1 Brazil
- 12.2 Argentina
- 12.3 Colombia
- 12.4 Chile
- 12.5 Rest of Latin America
Chapter 13. Middle East Distributed Power Generation Market
- 13.1 Saudi Arabia
- 13.2 United Arab Emirates
- 13.3 Turkey
- 13.4 Israel
- 13.5 Iran
- 13.6 Rest of the Middle East
Chapter 14. Africa Distributed Power Generation Market
- 14.1 South Africa
- 14.2 Egypt
- 14.3 Nigeria
- 14.4 Morocco
- 14.5 Rest of Africa
Chapter 15. Distributed Power Generation Company Profiles
- 15.1 [Company 01]
- 15.1.1 Company Overview
- 15.1.2 Key Management Personnel
- 15.1.3 Products & Services Portfolio
- 15.1.4 Financial Performance
- 15.1.5 Key Market Focus & Geographic Presence
- 15.1.6 Recent Developments & Strategic Initiatives
Note: The company profile list is preliminary and may change based on research findings, market developments, data availability, and client requirements.
Chapter 16. Appendices
- Appendix A – List of Abbreviations & Acronyms
- Appendix B – Industry Classification Code Reference – Full Series
- Appendix C – Production & Capacity Data Tables
- Appendix D – End-Use & Demand Base Tables
- Appendix E – Consumption & Replacement Rate Assumptions
- Appendix F – ASP Reference Tables
- Appendix G – Manufacturing & Facility Database
- Appendix H – Import-Export Data Tables
- Appendix I – Regulatory Summary Tables
- Appendix J – Primary Research Participant List (Anonymized)
- Appendix K – Primary Research Questionnaire Framework
- Appendix L – Data Sources & Bibliography
- Appendix M – Market Size Divergence & Source Comparison
Chapter 17. Research Methodology
- 17.1 Research Framework & Philosophy
- 17.2 Secondary Research – Sources, Hierarchy & Data Extraction
- 17.3 Data Modeling – Bottom-Up & Top-Down Market Sizing
- 17.4 Primary Research – Stakeholder Framework, LOI & Sample Sizes
- 17.5 Forecast Methodology – Regression, Scenario & Sensitivity Analysis
- 17.6 Quality Control – Four-Layer Validation Framework
- 17.7 Limitations & Standard Assumptions
- 17.8 Disclaimer
