
Japan Behind the Meter Energy Storage Market Overview:
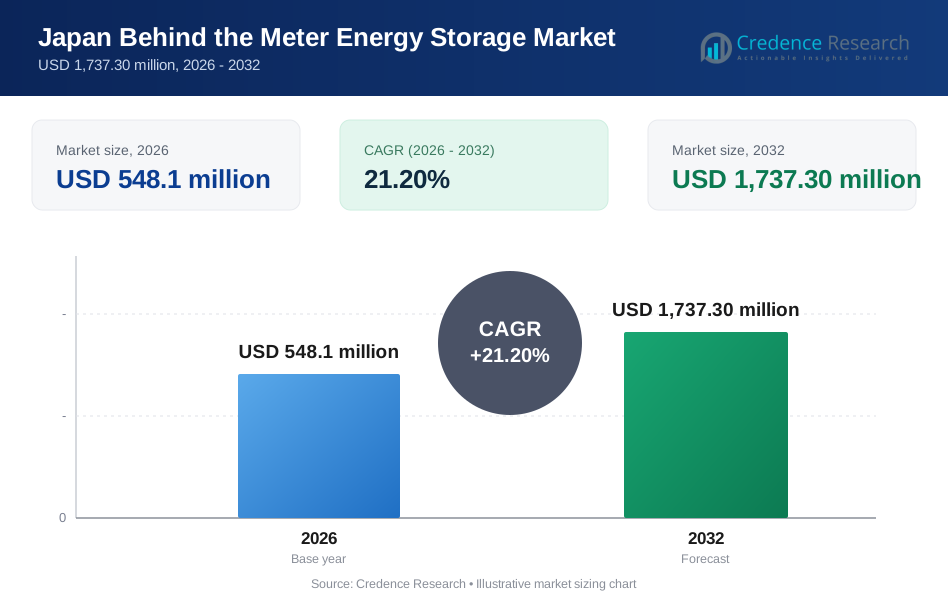
The Japan Behind the Meter Energy Storage Market size was valued at USD 548.1 million in 2026. It is anticipated to reach USD 1,737.30 million by 2032, growing at a CAGR of 21.20% during the forecast period.
| REPORT ATTRIBUTE | DETAILS |
|---|---|
| Historical Period | 2021-2025 |
| Base Year | 2026 |
| Forecast Period | 2027-2032 |
| Japan Behind the Meter Energy Storage Market Size 2026 | USD 548.1 million |
| Japan Behind the Meter Energy Storage Market, CAGR | 21.20% |
| Japan Behind the Meter Energy Storage Market Size 2032 | USD 1,737.30 million |
Japan Behind the Meter Energy Storage Market Insights
- Market growth is supported by solar-plus-storage adoption, virtual power plant participation, grid resilience needs, electricity cost optimization and demand for flexible distributed energy resources.
- Lithium-ion batteries hold the leading position because they offer strong energy density, better cycle life, higher system efficiency and broad supplier availability across residential, commercial and industrial applications.
- Solar PV integrated systems lead the connection segment because customers seek higher self-consumption, backup power, lower grid dependence and stronger participation in smart energy programs.
- Kanto leads the market with 32% share, supported by dense electricity demand, high commercial activity, rooftop solar opportunities and strong adoption potential across Tokyo and surrounding prefectures.
Japan Behind the Meter Energy Storage Market Segment Insights
By battery type
By battery type, lithium-ion led the Japan Behind the Meter Energy Storage Market in 2026, supported by strong adoption across residential, commercial and industrial storage systems. The segment benefits from better battery management systems, higher round-trip efficiency and wider availability from major global suppliers. LFP systems are gaining stronger acceptance because they offer improved safety, longer cycle life and lower lifecycle cost. Lead-acid batteries remain relevant in basic backup power applications, but their share continues to weaken as lithium-ion pricing improves. Flow batteries are gaining interest for long-duration commercial and industrial use cases, while sodium-ion remains an emerging option for stationary storage.
By system capacity
By system capacity, up to 100 kW systems held a strong position in 2026 because residential and small commercial users continue to install compact storage systems for backup power, solar self-consumption and energy cost optimization. The 101–500 kW segment is expected to gain faster adoption across offices, retail facilities, schools, hospitals and municipal buildings. These systems help users reduce peak demand, improve resilience and support demand response programs. Above 500 kW systems serve industrial sites, logistics hubs, data centers and large EV charging locations. Demand across all capacity ranges is rising as users treat storage as both an energy security asset and a cost management tool.
By connection
By connection, solar PV integrated systems led the market in 2026 because Japan’s residential and commercial customers increasingly pair storage with rooftop solar systems. These systems store daytime solar generation and support evening use, which improves self-consumption and reduces grid electricity purchases. Solar PV integrated systems also support virtual power plant aggregation when batteries are connected through intelligent controls. Standalone systems remain important where users need backup power, peak shaving or energy cost control without immediate solar installation. Demand for standalone systems is rising in commercial and industrial facilities that need flexible power management. Solar PV integrated systems are expected to retain leadership through 2032.
By application
By application, energy cost optimization and peak demand management held strong positions in 2026 because high electricity costs continue to influence customer energy decisions. Behind-the-meter storage helps users shift consumption, reduce demand charges and improve control over site-level energy use. Backup power remains a key application because Japan faces natural disaster risks, grid disruption concerns and high reliability needs. Demand response is becoming more important as utilities and aggregators use distributed batteries to support grid balancing. EV charging support is gaining traction as charging infrastructure expands across commercial sites, fleet depots and public locations. Renewable integration will remain a high-growth application as storage supports solar use and limits grid stress.
By end user
By end user, residential customers held a strong position in 2026 because households continue to value backup power, energy independence and rooftop solar self-consumption. Residential adoption is also supported by compact battery designs, smart controls and aggregator-led virtual power plant programs. Commercial users are expected to grow rapidly as offices, retail chains, hotels, hospitals and public buildings use storage to lower energy costs and improve resilience. Industrial users are adopting larger systems to manage peak demand, support power quality and protect critical operations. The Japan Behind the Meter Energy Storage Market will benefit as all end users shift from passive electricity consumption to active energy management.
Key Market Drivers
Solar-plus-storage and VPP adoption
Solar-plus-storage and VPP adoption is the strongest growth driver for the Japan Behind the Meter Energy Storage Market, with an estimated +7.8% impact on the CAGR forecast. Customers are pairing batteries with solar PV systems to improve self-consumption and reduce exposure to grid electricity costs. Virtual power plant platforms improve the value of distributed batteries by aggregating residential, commercial and industrial assets for grid services. This model helps utilities manage demand peaks, renewable variability and supply-demand balancing without relying only on centralized power assets. Aggregators also improve customer economics by adding flexibility revenue to bill savings and backup power value. This driver will remain critical through 2032 as Japan expands distributed energy resources and smart grid participation.
Grid resilience and energy security
Grid resilience and energy security support market growth, with an estimated +5.6% impact on the CAGR forecast. Japan’s exposure to earthquakes, typhoons and supply disruption risks increases demand for reliable backup power at homes, businesses and critical facilities. Behind-the-meter storage helps users maintain essential loads during outages and reduce dependence on centralized power supply. Commercial and industrial customers use batteries to protect operations, avoid downtime and strengthen business continuity. Storage also supports national energy security goals by improving local use of renewable power and reducing peak grid stress. This driver will remain important because resilience has become a strategic energy planning priority for households, companies and public institutions.
Lithium-ion/LFP cost decline and performance gains
Lithium-ion/LFP cost decline and performance gains support adoption, with an estimated +4.2% impact on the CAGR forecast. Battery system costs continue to improve as global manufacturing scales and suppliers optimize cell design, pack integration and power electronics. LFP batteries are gaining stronger demand because they offer safety, thermal stability and long cycle life for stationary storage. Better battery management systems improve performance, monitoring and warranty confidence for end users. Cost decline also helps installers, energy service companies and aggregators offer more attractive financing models. The Japan Behind the Meter Energy Storage Market will benefit as lower lifecycle costs expand adoption beyond early users into mainstream residential, commercial and industrial segments.
Government decarbonization and smart energy programs
Government decarbonization and smart energy programs support market expansion, with an estimated +3.8% impact on the CAGR forecast. Japan’s clean energy transition requires distributed resources that can integrate renewable power, manage demand and improve system flexibility. Behind-the-meter storage aligns with these priorities because it supports rooftop solar, demand response, EV charging and efficient power consumption. Smart energy programs also create opportunities for software-led platforms that connect batteries, inverters, solar systems and building energy management tools. Policy support strengthens customer confidence and helps utilities use storage as a flexible grid resource. This driver will support long-term growth across urban load centers and renewable-rich regions.
Key Trends and Opportunities
Expansion of virtual power plants and distributed flexibility platforms
Virtual power plants are becoming a major opportunity as distributed batteries move from standalone backup systems to connected grid assets. Aggregators can manage batteries across homes, offices, factories and public facilities to support demand response and supply-demand balancing. This trend improves battery economics because customers can gain value from both bill savings and grid service participation. Utilities also benefit because distributed flexibility can reduce peak stress and support renewable integration. Suppliers with strong software, inverter control and fleet management capabilities will gain a competitive advantage. Kanto, Kansai/Kinki, Chubu and Kyushu-Okinawa are expected to offer strong opportunities for virtual power plant deployment.
Commercial and industrial energy management adoption
Commercial and industrial customers are creating strong opportunities for medium and large behind-the-meter systems. Facilities are under pressure to control energy costs, improve power reliability and meet sustainability targets. Batteries help users reduce peak demand, optimize tariff exposure and support critical operations. Storage also supports EV charging infrastructure by reducing grid connection stress and smoothing charging loads. Industrial users can combine storage with solar PV, energy management systems and demand response programs to strengthen operational efficiency. This trend will support growth in the 101–500 kW and above 500 kW system capacity segments through 2032.
Battery chemistry diversification and safety-focused procurement
Battery chemistry diversification is emerging as customers evaluate storage systems based on safety, lifecycle cost, duration and installation environment. Lithium-ion will remain dominant, but LFP systems will gain share due to safety and durability advantages. Flow batteries can gain traction in long-duration applications where deep cycling and extended discharge matter. Sodium-ion systems may create future opportunities if suppliers scale cost-effective stationary storage products. Safety-focused procurement will become more important as installations expand in dense urban buildings, commercial facilities and critical infrastructure. Companies that provide certified systems, strong warranties and lifecycle support will be better positioned to win customers.
Key Market Challenges
High upfront cost and payback uncertainty
High upfront cost remains a major challenge for the Japan Behind the Meter Energy Storage Market. Customers must evaluate battery hardware, inverter systems, installation, monitoring software, safety compliance and maintenance costs. Payback periods can vary based on electricity tariffs, solar generation, subsidy access, demand charges and participation in virtual power plant programs. Residential users may delay adoption if they view storage mainly as a backup product instead of a cost-saving asset. Commercial and industrial users need clear financial modeling before investing in larger systems. Financing programs, leasing models and aggregator incentives will be important to reduce this barrier.
Interconnection, aggregation and market participation complexity
Interconnection, aggregation and market participation complexity can slow market adoption. Behind-the-meter systems require coordination among customers, installers, utilities, aggregators and technology providers. Program rules must define metering, dispatch, compensation and customer control clearly. Commercial and industrial users also need assurance that battery dispatch will not affect operations or reduce backup power availability. Complex participation rules can limit the ability of smaller customers to join demand response and virtual power plant programs. Clearer market frameworks will help Japan scale distributed storage as a reliable flexibility resource.
Safety, space constraints and lifecycle management
Safety, space constraints and lifecycle management create key challenges in Japan’s dense built environment. Residential and commercial users need systems that meet fire safety, seismic resilience, ventilation and building requirements. Limited installation space can restrict battery sizing in urban homes, small businesses and older buildings. Customers also need confidence in long-term performance, warranty coverage, recycling and end-of-life handling. These requirements become more important as battery capacity increases in commercial and industrial facilities. Suppliers with strong installation networks, certified systems and lifecycle service capabilities will manage these risks more effectively.
Regional Analysis
Kanto
Kanto led the market with 32% share in 2026, supported by high electricity consumption, dense commercial activity and strong rooftop solar potential across Tokyo, Kanagawa, Saitama and Chiba. The region offers strong demand for residential backup power, commercial peak management and solar PV integrated storage. Businesses in Kanto prioritize reliability, energy cost control and sustainability because the region hosts a large concentration of offices, data centers, retail facilities and industrial users. Virtual power plant programs are also more attractive in Kanto because dense demand supports aggregated flexibility. The region is expected to retain its leading position through 2032.
Kansai/Kinki
Kansai/Kinki accounted for 18% share in 2026, supported by strong demand across Osaka, Kyoto, Hyogo and surrounding prefectures. The region has a broad mix of commercial buildings, public facilities, manufacturers and residential users that can adopt behind-the-meter systems. Storage demand is rising as businesses seek peak demand management, backup power and solar self-consumption. The region’s urban load density creates opportunities for virtual power plant aggregation and distributed flexibility platforms. Commercial and industrial users are expected to support steady growth in medium-capacity systems. Kansai/Kinki will remain one of Japan’s most important regional markets.
Chubu
Chubu held 15% share in 2026, driven by industrial energy demand, manufacturing activity and logistics operations across Aichi, Shizuoka, Gifu, Mie and nearby areas. The region’s automotive, machinery and advanced manufacturing base creates demand for reliable power and cost control. Behind-the-meter systems help industrial users manage peak loads, support renewable energy use and protect operations from outages. The 101–500 kW and above 500 kW capacity segments are expected to gain traction across factories, warehouses and commercial campuses. Chubu will remain a strong market for commercial and industrial storage systems through 2032.
Kyushu-Okinawa
Kyushu-Okinawa accounted for 12% share in 2026, supported by solar generation potential, grid flexibility needs and island resilience requirements. Kyushu’s renewable energy base creates opportunities for batteries that improve solar integration and reduce curtailment pressure. Okinawa and other island systems benefit from storage because local grids need stronger resilience and flexible supply management. Residential solar-plus-storage systems are gaining relevance as households seek backup power and self-consumption. Commercial users also benefit from storage systems that support reliability and lower peak demand. Kyushu-Okinawa is expected to remain one of Japan’s more attractive growth regions.
Tohoku
Tohoku held 9% share in 2026, supported by renewable energy development, disaster resilience planning and demand for distributed backup systems. The region’s exposure to natural disasters strengthens the need for batteries that protect households, public facilities and commercial sites during outages. Behind-the-meter storage can also improve local use of renewable energy and reduce reliance on centralized supply during disruptions. Adoption remains more selective than in Kanto, Kansai/Kinki and Chubu, but long-term growth potential remains strong. Municipal facilities, residential resilience projects and commercial energy management systems will support regional demand.
Chugoku
Chugoku accounted for 6% share in 2026, supported by industrial facilities, commercial buildings and selective solar-plus-storage adoption. The region’s market is shaped by demand from manufacturers, public infrastructure and small commercial users. Behind-the-meter storage supports peak demand management, energy cost optimization and backup power across distributed sites. Growth will depend on project economics, customer awareness and aggregator participation. Commercial and industrial users are expected to remain the main adopters in this region. Chugoku will remain a stable but mid-sized market through 2032.
Hokkaido
Hokkaido held 5% share in 2026, supported by renewable energy resources, grid flexibility needs and resilience requirements in colder and more remote operating conditions. The region offers opportunities for storage systems that smooth renewable generation and improve local power reliability. Commercial facilities, municipalities, industrial users and rural properties can use batteries to support backup power and energy management. Harsh weather conditions increase the need for durable systems and reliable battery performance. Hokkaido will remain strategically important for renewable integration and resilience-focused storage deployment.
Shikoku
Shikoku accounted for 3% share in 2026, making it the smallest regional market. Growth opportunities remain in residential solar-plus-storage, small commercial backup power and local energy resilience. Lower population density limits market scale compared with Kanto, Kansai/Kinki and Chubu. However, public facilities, small businesses and solar customers can use storage to improve self-consumption and outage protection. Adoption will depend on system affordability, installer availability and participation in regional smart energy programs. Shikoku is expected to remain a niche but relevant market for distributed battery systems.
Report Attribute Details
| Report Attribute | Details |
| Historical Period | Not provided |
| Base Year | 2026 |
| Forecast Period | 2027–2032 |
| Market Size in 2026 | USD 548.1 million |
| Market Size in 2032 | USD 1,737.30 million |
| CAGR | 21.20% |
| Segments Covered | Battery Type, System Capacity, Connection, Application, End User and Region |
| Key Companies Covered | Tesla, BYD, Panasonic, LG Energy Solution, Samsung SDI, Enphase Energy, SolarEdge, Schneider Electric, Siemens, ABB, Fluence and CATL |
Company
- Tesla
- BYD
- Panasonic
- LG Energy Solution
- Samsung SDI
- Enphase Energy
- SolarEdge
- Schneider Electric
- Siemens
- ABB
- Fluence
- CATL
Japan Behind the Meter Energy Storage Market Segmentations
By Battery Type
- Lithium-Ion • Lead-Acid • Flow • Sodium-Ion
By System Capacity
- Up to 100 kW • 101–500 kW • Above 500 kW
By Connection
- Standalone • Solar PV Integrated
By Application
- Backup Power • Peak Demand Management • Energy Cost Optimization • Demand Response • EV Charging Support • Renewable Integration
By End User
- Residential • Commercial • Industrial
Recent Developments
- In June 2025, Tesla expanded its virtual power plant business in Japan through a model that provides storage batteries to companies and remotely manages them to support supply-demand balancing.
- In February 2025, Japan approved its 7th Strategic Energy Plan, strengthening policy focus on renewable energy integration, storage batteries and demand response.
- In July 2025, Panasonic reported stronger operating profit in its battery-making energy unit, supported by demand linked to energy storage systems for data centers.
- In May 2026, Panasonic Energy began shipping battery cells for data center applications in Japan, supporting wider demand for stationary energy storage systems.
Report Coverage
The research report offers an in-depth analysis based on battery type, system capacity, connection, application, end user and region. It details leading market players, providing an overview of their business positioning, product offerings, technology relevance and strategic role in the Japan Behind the Meter Energy Storage Market. The report includes insights into the competitive environment, market trends, growth drivers, restraints and opportunities. It also examines solar-plus-storage adoption, virtual power plants, grid resilience, lithium-ion/LFP cost decline and government decarbonization programs as major factors shaping market development. The report assesses the impact of energy security, smart energy platforms, renewable integration and regional demand patterns on market growth. It provides strategic recommendations for battery manufacturers, inverter suppliers, energy service companies, aggregators, utilities, investors and new entrants seeking to navigate Japan’s behind-the-meter storage ecosystem.
Future Outlook
- Demand for behind-the-meter energy storage will continue to rise as Japan prioritizes distributed flexibility, grid resilience and renewable integration.
- Solar PV integrated systems will retain leadership as customers seek higher self-consumption and lower grid dependence.
- Lithium-ion will remain the leading battery type, supported by strong efficiency, supplier availability and improving lifecycle economics.
- LFP systems will gain wider acceptance because customers value safety, durability and lower ownership cost.
- Sodium-ion and flow batteries will create emerging opportunities in stationary storage and long-duration applications.
- Residential users will remain important as households prioritize backup power, rooftop solar integration and energy independence.
- Commercial and industrial users will drive larger system deployments for peak demand management, demand response and EV charging support.
- Virtual power plant programs will become a key growth platform by converting distributed batteries into dispatchable grid assets.
- Kanto will remain the leading regional market, while Kansai/Kinki, Chubu and Kyushu-Okinawa will support strong growth.
- Competition will increase as global battery, inverter and energy management companies compete on cost, safety, software capability and lifecycle service.
Request a Free Sample
Fill in your details and we'll send you a free sample report.
- Sample data tables & charts
- Research methodology
Need a Custom Version of This Report?
Tailor the scope, geography, or segments to your exact requirements.
- Custom geography or segment scope
- Direct access to our analyst team
Frequently Asked Questions
What is the current market size for the Japan Behind the Meter Energy Storage Market and what is its projected size in 2032?
At what CAGR is the Japan Behind the Meter Energy Storage Market projected to grow?
Which battery type segment is expected to lead the Japan Behind the Meter Energy Storage Market?
Which connection segment holds the strongest position in the market?
Which application segment supports strong market demand?
Who are the leading companies in the Japan Behind the Meter Energy Storage Market?
Which region held the largest share in 2026?
Table of Content
Chapter 1. Report Introduction
- 1.1 Report Description & Purpose
- 1.1.1 Report Title & Market Definition
- 1.1.2 Unique Selling Propositions (USP) & Key Differentiators
- 1.1.3 Value Proposition for Stakeholders
- 1.2 Research Objectives
- 1.2.1 Market Sizing Objectives (Volume & Revenue)
- 1.2.2 Segmentation Objectives
- 1.2.3 Competitive Intelligence Objectives
- 1.2.4 Forecast & Scenario Objectives
- 1.3 Report Scope
- 1.3.1 Japan Behind the Meter Energy Storage Scope – Types & Subtypes Covered
- 1.3.2 Geographic Scope – Regions & Countries Covered
- 1.3.3 Historical Period, Base Year & Forecast Period (2026; forecast to 2032)
- 1.3.4 Inclusions & Exclusions
- 1.4 HS Code & Classification Framework
- 1.5 Currency, Units & Pricing Basis
- 1.6 Target Stakeholders
- 1.7 Limitations & Assumptions
Chapter 2. Executive Summary
- 2.1 Global Japan Behind the Meter Energy Storage Market Snapshot
- 2.1.1 Market Size – Historical (2026) & Forecast (2026-2032) (2026: USD 548.1 million → 2032: USD 1,737.30 million)
- 2.1.2 Volume & Revenue – Global Totals
- 2.1.3 Key Market Highlights – Top Five Facts
- 2.2 Japan Behind the Meter Energy Storage Market Segmentation Snapshot
- 2.2.1 Market Split by Region – 2026 vs. 2032
- 2.3 Competitive Snapshot
- 2.3.1 Top 10 Players by Revenue Share – 2026
- 2.3.2 Top 10 Players by Volume Share – 2026
- 2.3.3 Recent Strategic Developments (18-Month Summary)
- 2.4 Key Investment Highlights & Strategic Conclusions
Chapter 3. Japan Behind the Meter Energy Storage Market Dynamics & Industry Analysis
- 3.1 Market Overview & Context
- 3.1.1 Japan Behind the Meter Energy Storage Market Position in the Broader Automotive Value Chain
- 3.1.2 OEM vs. Replacement Market Dynamics
- 3.1.3 Market Maturity & Development Stage by Region
- 3.2 Japan Behind the Meter Energy Storage Market Drivers
- 3.3 Japan Behind the Meter Energy Storage Market Restraints & Challenges
- 3.4 Japan Behind the Meter Energy Storage Market Opportunities
- 3.5 Porter's Five Forces Analysis
- 3.5.1 Threat of New Entrants
- 3.5.2 Bargaining Power of Suppliers
- 3.5.3 Bargaining Power of Buyers
- 3.5.4 Threat of Substitutes
- 3.5.5 Competitive Rivalry – Intensity Assessment
- 3.6 Japan Behind the Meter Energy Storage Value Chain Analysis
- 3.6.1 Upstream – Raw Material/Input Suppliers
- 3.6.1.1 Raw Material/Input 1
- 3.6.1.2 Raw Material/Input 2
- 3.6.1.3 Raw Material/Input 3
- 3.6.2 Midstream – Production/Manufacturing/Service Delivery
- 3.6.2.1 Production/Process Overview
- 3.6.2.2 Key Facility Locations & Capacity by Manufacturer
- 3.6.3 Downstream – Distribution & End Consumer
- 3.6.3.1 Primary Channel – B2B/OEM
- 3.6.3.2 Secondary Channels – Dealer, Retail, Online, Direct
- 3.6.4 Value Chain Profitability Analysis
- 3.6.1 Upstream – Raw Material/Input Suppliers
- 3.7 PESTEL Analysis
- 3.7.1 Political Factors
- 3.7.2 Economic Factors
- 3.7.3 Social Factors
- 3.7.4 Technological Factors
- 3.7.5 Environmental Factors
- 3.7.6 Legal Factors
- 3.8 Japan Behind the Meter Energy Storage Supply Chain Analysis
- 3.8.1 Raw Material/Input Supply Risk Assessment
- 3.8.2 Manufacturing Concentration Risk (Geographic Exposure)
- 3.8.3 Trade Disruption Impact Analysis
- 3.9 Regulatory & Policy Landscape
Note: The regulatory and policy landscape section covers regulations based on their applicability to the market, Japan Behind the Meter Energy Storage category, geography, and scope of the study. Only regulatory frameworks with a material impact on operations, compliance, trade, sustainability, or market access are analyzed in detail.
Chapter 4. Key Investment Pockets & Opportunity Analysis
- 4.1 Japan Behind the Meter Energy Storage Market Attractiveness Analysis
- 4.1.1 By Region – Investment Attractiveness Matrix (Volume × CAGR)
- 4.2 Absolute Revenue Growth Opportunity
- 4.2.1 By Region – Absolute USD Growth Through 2032
- 4.3 Incremental Volume Opportunity
- 4.3.1 By Region – Incremental Volume Through 2032
- 4.3.2 Segment – Incremental Volume
- 4.4 Emerging Submarket Opportunity Deep Dive (Subject to Applicability)
- 4.5 Emerging Market Opportunity Scorecards
- 4.5.1 United States
- 4.5.2 Europe
- 4.5.3 Asia
- 4.5.4 Middle East & Africa
Note: Emerging Market Opportunity Scorecards will be included based on relevance and strategic importance. Regions listed are indicative and may vary depending on data availability and market dynamics.
Chapter 5. Japan Behind the Meter Energy Storage Import-Export Analysis & Trade Flows
- 5.1 Global Trade Overview
- 5.1.1 Global Export Value by Country (2026)
- 5.1.2 Global Export Volume by Country (2026)
- 5.1.3 Global Import Value by Country (2026)
- 5.1.4 Global Import Volume by Country (2026)
- 5.1.5 Net Trade Balance by Country (2026)
- 5.2 Export Analysis – Segment
- 5.2.1 Type 1 (HS Code)
- 5.2.2 Type 2 (HS Code)
- 5.2.3 Type 3 (HS Code)
- 5.2.4 Type 4 (HS Code)
- 5.2.5 Type 5 (HS Code)
- 5.3 Import Analysis – Segment
- 5.3.1 Type 1 (HS Code)
- 5.3.2 Type 2 (HS Code)
- 5.3.3 Type 3 (HS Code)
- 5.3.4 Type 4 (HS Code)
- 5.3.5 Type 5 (HS Code)
- 5.4 Average Unit Trade Prices
- 5.4.1 Average Export Price – Segment & Country
- 5.4.2 Average Import Price – Segment & Source Country
- 5.4.3 Price Trends (2026)
- 5.5 Key Trade Route Analysis
- 5.5.1 Trade Route 1
- 5.5.2 Trade Route 2
- 5.5.3 Trade Route 3
- 5.5.4 Trade Route 4
- 5.5.5 Trade Route 5
- 5.6 Trade Policy Impact Assessment
- 5.6.1 US Anti-Dumping & Section 301 Tariffs
- 5.6.2 EU Customs Union Impact
- 5.6.3 Major Free Trade Agreements
- 5.6.4 USMCA Rules of Origin
Note: Trade policy analysis will be included only where relevant to the Japan Behind the Meter Energy Storage market.
Chapter 6. Competitive Landscape & Company Benchmarking
- 6.1 Japan Behind the Meter Energy Storage Market Concentration & Structure
- 6.1.1 Herfindahl-Hirschman Index (HHI) – vs. 2026
- 6.1.2 Tier 1, Tier 2 & Tier 3 Market Structure
- 6.1.3 Global, Regional & Local Player Dynamics
- 6.2 Japan Behind the Meter Energy Storage Market Share Analysis – 2026
- 6.2.1 Global Revenue Share by Company
- 6.2.2 Global Volume Share by Company
- 6.2.3 Regional Revenue Share
- 6.2.4 Market Share Evolution ( vs. 2026)
- 6.2.5 OEM Segment Share by Company
- 6.2.6 Replacement Segment Share by Company
- 6.3 Production/Delivery Capacity & Facility Analysis
- 6.3.1 Global Installed Capacity
- 6.3.2 Capacity Utilization Rates
- 6.3.3 Production/Output Volume
- 6.3.4 Facility Locations & Capacity Map
- 6.3.5 Planned Capacity Additions
- 6.4 Japan Behind the Meter Energy Storage Competitive Benchmarking Matrix
- 6.4.1 Revenue, Volume, CAGR & Profitability Comparison
- 6.4.2 Channel Revenue Mix
- 6.4.3 Geographic Revenue Exposure
- 6.4.4 R&D Intensity
- 6.4.5 Sustainability Maturity
- 6.5 Strategic Developments in Japan Behind the Meter Energy Storage (Last 24 Months)
- 6.5.1 Mergers, Acquisitions & Divestments
- 6.5.2 New Japan Behind the Meter Energy Storage Launches
- 6.5.3 Facility Expansions
- 6.5.4 Strategic Alliances, Joint Ventures & Partnerships
- 6.5.5 Distribution Expansion & Market Entry
- 6.5.6 Sustainability & ESG Initiatives
- 6.6 Competitive Strategy Mapping
- 6.6.1 Leader, Challenger, Follower & Niche Classification
- 6.6.2 Pricing Strategy Comparison
- 6.6.3 Channel Strategy Matrix
Note: Strategic developments are included based on their materiality and the availability of reliable information.
Chapter 7. Global Japan Behind the Meter Energy Storage Market – By Distribution Channel
- 7.1 Segment Overview
- 7.1.1 Volume & Revenue Split by Channel (2026 & 2032)
- 7.1.2 Channel Mix Evolution (2026-2032)
Chapter 8. Regional Market Analysis – Global Overview
- 8.1 Global Regional Overview
- 8.1.1 Regional Volume Share
- 8.1.2 Regional Revenue Share
- 8.1.3 Regional Volume by Region
- 8.1.4 Regional Revenue by Region
- 8.1.5 Regional Forecast Through 2032
- 8.2 Cross-Regional Segment Analysis
- 8.2.1 By Distribution Channel
- 8.2.2 By Brand/Price Tier
Chapter 9. North America Japan Behind the Meter Energy Storage Market
- 9.1 United States
- 9.2 Canada
- 9.3 Mexico
Chapter 10. Europe Japan Behind the Meter Energy Storage Market
- 10.1 Germany
- 10.2 France
- 10.3 Italy
- 10.4 United Kingdom
- 10.5 Spain
- 10.6 Poland
- 10.7 Russia
- 10.8 Netherlands
- 10.9 Belgium
- 10.10 Sweden
- 10.11 Denmark
- 10.12 Norway
- 10.13 Rest of Europe
Chapter 11. Asia Pacific Japan Behind the Meter Energy Storage Market
- 11.1 China
- 11.2 India
- 11.3 Japan
- 11.4 South Korea
- 11.5 Thailand
- 11.6 Indonesia
- 11.7 Vietnam
- 11.8 Malaysia
- 11.9 Australia
- 11.10 Rest of Asia Pacific
Chapter 12. Latin America Japan Behind the Meter Energy Storage Market
- 12.1 Brazil
- 12.2 Argentina
- 12.3 Colombia
- 12.4 Chile
- 12.5 Rest of Latin America
Chapter 13. Middle East Japan Behind the Meter Energy Storage Market
- 13.1 Saudi Arabia
- 13.2 United Arab Emirates
- 13.3 Turkey
- 13.4 Israel
- 13.5 Iran
- 13.6 Rest of the Middle East
Chapter 14. Africa Japan Behind the Meter Energy Storage Market
- 14.1 South Africa
- 14.2 Egypt
- 14.3 Nigeria
- 14.4 Morocco
- 14.5 Rest of Africa
Chapter 15. Japan Behind the Meter Energy Storage Company Profiles
- 15.1 [Company 01]
- 15.1.1 Company Overview
- 15.1.2 Key Management Personnel
- 15.1.3 Products & Services Portfolio
- 15.1.4 Financial Performance
- 15.1.5 Key Market Focus & Geographic Presence
- 15.1.6 Recent Developments & Strategic Initiatives
Note: The company profile list is preliminary and may change based on research findings, market developments, data availability, and client requirements.
Chapter 16. Appendices
- Appendix A – List of Abbreviations & Acronyms
- Appendix B – Industry Classification Code Reference – Full Series
- Appendix C – Production & Capacity Data Tables
- Appendix D – End-Use & Demand Base Tables
- Appendix E – Consumption & Replacement Rate Assumptions
- Appendix F – ASP Reference Tables
- Appendix G – Manufacturing & Facility Database
- Appendix H – Import-Export Data Tables
- Appendix I – Regulatory Summary Tables
- Appendix J – Primary Research Participant List (Anonymized)
- Appendix K – Primary Research Questionnaire Framework
- Appendix L – Data Sources & Bibliography
- Appendix M – Market Size Divergence & Source Comparison
Chapter 17. Research Methodology
- 17.1 Research Framework & Philosophy
- 17.2 Secondary Research – Sources, Hierarchy & Data Extraction
- 17.3 Data Modeling – Bottom-Up & Top-Down Market Sizing
- 17.4 Primary Research – Stakeholder Framework, LOI & Sample Sizes
- 17.5 Forecast Methodology – Regression, Scenario & Sensitivity Analysis
- 17.6 Quality Control – Four-Layer Validation Framework
- 17.7 Limitations & Standard Assumptions
- 17.8 Disclaimer
