
Distribution Voltage Regulator Market Overview:
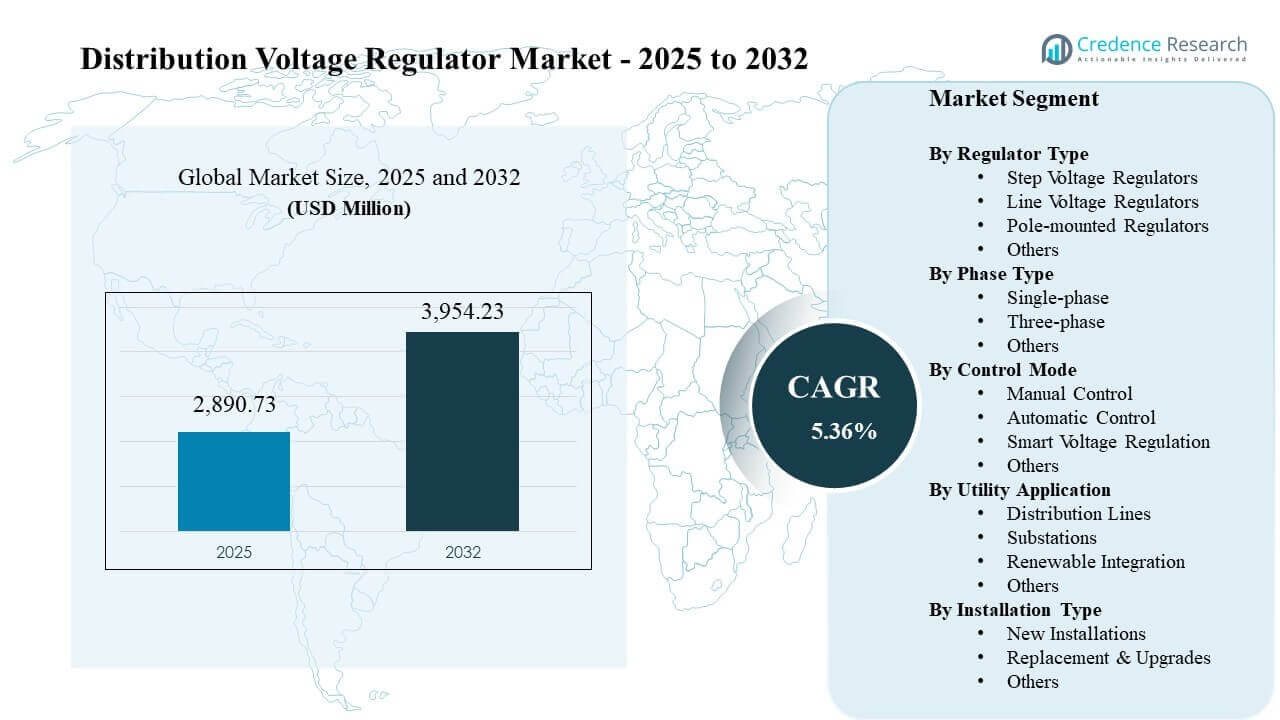
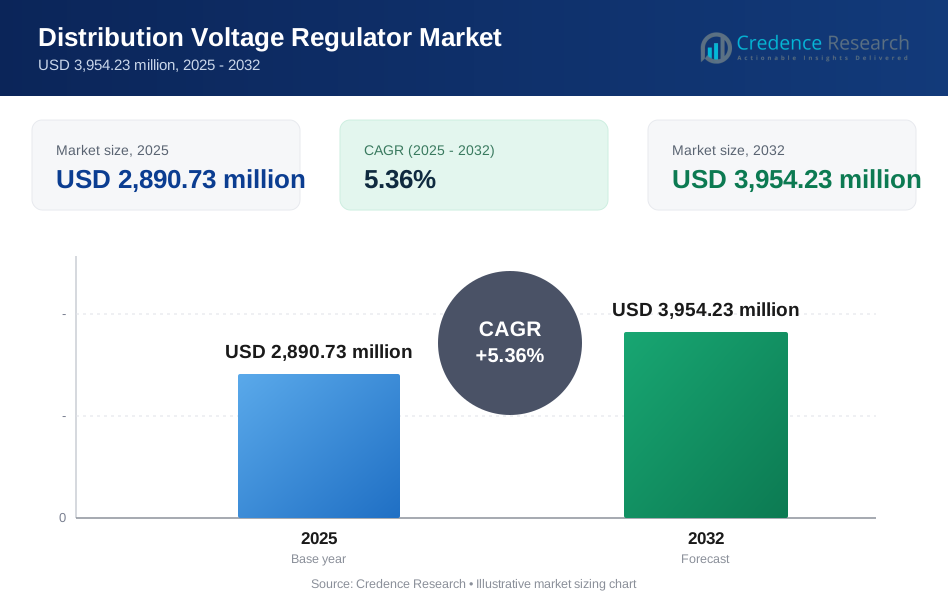
The Distribution Voltage Regulator Market size was estimated at USD 2,890.73 million in 2025 and is expected to reach USD 3,954.23 million by 2032, growing at a CAGR of 5.36% from 2025 to 2032. Growth is primarily supported by utility investments in feeder voltage optimization that reduce technical losses, stabilize end-user voltage, and improve reliability under increasingly variable load patterns. Asia Pacific remains the largest regional contributor, supported by grid expansion, urbanization, and accelerated integration of renewables that increases voltage variability across distribution networks.
| REPORT ATTRIBUTE | DETAILS |
|---|---|
| Historical Period | 2020-2024 |
| Base Year | 2025 |
| Forecast Period | 2026-2032 |
| Distribution Voltage Regulator Market Size 2025 | USD 2,890.73 million |
| Distribution Voltage Regulator Market, CAGR | 5.36% |
| Distribution Voltage Regulator Market Size 2032 | USD 3,954.23 million |
Key Market Trends & Insights
- The market is projected to expand from USD 2,890.73 million in 2025 to USD 3,954.23 million by 2032, reflecting a 5.36% CAGR over 2025–2032.
- Asia Pacific led regional demand with a 42.2% revenue share in 2025, reflecting accelerated distribution build-out and voltage-control needs.
- North America accounted for 30.1% share in 2025, supported by replacement cycles for aging assets and reliability-driven upgrades.
- Three-phase regulators represented 61.8% share in 2025, driven by substation and high-load feeder requirements.
- Smart Voltage Regulation captured 66.6% share in 2025, reflecting adoption of digital controls and remote monitoring capabilities.
Segment Analysis
Utilities are prioritizing voltage regulation solutions that improve power quality on distribution feeders where demand volatility is increasing due to electrification, industrial load swings, and expanding distributed generation. Buyers increasingly weigh lifecycle reliability, maintenance intervals, interoperability with utility communications, and the ability to support remote configuration and event logging. Smart control adoption is strengthened by utility requirements for faster response and more precise voltage profiles in mixed-load areas.
Demand is also supported by replacement and upgrade projects where legacy regulators are being refreshed to improve operating efficiency and reduce outage time. Utilities are increasingly aligning regulator selection with broader feeder automation and reliability programs, which favors control intelligence and operational visibility. Procurement decisions commonly reflect a mix of technical specifications, service networks, lead time, and total cost of ownership, particularly for high-volume replacement programs.
By Regulator Type Insights
Step Voltage Regulators remain widely deployed in distribution networks because they support consistent voltage profiles across long feeders and changing load conditions. Line Voltage Regulators are commonly selected where utilities need targeted control along feeder sections that experience higher voltage drop. Pole-mounted Regulators continue to be favored in constrained corridors because they enable flexible deployment and easier access for maintenance. Broader grid modernization increases demand for regulator configurations that simplify installation and support remote diagnostics.
By Phase Type Insights
Three-phase accounted for the largest share of 61.8% in 2025. This lead is supported by deployment across substations and high-load feeders where phase balancing and voltage consistency are critical for reliability. Utilities often prefer three-phase solutions to stabilize voltage profiles for industrial and commercial customers with sensitive equipment. The segment benefits from standardization preferences that reduce complexity across utility fleets.
By Control Mode Insights
Smart Voltage Regulation accounted for the largest share of 66.6% in 2025. Utilities are moving toward intelligent controls that improve operational visibility, enable remote configuration, and support faster corrective actions during voltage events. Smart control adoption aligns with feeder automation initiatives and improves compatibility with utility supervisory systems. The segment remains favored where renewable integration increases voltage variability and utilities need tighter voltage management.
By Utility Application Insights
Distribution Lines represent the most common deployment environment because utilities need to manage voltage drop and variability across long feeders with mixed customer loads. Substations remain an important application for centralized control that supports stability at key network nodes. Renewable Integration continues to expand as an application area because variable generation introduces voltage swings that require faster and more precise regulation. Utilities increasingly align application priorities with reliability metrics and customer power-quality expectations.
By Installation Type Insights
Replacement & Upgrades remain a core demand source as utilities refresh aging regulators to improve reliability and reduce maintenance burden. New Installations grow alongside distribution network expansion, urban development, and electrification programs that extend or densify feeder infrastructure. Utilities often combine both pathways within the same capital plan to balance growth projects with resilience and modernization. Installation decisions are increasingly tied to lifecycle cost, deployment speed, and compatibility with digital monitoring approaches.
Distribution Voltage Regulator Market Drivers
Grid modernization and reliability investments
Utilities are upgrading distribution infrastructure to improve reliability, reduce outages, and strengthen voltage performance across feeders serving mixed loads. Voltage regulation supports tighter voltage bands that protect sensitive equipment and reduce the frequency of customer complaints. Modernization programs also prioritize assets that integrate with broader automation architectures and improve operational visibility. This driver is reinforced by rising expectations for service continuity from industrial, commercial, and critical infrastructure users.
- For instance, Duke Energy Florida reported that in 2025 its self-healing grid technology helped avoid more than 280,000 extended outages, saved customers more than 300,000 outage hours, and can often restore power in less than a minute while reducing the number of customers affected by an outage by as much as 75%.
Renewable integration and distribution volatility
Distributed solar and other renewables introduce intermittency that can cause local voltage rise, rapid fluctuations, and reverse power flow on feeders not designed for two-way energy movement. Voltage regulators help utilities maintain stable voltage profiles and reduce the risk of protection miscoordination. Utilities increasingly deploy smarter regulation strategies that can react to changing conditions and align with grid codes. As renewable penetration increases, regulators become an enabling component for maintaining power quality.
- For instance, Hawaiian Electric stated that its grids hosted 120,570 rooftop solar systems and about 1.6 GW of solar capacity in 2025, while its grid modernization program uses advanced inverters that respond to changes in rooftop solar output to reduce impacts on neighboring customers’ service quality.
Growth in electricity demand from electrification
Electrification across transport, buildings, and industry increases peak loads and creates new demand patterns that stress distribution networks. These changes intensify voltage drop risks on long feeders and raise the value of targeted voltage support. Regulators help utilities preserve service quality as new loads such as EV charging and heat pumps expand. Utilities often select configurations that support scalable deployment across growth corridors and newly developed areas.
Expansion of digital controls and remote operations
Utilities are adopting digital operating models that depend on telemetry, event logging, and remote adjustment to improve response time and reduce field dispatch costs. Smart voltage regulation supports these priorities by enabling remote tap control and better operational insight. This driver also aligns with workforce constraints and the need to maintain reliability with fewer field interventions. Solutions that support interoperability and secure communications are increasingly favored in procurement decisions.
Distribution Voltage Regulator Market Challenges
Utilities face procurement and deployment constraints driven by lead times for critical components, qualification cycles, and the need to standardize across diverse networks. Installation complexity can increase in densely built areas where outage windows are limited and access is constrained. Integration with legacy systems also remains a barrier when utilities require interoperability with older communications and supervisory tools. These factors can slow rollout speed even when capital budgets are available.
- For instance, Siemens states that its SICAM A8000 platform supports IEC 61850 Edition 1 and 2, DNP3 Master/Slave over serial and TCP/IP, and Modbus RTU/TCP, while the CP-8050 can be extended to a maximum of 34 interfaces and up to 2,048 I/Os, showing how utilities often favor highly modular, standards-based equipment to reduce interoperability risk across mixed network environments.
The market also faces challenges related to lifecycle management, including maintenance planning, spares availability, and ensuring consistent performance across varied climate and loading conditions. Utilities must balance cost with durability and serviceability, especially in high-volume replacement programs. Cybersecurity and secure remote access requirements add further complexity for smart control deployments. Vendor qualification requirements and performance testing can extend purchase cycles and delay deployment.
Market Trends and Opportunities
Utilities are increasingly aligning voltage regulation with feeder automation strategies that combine sensing, controls, and communications to optimize voltage profiles in near real time. This creates opportunities for suppliers that offer integrated regulator controls compatible with supervisory platforms and modern utility communications. Demand is also expanding for compact and modular designs that reduce footprint and simplify deployment in constrained environments. Offerings that improve diagnostic visibility and reduce maintenance visits gain stronger consideration in utility selection criteria.
- For instance, Beckwith Electric’s M-2979 cabinet with the M-7679 R-PAC accepts Serial TIA-232, TIA-485, fiber-optic, IRIG-B, and optional embedded Ethernet communications, provides multi-user access to advanced metering, power-quality, and digital-fault-recording data, and packages the aluminum unit in a 28.78 x 17.75 x 14.11 inch enclosure weighing about 30.4 lb with IP55 protection and an operating range of -40°C to +85°C without batteries, highlighting a compact and diagnostics-rich approach to field deployment.
Opportunities also rise from targeted solutions supporting renewable-heavy feeders and rapidly growing load corridors, where utilities need faster response and tighter voltage control. Advanced control algorithms and data-driven settings management can improve outcomes without extensive physical reconfiguration. Replacement and upgrade programs create a steady demand foundation, particularly where utilities are transitioning from manual or basic automatic controls to smarter regulation. Service models that support commissioning, firmware lifecycle management, and long-term maintenance can strengthen supplier positioning.
Regional Insights
North America
North America held a 30.1% share in 2025, supported by replacement demand for aging regulators and reliability-focused upgrades across distribution networks. Utilities prioritize solutions that improve feeder voltage performance and reduce outage duration in high-load service areas. Smart control adoption is strengthened by broader distribution automation and remote operations models. Supplier selection often favors proven reliability, service coverage, and compatibility with utility operating standards.
Europe
Europe captured an 18.1% share in 2025, supported by distribution reinforcement needs and voltage variability linked to renewable integration. Utilities emphasize power-quality performance, interoperability, and lifecycle efficiency as they modernize distribution infrastructure. Adoption is shaped by regulatory expectations for service quality and increasing electrification load. Deployment often reflects a balance between targeted upgrades and broader automation programs.
Asia Pacific
Asia Pacific led with a 42.2% share in 2025, supported by grid expansion, urbanization, and rising electricity demand that increases voltage control requirements. Utilities in the region prioritize scalable deployment models and equipment suited for diverse grid conditions. Renewable additions heighten the need for precise voltage control on mixed-load feeders, strengthening the case for smarter regulation approaches. Supplier competitiveness is influenced by cost-performance balance, lead time, and local support capabilities.
Latin America
Latin America represented a 5.9% share in 2025, driven by selective distribution upgrades, loss-reduction initiatives, and reliability improvement programs. Utilities focus on solutions that improve voltage performance in underserved corridors and reduce technical losses across long feeders. Budget variability and procurement cycles can moderate rollout speed, creating uneven demand across countries. Deployment momentum increases where electrification and renewable projects expand voltage variability.
Middle East & Africa
Middle East and Africa accounted for a 3.7% share in 2025, supported by grid expansion programs and reliability upgrades in select markets. Utilities often prioritize durable equipment suitable for challenging climate conditions and wide operating ranges. Demand is strongest where electrification programs, urban development, and industrial projects expand distribution networks. Investment concentration and project-based procurement shape overall volumes and adoption pace.
Competitive Landscape
Competition is shaped by product reliability, control intelligence, and the ability to support utility specifications across diverse grid environments. Suppliers differentiate through smart control capabilities, interoperability, service coverage, and support for commissioning and lifecycle maintenance. Portfolio breadth across distribution equipment and relationships with utility procurement teams influence market access. Lead time, localized manufacturing footprints, and aftersales support continue to be important decision factors for large replacement and upgrade programs.
Eaton maintains strong positioning through distribution-focused power management offerings and an emphasis on scalable production and utility-grade reliability. The company’s approach aligns with demand for voltage regulation solutions that support modernization programs and fleet-level replacement cycles. Its operational focus supports faster delivery and reinforces utility confidence in long-term serviceability. Eaton’s broad distribution footprint strengthens competitiveness in large, multi-year infrastructure programs and utility standardization efforts.
The industry research and growth report includes detailed analyses of the competitive landscape of the market and information about key companies, including:
- Eaton
- Siemens
- ABB
- General Electric
- Hitachi Energy
- Howard Industries
- Schneider Electric
- Mitsubishi Electric
- Toshiba Energy Systems
- Powell Industries
Qualitative and quantitative analysis of companies has been conducted to help clients understand the wider business environment as well as the strengths and weaknesses of key industry players. Data is qualitatively analyzed to categorize companies as pure play, category-focused, industry-focused, and diversified; it is quantitatively analyzed to categorize companies as dominant, leading, strong, tentative, and weak.
Recent Developments
- In June 2025, Hitachi Energy launched its Compact Line Voltage Regulator (C-LVR), positioning it as a transformer-integrated and compact solution for modern distribution grids.
- In October 2025, Eaton completed a major expansion at its Nacogdoches, Texas facility, increasing U.S. manufacturing capacity for voltage regulators and related distribution equipment.
- In March 2026, Eaton released an updated firmware package for its CL-7 voltage regulator control platform, supporting improved telemetry and operational stability.
Report Scope
| Report Attribute | Details |
| Market size value in 2025 | USD 2,890.73 million |
| Revenue forecast in 2032 | USD 3,954.23 million |
| Growth rate (CAGR) | 5.36% (2025–2032) |
| Base year | 2025 |
| Forecast period | 2026-2032 |
| Quantitative units | USD million |
| Segments covered | By Regulator Type Outlook: Step Voltage Regulators, Line Voltage Regulators, Pole-mounted Regulators, Others; By Phase Type Outlook: Single-phase, Three-phase, Others; By Control Mode Outlook: Manual Control, Automatic Control, Smart Voltage Regulation, Others; By Utility Application Outlook: Distribution Lines, Substations, Renewable Integration, Others; By Installation Type Outlook: New Installations, Replacement & Upgrades, Others |
| Regional scope | North America, Europe, Asia Pacific, Latin America, Middle East & Africa |
| Key companies profiled | Eaton, Siemens, ABB, General Electric, Hitachi Energy, Howard Industries, Schneider Electric, Mitsubishi Electric, Toshiba Energy Systems, Powell Industries |
| No. of Pages | 345 |
Segmentation
By Regulator Type
- Step Voltage Regulators
- Line Voltage Regulators
- Pole-mounted Regulators
- Others
By Phase Type
- Single-phase
- Three-phase
- Others
By Control Mode
- Manual Control
- Automatic Control
- Smart Voltage Regulation
- Others
By Utility Application
- Distribution Lines
- Substations
- Renewable Integration
- Others
By Installation Type
- New Installations
- Replacement & Upgrades
- Others
By Region
- North America
- U.S.
- Canada
- Mexico
- Europe
- Germany
- France
- U.K.
- Italy
- Spain
- Rest of Europe
- Asia Pacific
- China
- Japan
- India
- South Korea
- South-east Asia
- Rest of Asia Pacific
- Latin America
- Brazil
- Argentina
- Rest of Latin America
- Middle East & Africa
- GCC Countries
- South Africa
- Rest of the Middle East and Africa
Request a Free Sample
Fill in your details and we'll send you a free sample report.
- Sample data tables & charts
- Research methodology
Need a Custom Version of This Report?
Tailor the scope, geography, or segments to your exact requirements.
- Custom geography or segment scope
- Direct access to our analyst team
Frequently Asked Questions
What is the market size of the Distribution Voltage Regulator Market in 2025 and its forecast for 2032?
What is the CAGR for the Distribution Voltage Regulator Market during 2025–2032?
What is the largest segment in 2025?
What factors are driving growth in this market?
Who are the leading companies in the Distribution Voltage Regulator Market?
Which region leads the market in 2025?
Table of Content
Chapter 1. Report Introduction
- 1.1 Report Description & Purpose
- 1.1.1 Report Title & Market Definition
- 1.1.2 Unique Selling Propositions (USP) & Key Differentiators
- 1.1.3 Value Proposition for Stakeholders
- 1.2 Research Objectives
- 1.2.1 Market Sizing Objectives (Volume & Revenue)
- 1.2.2 Segmentation Objectives
- 1.2.3 Competitive Intelligence Objectives
- 1.2.4 Forecast & Scenario Objectives
- 1.3 Report Scope
- 1.3.1 Distribution Voltage Regulator Scope – Types & Subtypes Covered
- 1.3.2 Geographic Scope – Regions & Countries Covered
- 1.3.3 Historical Period, Base Year & Forecast Period (2025; forecast to 2032)
- 1.3.4 Inclusions & Exclusions
- 1.4 HS Code & Classification Framework
- 1.5 Currency, Units & Pricing Basis
- 1.6 Target Stakeholders
- 1.7 Limitations & Assumptions
Chapter 2. Executive Summary
- 2.1 Global Distribution Voltage Regulator Market Snapshot
- 2.1.1 Market Size – Historical (2025) & Forecast (2025-2032) (2025: USD 2,890.73 million → 2032: USD 3,954.23 million)
- 2.1.2 Volume & Revenue – Global Totals
- 2.1.3 Key Market Highlights – Top Five Facts
- 2.2 Distribution Voltage Regulator Market Segmentation Snapshot
- 2.2.1 Market Split by Region – 2025 vs. 2032
- 2.3 Competitive Snapshot
- 2.3.1 Top 10 Players by Revenue Share – 2025
- 2.3.2 Top 10 Players by Volume Share – 2025
- 2.3.3 Recent Strategic Developments (18-Month Summary)
- 2.4 Key Investment Highlights & Strategic Conclusions
Chapter 3. Distribution Voltage Regulator Market Dynamics & Industry Analysis
- 3.1 Market Overview & Context
- 3.1.1 Distribution Voltage Regulator Market Position in the Broader Automotive Value Chain
- 3.1.2 OEM vs. Replacement Market Dynamics
- 3.1.3 Market Maturity & Development Stage by Region
- 3.2 Distribution Voltage Regulator Market Drivers
- 3.3 Distribution Voltage Regulator Market Restraints & Challenges
- 3.4 Distribution Voltage Regulator Market Opportunities
- 3.5 Porter's Five Forces Analysis
- 3.5.1 Threat of New Entrants
- 3.5.2 Bargaining Power of Suppliers
- 3.5.3 Bargaining Power of Buyers
- 3.5.4 Threat of Substitutes
- 3.5.5 Competitive Rivalry – Intensity Assessment
- 3.6 Distribution Voltage Regulator Value Chain Analysis
- 3.6.1 Upstream – Raw Material/Input Suppliers
- 3.6.1.1 Raw Material/Input 1
- 3.6.1.2 Raw Material/Input 2
- 3.6.1.3 Raw Material/Input 3
- 3.6.2 Midstream – Production/Manufacturing/Service Delivery
- 3.6.2.1 Production/Process Overview
- 3.6.2.2 Key Facility Locations & Capacity by Manufacturer
- 3.6.3 Downstream – Distribution & End Consumer
- 3.6.3.1 Primary Channel – B2B/OEM
- 3.6.3.2 Secondary Channels – Dealer, Retail, Online, Direct
- 3.6.4 Value Chain Profitability Analysis
- 3.6.1 Upstream – Raw Material/Input Suppliers
- 3.7 PESTEL Analysis
- 3.7.1 Political Factors
- 3.7.2 Economic Factors
- 3.7.3 Social Factors
- 3.7.4 Technological Factors
- 3.7.5 Environmental Factors
- 3.7.6 Legal Factors
- 3.8 Distribution Voltage Regulator Supply Chain Analysis
- 3.8.1 Raw Material/Input Supply Risk Assessment
- 3.8.2 Manufacturing Concentration Risk (Geographic Exposure)
- 3.8.3 Trade Disruption Impact Analysis
- 3.9 Regulatory & Policy Landscape
Note: The regulatory and policy landscape section covers regulations based on their applicability to the market, Distribution Voltage Regulator category, geography, and scope of the study. Only regulatory frameworks with a material impact on operations, compliance, trade, sustainability, or market access are analyzed in detail.
Chapter 4. Key Investment Pockets & Opportunity Analysis
- 4.1 Distribution Voltage Regulator Market Attractiveness Analysis
- 4.1.1 By Region – Investment Attractiveness Matrix (Volume × CAGR)
- 4.2 Absolute Revenue Growth Opportunity
- 4.2.1 By Region – Absolute USD Growth Through 2032
- 4.3 Incremental Volume Opportunity
- 4.3.1 By Region – Incremental Volume Through 2032
- 4.3.2 Segment – Incremental Volume
- 4.4 Emerging Submarket Opportunity Deep Dive (Subject to Applicability)
- 4.5 Emerging Market Opportunity Scorecards
- 4.5.1 United States
- 4.5.2 Europe
- 4.5.3 Asia
- 4.5.4 Middle East & Africa
Note: Emerging Market Opportunity Scorecards will be included based on relevance and strategic importance. Regions listed are indicative and may vary depending on data availability and market dynamics.
Chapter 5. Distribution Voltage Regulator Import-Export Analysis & Trade Flows
- 5.1 Global Trade Overview
- 5.1.1 Global Export Value by Country (2025)
- 5.1.2 Global Export Volume by Country (2025)
- 5.1.3 Global Import Value by Country (2025)
- 5.1.4 Global Import Volume by Country (2025)
- 5.1.5 Net Trade Balance by Country (2025)
- 5.2 Export Analysis – Segment
- 5.2.1 Type 1 (HS Code)
- 5.2.2 Type 2 (HS Code)
- 5.2.3 Type 3 (HS Code)
- 5.2.4 Type 4 (HS Code)
- 5.2.5 Type 5 (HS Code)
- 5.3 Import Analysis – Segment
- 5.3.1 Type 1 (HS Code)
- 5.3.2 Type 2 (HS Code)
- 5.3.3 Type 3 (HS Code)
- 5.3.4 Type 4 (HS Code)
- 5.3.5 Type 5 (HS Code)
- 5.4 Average Unit Trade Prices
- 5.4.1 Average Export Price – Segment & Country
- 5.4.2 Average Import Price – Segment & Source Country
- 5.4.3 Price Trends (2025)
- 5.5 Key Trade Route Analysis
- 5.5.1 Trade Route 1
- 5.5.2 Trade Route 2
- 5.5.3 Trade Route 3
- 5.5.4 Trade Route 4
- 5.5.5 Trade Route 5
- 5.6 Trade Policy Impact Assessment
- 5.6.1 US Anti-Dumping & Section 301 Tariffs
- 5.6.2 EU Customs Union Impact
- 5.6.3 Major Free Trade Agreements
- 5.6.4 USMCA Rules of Origin
Note: Trade policy analysis will be included only where relevant to the Distribution Voltage Regulator market.
Chapter 6. Competitive Landscape & Company Benchmarking
- 6.1 Distribution Voltage Regulator Market Concentration & Structure
- 6.1.1 Herfindahl-Hirschman Index (HHI) – vs. 2025
- 6.1.2 Tier 1, Tier 2 & Tier 3 Market Structure
- 6.1.3 Global, Regional & Local Player Dynamics
- 6.2 Distribution Voltage Regulator Market Share Analysis – 2025
- 6.2.1 Global Revenue Share by Company
- 6.2.2 Global Volume Share by Company
- 6.2.3 Regional Revenue Share
- 6.2.4 Market Share Evolution ( vs. 2025)
- 6.2.5 OEM Segment Share by Company
- 6.2.6 Replacement Segment Share by Company
- 6.3 Production/Delivery Capacity & Facility Analysis
- 6.3.1 Global Installed Capacity
- 6.3.2 Capacity Utilization Rates
- 6.3.3 Production/Output Volume
- 6.3.4 Facility Locations & Capacity Map
- 6.3.5 Planned Capacity Additions
- 6.4 Distribution Voltage Regulator Competitive Benchmarking Matrix
- 6.4.1 Revenue, Volume, CAGR & Profitability Comparison
- 6.4.2 Channel Revenue Mix
- 6.4.3 Geographic Revenue Exposure
- 6.4.4 R&D Intensity
- 6.4.5 Sustainability Maturity
- 6.5 Strategic Developments in Distribution Voltage Regulator (Last 24 Months)
- 6.5.1 Mergers, Acquisitions & Divestments
- 6.5.2 New Distribution Voltage Regulator Launches
- 6.5.3 Facility Expansions
- 6.5.4 Strategic Alliances, Joint Ventures & Partnerships
- 6.5.5 Distribution Expansion & Market Entry
- 6.5.6 Sustainability & ESG Initiatives
- 6.6 Competitive Strategy Mapping
- 6.6.1 Leader, Challenger, Follower & Niche Classification
- 6.6.2 Pricing Strategy Comparison
- 6.6.3 Channel Strategy Matrix
Note: Strategic developments are included based on their materiality and the availability of reliable information.
Chapter 7. Global Distribution Voltage Regulator Market – By Distribution Channel
- 7.1 Segment Overview
- 7.1.1 Volume & Revenue Split by Channel (2025 & 2032)
- 7.1.2 Channel Mix Evolution (2025-2032)
Chapter 8. Regional Market Analysis – Global Overview
- 8.1 Global Regional Overview
- 8.1.1 Regional Volume Share
- 8.1.2 Regional Revenue Share
- 8.1.3 Regional Volume by Region
- 8.1.4 Regional Revenue by Region
- 8.1.5 Regional Forecast Through 2032
- 8.2 Cross-Regional Segment Analysis
- 8.2.1 By Distribution Channel
- 8.2.2 By Brand/Price Tier
Chapter 9. North America Distribution Voltage Regulator Market
- 9.1 United States
- 9.2 Canada
- 9.3 Mexico
Chapter 10. Europe Distribution Voltage Regulator Market
- 10.1 Germany
- 10.2 France
- 10.3 Italy
- 10.4 United Kingdom
- 10.5 Spain
- 10.6 Poland
- 10.7 Russia
- 10.8 Netherlands
- 10.9 Belgium
- 10.10 Sweden
- 10.11 Denmark
- 10.12 Norway
- 10.13 Rest of Europe
Chapter 11. Asia Pacific Distribution Voltage Regulator Market
- 11.1 China
- 11.2 India
- 11.3 Japan
- 11.4 South Korea
- 11.5 Thailand
- 11.6 Indonesia
- 11.7 Vietnam
- 11.8 Malaysia
- 11.9 Australia
- 11.10 Rest of Asia Pacific
Chapter 12. Latin America Distribution Voltage Regulator Market
- 12.1 Brazil
- 12.2 Argentina
- 12.3 Colombia
- 12.4 Chile
- 12.5 Rest of Latin America
Chapter 13. Middle East Distribution Voltage Regulator Market
- 13.1 Saudi Arabia
- 13.2 United Arab Emirates
- 13.3 Turkey
- 13.4 Israel
- 13.5 Iran
- 13.6 Rest of the Middle East
Chapter 14. Africa Distribution Voltage Regulator Market
- 14.1 South Africa
- 14.2 Egypt
- 14.3 Nigeria
- 14.4 Morocco
- 14.5 Rest of Africa
Chapter 15. Distribution Voltage Regulator Company Profiles
- 15.1 [Company 01]
- 15.1.1 Company Overview
- 15.1.2 Key Management Personnel
- 15.1.3 Products & Services Portfolio
- 15.1.4 Financial Performance
- 15.1.5 Key Market Focus & Geographic Presence
- 15.1.6 Recent Developments & Strategic Initiatives
Note: The company profile list is preliminary and may change based on research findings, market developments, data availability, and client requirements.
Chapter 16. Appendices
- Appendix A – List of Abbreviations & Acronyms
- Appendix B – Industry Classification Code Reference – Full Series
- Appendix C – Production & Capacity Data Tables
- Appendix D – End-Use & Demand Base Tables
- Appendix E – Consumption & Replacement Rate Assumptions
- Appendix F – ASP Reference Tables
- Appendix G – Manufacturing & Facility Database
- Appendix H – Import-Export Data Tables
- Appendix I – Regulatory Summary Tables
- Appendix J – Primary Research Participant List (Anonymized)
- Appendix K – Primary Research Questionnaire Framework
- Appendix L – Data Sources & Bibliography
- Appendix M – Market Size Divergence & Source Comparison
Chapter 17. Research Methodology
- 17.1 Research Framework & Philosophy
- 17.2 Secondary Research – Sources, Hierarchy & Data Extraction
- 17.3 Data Modeling – Bottom-Up & Top-Down Market Sizing
- 17.4 Primary Research – Stakeholder Framework, LOI & Sample Sizes
- 17.5 Forecast Methodology – Regression, Scenario & Sensitivity Analysis
- 17.6 Quality Control – Four-Layer Validation Framework
- 17.7 Limitations & Standard Assumptions
- 17.8 Disclaimer
