Market Overview
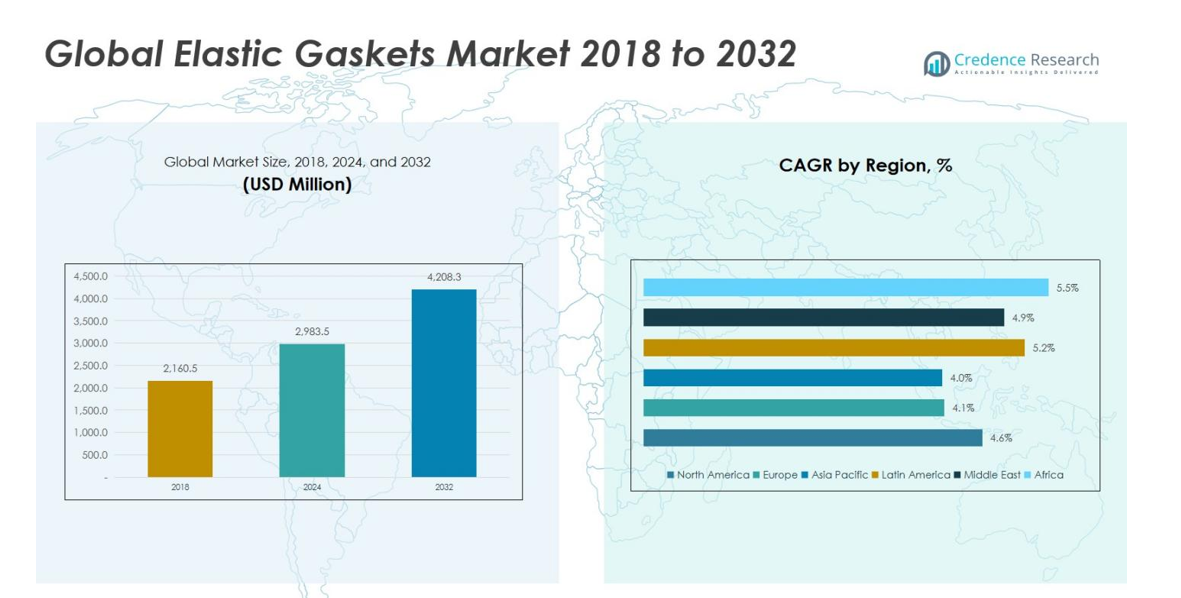
The Global Elastic Gaskets Market size was valued at USD 2,160.5 million in 2018, is expected to reach USD 2,983.5 million in 2024, and is anticipated to grow to USD 4,208.3 million by 2032, at a CAGR of 4.34% during the forecast period.
| REPORT ATTRIBUTE |
DETAILS |
| Historical Period |
2020-2023 |
| Base Year |
2024 |
| Forecast Period |
2025-2032 |
| Elastic Gaskets Market Size 2024 |
USD 2,983.5 million |
| Elastic Gaskets Market, CAGR |
4.34% |
| Elastic Gaskets Market Size 2032 |
USD 4,208.3 million |
The Global Elastic Gaskets Market is characterized by the presence of several prominent players, including Denver Rubber Company, DowDuPont Inc., ElringKlinger AG, NOK Corporation, and Boyd Corporation. These companies maintain strong market positions through continuous innovation, material advancements, and expansion of manufacturing capabilities. Strategic mergers, partnerships, and product diversification further strengthen their global footprint. Among all regions, Asia-Pacific dominates the market with a 41% share in 2024, driven by rapid industrialization, robust automotive production, and increasing demand for efficient sealing solutions across manufacturing and infrastructure sectors. This regional leadership is supported by a well-established supply chain network and rising investment in high-performance elastomer technologies.
Market Insights
- The Global Elastic Gaskets Market was valued at USD 2,983.53 million in 2024 and is projected to reach USD 4,208.3 million by 2032, growing at a CAGR of 4.34% during the forecast period.
- Rising automotive production and technological advancements in elastomeric materials drive market expansion, with the automotive segment holding a 35% share due to increasing demand for durable and heat-resistant gaskets.
- The market is witnessing trends toward eco-friendly, lightweight, and high-performance materials such as silicone and fluoropolymers, enhancing gasket efficiency and lifespan across industries.
- Intense competition among leading players like DowDuPont Inc., NOK Corporation, and Boyd Corporation fosters innovation, though high raw material costs and price volatility remain key restraints.
- Asia-Pacific leads with a 41% regional share in 2024, supported by rapid industrialization, infrastructure growth, and expanding automotive and electronics manufacturing sectors across China, India, Japan, and South Korea.
Access crucial information at unmatched prices!
Request your sample report today & start making informed decisions powered by Credence Research Inc.!
Download Sample
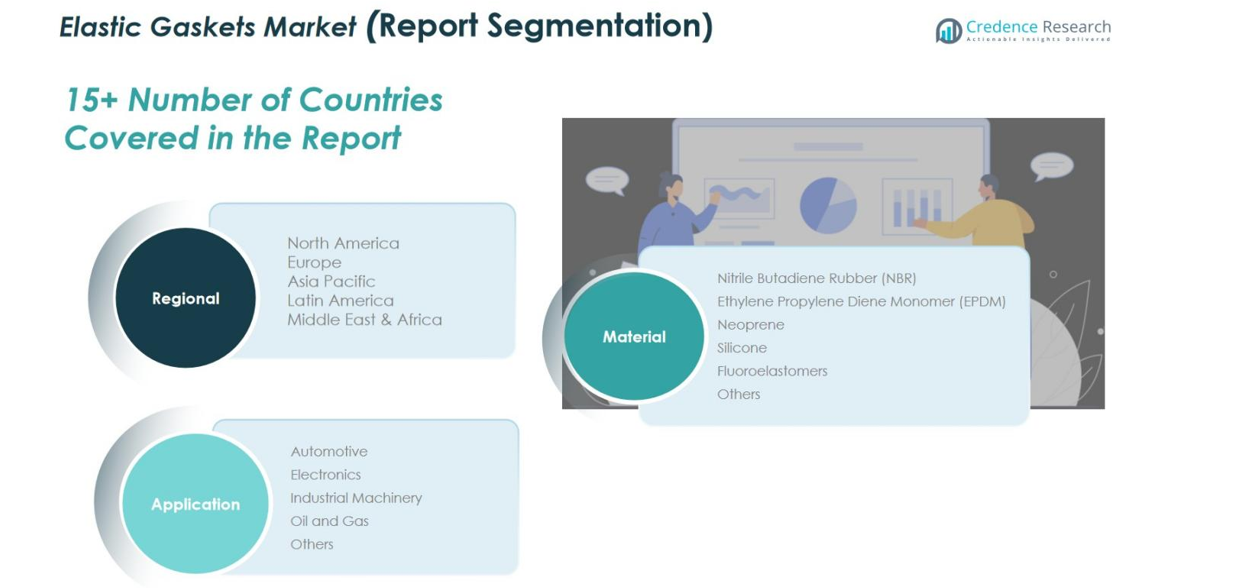
Market Segmentation Analysis:
By Material
The Nitrile Butadiene Rubber (NBR) segment leads the global elastic gaskets market with a 32% share, driven by its excellent resistance to oils, fuels, and chemicals. NBR gaskets are widely used in automotive engines, fuel systems, and hydraulic applications, supporting high-performance sealing requirements. Other key materials include EPDM (21%), favored for weather and heat resistance; Silicone (18%), preferred for high-temperature and medical applications; Neoprene (15%) for industrial machinery; and Fluoroelastomers (9%), essential in oil, gas, and chemical sectors. Growth is supported by industrialization, stringent quality standards, and increasing automotive production globally.
- For instance, Continental AG utilizes NBR seals in advanced fuel management systems for diesel engines to maintain durability under extreme conditions.
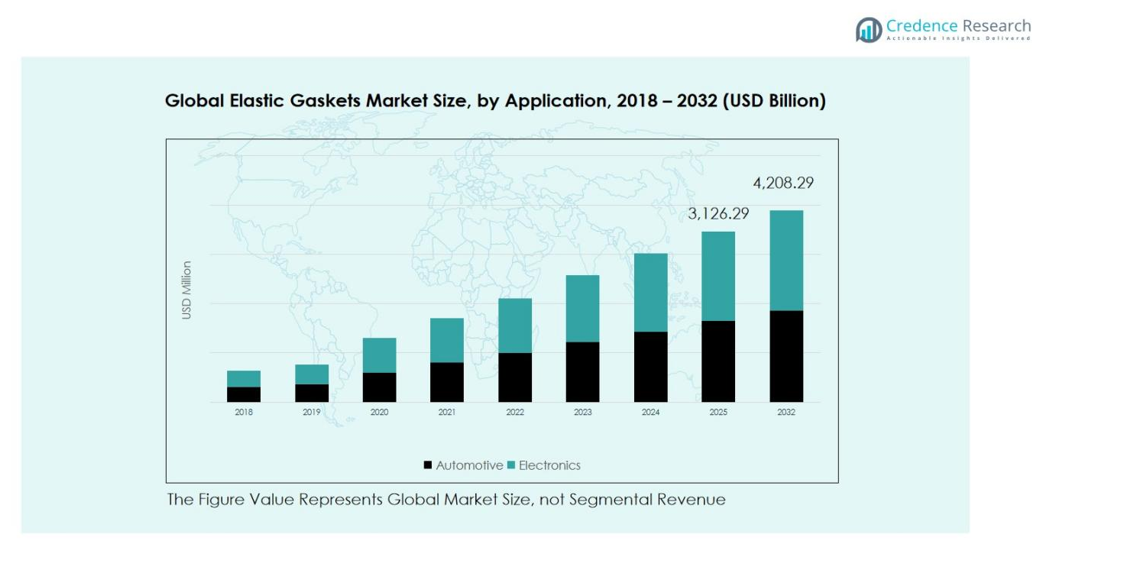
By Application
The Automotive sector dominates the market with a 35% share, reflecting rising vehicle production and stricter emission standards requiring durable gaskets for engines, fuel systems, and thermal management. Industrial Machinery (22%) benefits from demand in construction and manufacturing, where gaskets ensure leak-proof operation under high pressures. Electronics (20%) grows due to compact devices and thermal management needs, while Oil & Gas (13%) relies on high-performance materials for extreme conditions. The Others (10%) category covers healthcare, aerospace, and renewable energy applications. Market drivers include technological advancements, increasing industrial activities, and stricter operational safety standards.
- For instance, CGR Products designed a multi-layer gasket with encapsulated sealing grommets for a major OEM engine builder, increasing gasket lifespan to over 40,000 hours in power generation applications.
Key Growth Drivers
Rising Automotive Production and Technological Advancements
The growth of the global elastic gaskets market is strongly driven by the rising production of automobiles worldwide. Increasing vehicle manufacturing, especially in emerging economies, fuels demand for high-performance gaskets used in engines, fuel systems, and HVAC components. Technological advancements in gasket materials, including improved elastomers with enhanced chemical and temperature resistance, support superior sealing performance. Adoption of hybrid and electric vehicles also requires innovative gaskets for battery insulation and thermal management, further propelling market expansion and reinforcing the segment’s dominance in automotive applications.
- For instance, Tesla employs silicone-based gaskets in its Model Y battery packs to prevent leakage and ensure thermal uniformity, demonstrating this trend’s impact on modern automotive design.
Industrialization and Expansion of Manufacturing Sectors
Rapid industrialization and modernization of manufacturing sectors globally drive the demand for elastic gaskets. Machinery, construction equipment, and industrial process systems rely on gaskets for leak prevention, pressure containment, and operational efficiency. Expansion of industrial infrastructure in Asia Pacific and other emerging regions increases consumption of elastomeric gaskets across diverse applications. Furthermore, automation and stricter industrial safety standards encourage the use of durable, high-performance gaskets, reducing maintenance costs and downtime, which makes them critical components for operational reliability and productivity growth in industrial environments.
- For instance, EagleBurgmann supplies specialized seals and gaskets for critical applications like natural gas plants and refinery systems, emphasizing safety, durability, and environmental compliance.
Stringent Quality and Environmental Regulations
Increasing regulatory emphasis on quality, safety, and environmental compliance acts as a major growth driver. Industries such as automotive, oil & gas, and chemical processing require gaskets that meet rigorous standards for leak prevention, chemical resistance, and operational durability. Environmental regulations promoting fuel efficiency and emission control in vehicles further enhance demand for high-quality sealing solutions. Manufacturers are investing in advanced materials such as silicone and fluoropolymers to comply with these standards, driving innovation and adoption while ensuring long-term market growth across multiple end-use industries.
Key Trends & Opportunities
Adoption of Advanced Elastomeric Materials
A key trend shaping the market is the adoption of advanced elastomeric materials such as silicone, fluoropolymers, and specialty rubbers. These materials provide superior chemical, heat, and wear resistance, enabling their use in challenging applications like aerospace, oil & gas, and electronics. The trend toward lightweight, durable, and eco-friendly materials presents opportunities for product differentiation. Companies focusing on research and development of high-performance elastomers can capitalize on increasing demand for specialized gaskets, strengthening their market position and catering to evolving industrial and automotive requirements globally.
- For instance, Dow introduced its DOWSIL silicone elastomers used in aircraft sealing applications due to their stability at temperatures above 200°C.
Growth in Emerging Markets and Renewable Energy Applications
Emerging markets in Asia Pacific, Latin America, and the Middle East offer significant opportunities due to rapid industrialization and increasing infrastructure investments. Rising demand for renewable energy systems, such as solar and wind power, also presents potential for elastic gaskets in sealing and insulation applications. The expansion of automotive, construction, and industrial sectors in these regions creates room for new entrants and innovative solutions. Strategic partnerships, localized production, and investment in technology-driven products allow companies to capture growth in untapped markets and niche application areas.
- For instance, the United Arab Emirates’ construction boom, including the Etihad Rail and Dubai Expo post-expansion projects, has surged demand for durable elastomeric gaskets in HVAC and pipeline systems.
Key Challenges
High Raw Material Costs and Price Volatility
The market faces challenges due to fluctuations in raw material prices, particularly for synthetic rubbers and specialty elastomers. Price volatility affects production costs and profit margins for gasket manufacturers, potentially limiting large-scale adoption in cost-sensitive applications. Dependence on petroleum-derived materials exposes the market to global supply chain disruptions. Companies must balance high-performance material requirements with cost efficiency, which may slow growth in certain regions. Strategic sourcing, material innovation, and efficient manufacturing processes are essential to mitigate the impact of raw material cost pressures.
Intense Competition and Technological Barriers
Intense competition from established manufacturers and low-cost regional players poses a significant challenge. Technological barriers, such as the need for advanced production techniques and material expertise, limit market entry for smaller companies. Continuous innovation is required to meet stringent performance and regulatory standards across applications, from automotive to industrial machinery. Companies must invest in R&D, precision manufacturing, and quality assurance to maintain competitive advantage. Failure to innovate can result in loss of market share, especially in high-performance sectors demanding specialized elastomeric solutions.
Regional Analysis
North America
North America had a market size of USD 470.55 million in 2018, expected to grow to USD 659.00 million by 2024 and USD 946.87 million by 2032, at a CAGR of 4.6%. Growth is driven by increasing automotive production, rising industrial machinery demand, and stringent environmental regulations. The U.S. remains the largest contributor, with high adoption of advanced elastomeric gaskets in engines, fuel systems, and industrial applications. Technological advancements in sealing solutions, combined with demand for durability and efficiency, continue to support market expansion in North America.
Europe
Europe recorded a market size of USD 577.49 million in 2018, projected to reach USD 785.33 million by 2024 and USD 1,084.90 million by 2032, growing at a CAGR of 4.1%. Growth is driven by rising automotive production, industrial modernization, and stringent emission and quality regulations. Germany, the UK, and France lead consumption, particularly for automotive and industrial machinery applications. The increasing use of high-performance elastomeric gaskets in chemical processing, energy, and electronics sectors further fuels market expansion.
Asia Pacific
Asia Pacific’s market size was USD 787.05 million in 2018 and is projected to reach USD 1,068.59 million by 2024 and USD 1,472.90 million by 2032, at a CAGR of 4.0%. Growth is fueled by rapid industrialization, urbanization, and rising automotive and electronics production in China, India, Japan, and South Korea. Expanding infrastructure projects and industrial machinery demand drive gasket consumption. Increasing adoption of advanced elastomeric materials in high-performance applications further strengthens market growth across the Asia Pacific region.
Latin America
Latin America’s market size was USD 208.92 million in 2018, expected to reach USD 303.20 million by 2024 and USD 455.34 million by 2032, at a CAGR of 5.2%. Growth is driven by industrialization, expansion of automotive production, and development of the oil & gas sector in Brazil, Argentina, and surrounding countries. Demand for durable, chemical- and temperature-resistant gaskets in industrial machinery and construction projects is rising. Strategic investments by global manufacturers and infrastructure development initiatives are enhancing market opportunities.
Middle East
The Middle East recorded a market size of USD 93.76 million in 2018, projected to grow to USD 133.70 million by 2024 and USD 196.53 million by 2032, at a CAGR of 4.9%. Expansion in oil & gas, petrochemical, and construction sectors across GCC countries, Israel, and Turkey drives demand. Increasing adoption of high-performance gaskets in pipelines, refineries, and industrial equipment supports growth. Infrastructure development and renewable energy projects also contribute to the region’s market expansion.
Africa
Africa had a market size of USD 22.68 million in 2018, expected to reach USD 33.63 million by 2024 and USD 51.76 million by 2032, at a CAGR of 5.5%. Growth is driven by rising industrialization, expansion of oil & gas and mining sectors, and increasing construction activity. South Africa and Egypt are key contributors, supported by growing adoption of durable elastomeric gaskets in industrial applications. Government initiatives to improve manufacturing standards and infrastructure development further bolster the market’s growth across the continent.
Market Segmentations:
By Material
- Nitrile Butadiene Rubber (NBR)
- Ethylene Propylene Diene Monomer (EPDM)
- Neoprene
- Silicone
- Fluoroelastomers
- Others
By Application
- Automotive
- Electronics
- Industrial Machinery
- Oil & Gas
- Others
By Region
- North America
- Europe
- Germany
- France
- U.K.
- Italy
- Spain
- Rest of Europe
- Asia Pacific
- China
- Japan
- India
- South Korea
- South-east Asia
- Rest of Asia Pacific
- Latin America
- Brazil
- Argentina
- Rest of Latin America
- Middle East & Africa
- GCC Countries
- South Africa
- Rest of the Middle East and Africa
Competitive Landscape
The competitive landscape of the global elastic gaskets market features key players including Denver Rubber Company, DowDupont Inc., Elring Linger A.G., NOK Corporation, Stockwell Elastomerics, Inc., Garlock Sealing Technologies, Henkel AG & Co. KGaA, Lamons Gasket Company, and Boyd Corporation. These companies are focusing on strategic initiatives such as mergers and acquisitions, partnerships, and capacity expansions to strengthen their market position. Product innovation and diversification into high-performance elastomeric gaskets are central strategies to meet the growing demand across automotive, industrial machinery, electronics, and oil & gas sectors. Additionally, players are increasingly investing in R&D to develop customized solutions that enhance durability, chemical resistance, and thermal stability. Geographic expansion and strengthening distribution networks are also key tactics to capture emerging markets, particularly in Asia Pacific, Latin America, and the Middle East. This competitive focus ensures sustained growth and resilience amid evolving market demands.
Shape Your Report to Specific Countries or Regions & Enjoy 30% Off!
Key Player Analysis
- Denver Rubber Company
- DowDupont Inc.
- Elring Linger A.G.
- NOK Corporation
- Stockwell Elastomerics, Inc.
- Garlock Sealing Technologies
- Henkel AG & Co. KGaA
- Lamons Gasket Company
- Boyd Corporation
- Other Key Players
Recent Developments
- In September 2025, KLINGER Holding (Austria) acquired SJP Sealing Technology (Singapore) to strengthen its presence in Southeast Asia’s gasket and sealing solutions market.
- In April 2025, Freudenberg Sealing Technologies (Germany) launched a new elastomer material designed for safe battery cell sealing applications, expanding its product portfolio in the global elastic gaskets market.
- In May 2025, Momentum Group signed an agreement to acquire 70% of the shares in TTP Seal AS (Norway), a specialist in sealing technology.
- In September 2025, Freudenberg Sealing Technologies announced its intent to acquire the DMH Group (Austria/US), which manufactures customized sealing solutions from thermoplastics and elastomers
Report Coverage
The research report offers an in-depth analysis based on Material, Application and Region. It details leading market players, providing an overview of their business, product offerings, investments, revenue streams, and key applications. Additionally, the report includes insights into the competitive environment, SWOT analysis, current market trends, as well as the primary drivers and constraints. Furthermore, it discusses various factors that have driven market expansion in recent years. The report also explores market dynamics, regulatory scenarios, and technological advancements that are shaping the industry. It assesses the impact of external factors and global economic changes on market growth. Lastly, it provides strategic recommendations for new entrants and established companies to navigate the complexities of the market.
Future Outlook
- The global elastic gaskets market will experience steady growth due to rising demand from automotive and industrial applications.
- Advancements in material science will drive the development of more durable and temperature-resistant gasket solutions.
- Increasing adoption of electric vehicles will create new opportunities for customized gasket designs.
- Growth in construction and infrastructure projects will boost demand for sealing solutions in piping and HVAC systems.
- Expansion of the oil and gas sector will continue to support market demand for high-performance gaskets.
- Rising environmental regulations will encourage the use of eco-friendly and recyclable gasket materials.
- Automation in manufacturing will improve gasket precision and production efficiency.
- Asia-Pacific will remain the fastest-growing region due to rapid industrialization and urban development.
- Strategic partnerships and product innovations will help key players strengthen their global presence.
- Increasing focus on preventive maintenance and equipment reliability will sustain long-term market demand.


