| REPORT ATTRIBUTE |
DETAILS |
| Historical Period |
2020-2023 |
| Base Year |
2024 |
| Forecast Period |
2025-2032 |
| Electric Charging Station Market Size 20244 |
USD 54,015.80 million |
| Electric Charging Station Market, CAGR |
31.65% |
| Electric Charging Station Market Size 2032 |
USD 483,391.24 million |
Market Overview
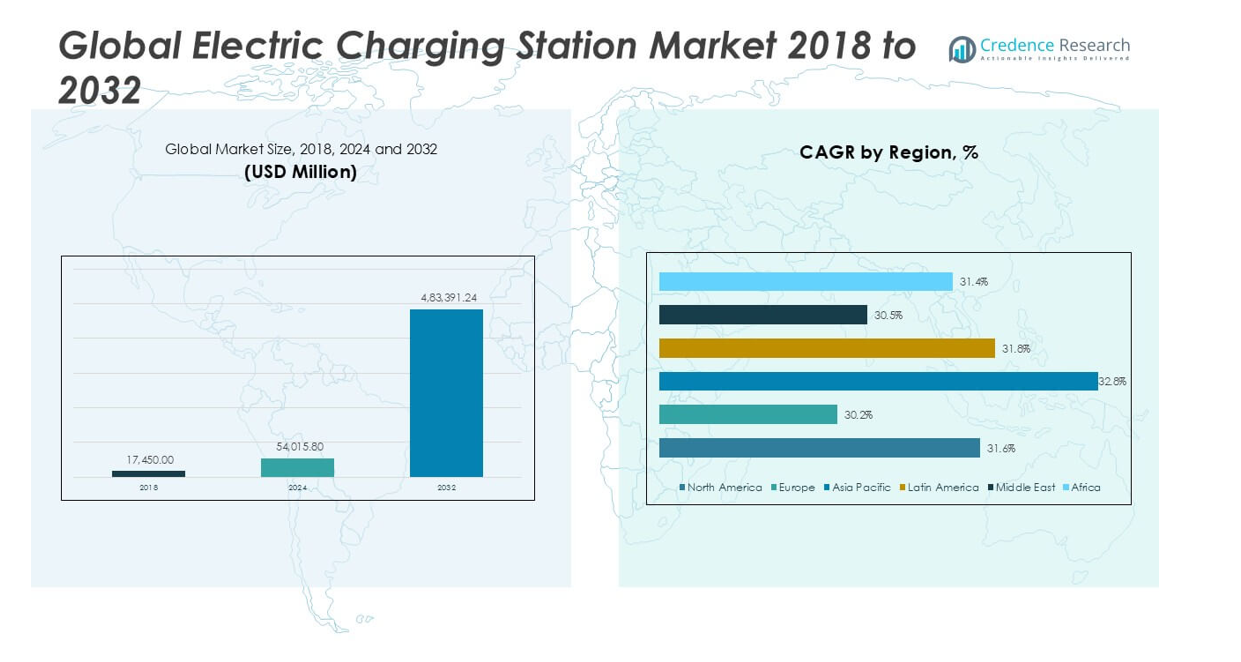
The Global Electric Charging Station Market is projected to grow from USD 54,015.80 million in 2024 to an estimated USD 483,391.24 million based on 2032, with a compound annual growth rate (CAGR) of 31.65% from 2025 to 2032.
Key market drivers include rapid electrification of the transportation sector and substantial investments by both public and private entities in charging infrastructure. The market is also witnessing strong momentum due to favorable policies, subsidies, and incentives supporting EV purchases and infrastructure rollouts. Technological innovations such as ultra-fast charging, wireless charging, and integrated payment solutions are further enhancing the efficiency and accessibility of charging stations. Trends indicate a shift toward smart and networked charging stations that offer real-time monitoring and load balancing to support grid stability.
Geographically, Asia-Pacific dominates the global market, driven by aggressive EV adoption in China, Japan, and South Korea, supported by robust government initiatives and large-scale manufacturing capacity. Europe follows closely, fueled by environmental mandates and carbon-neutral goals. North America is also expanding its infrastructure, supported by policy measures like the U.S. Bipartisan Infrastructure Law. Key players operating in this market include ABB, ChargePoint, Tesla, Siemens, Schneider Electric, EVgo, Blink Charging, and Shell Recharge Solutions.
Market Insights
- The market is projected to grow from USD 54,015.80 million in 2024 to USD 483,391.24 million by 2032, at a CAGR of 31.65%.
- Accelerated EV adoption and strong government policies are driving large-scale investment in charging infrastructure.
- Technological advancements like ultra-fast and wireless charging are reshaping user expectations and network design.
- High installation costs and limited grid capacity remain key restraints to infrastructure scalability.
- Interoperability issues and lack of universal standards hinder seamless user experience across networks.
- Asia-Pacific holds the largest share due to aggressive electrification initiatives in China, Japan, and South Korea.
- Europe and North America are expanding infrastructure with regulatory mandates and public-private partnerships.
Access crucial information at unmatched prices!
Request your sample report today & start making informed decisions powered by Credence Research Inc.!
Download Sample
Market Drivers
Surge in Electric Vehicle Adoption Accelerates Charging Infrastructure Demand
The Global Electric Charging Station Market is witnessing significant growth due to the rapid increase in electric vehicle (EV) adoption worldwide. Governments are pushing for cleaner mobility solutions to reduce carbon emissions, prompting a shift from internal combustion engines to electric alternatives. Consumer preference for eco-friendly transport options, combined with falling battery prices and improved vehicle performance, is driving EV sales. This surge in EVs requires a scalable and accessible charging infrastructure to support both residential and public use. The growing need for reliable charging points is prompting large-scale investments in both urban and rural areas. Charging station manufacturers and energy providers are responding with network expansion and technology upgrades.
- For instance, in 2023, nearly 14 million electric cars were sold globally, bringing the total number of electric cars on the road to 40 million.
Favorable Government Policies and Incentives Fuel Infrastructure Expansion
Regulatory frameworks and policy incentives remain core growth drivers for the Global Electric Charging Station Market. Countries are introducing tax benefits, grants, and subsidies to accelerate the deployment of EVs and charging networks. Government support includes zero-emission mandates, dedicated funding for charging corridors, and public-private partnerships to boost infrastructure readiness. Mandates requiring new residential and commercial buildings to include EV charging capabilities further expand installation rates. These measures significantly reduce the total cost of ownership for EVs and enhance the business viability of charging stations. It supports sustained infrastructure development across key regions.
- For instance, in the United States, there are currently 161,562 public and private EV charging ports, but supporting projected EV growth by 2030 will require 12.9 million charge ports and approximately 140,000 DC fast charging ports nationwide.
Technological Advancements Improve Charging Efficiency and User Experience
Continuous innovations are transforming the charging experience and strengthening the appeal of the Global Electric Charging Station Market. Fast-charging technology, higher-capacity batteries, and smart load management systems are improving the convenience and speed of charging. Software integration enables users to locate stations, make payments, and schedule charging via mobile platforms. Grid integration allows energy companies to manage electricity flow more effectively, improving grid reliability. Wireless and bidirectional charging are emerging technologies gaining industry attention. These developments support scalability while aligning with evolving consumer expectations.
Private Sector Investments and Strategic Partnerships Accelerate Market Growth
Corporate investments and collaborations play a pivotal role in advancing the Global Electric Charging Station Market. Automotive manufacturers, energy providers, and technology firms are joining forces to develop large charging networks. Strategic partnerships help streamline operations, optimize resource allocation, and expand geographical coverage. Companies are investing in data-driven platforms to monitor usage, optimize maintenance, and offer flexible pricing. Retail locations and commercial real estate firms are installing charging stations to attract eco-conscious consumers. It helps drive adoption across both residential and commercial segments while creating new business models.
Market Trends
Rising Deployment of Fast and Ultra-Fast Charging Technologies
The Global Electric Charging Station Market is observing a sharp transition from standard chargers to fast and ultra-fast charging technologies. These advanced systems reduce charging time significantly, making EV use more practical for long-distance travel and commercial fleets. Automakers and infrastructure providers are aligning to install high-powered chargers along highways and urban corridors. Governments are funding high-speed charging networks to support increased EV penetration. Demand for chargers above 150 kW is increasing in both public and fleet-based environments. It reflects a market shift toward high-efficiency solutions to meet growing user expectations.
- For instance, according to recent company and government surveys, more than 450,000 fast and ultra-fast charging stations have been installed globally, with over 120,000 of these added in the last year alone.
Integration of Smart Charging Systems Enhances Network Efficiency
Smart charging systems are transforming the Global Electric Charging Station Market by introducing real-time monitoring, demand response, and automated load balancing. These features optimize energy distribution, reduce strain on the grid, and allow users to schedule charging during off-peak hours. It supports grid stability while improving operational efficiency for station operators. Smart chargers also enable dynamic pricing and remote diagnostics, offering better control and user engagement. Utilities are collaborating with charging companies to integrate these systems into broader energy management platforms. The trend supports the evolution of charging stations into intelligent, data-driven infrastructure.
- For instance, government and industry data show that over 200,000 smart charging systems have been deployed worldwide, with 50,000 new installations reported in the past 12 months
Growth in Charging-as-a-Service and Subscription-Based Models
The Global Electric Charging Station Market is embracing service-based business models to attract a broader customer base. Charging-as-a-Service (CaaS) and subscription platforms are becoming popular among fleet operators and residential users seeking cost predictability and convenience. These models eliminate high upfront costs for station ownership while ensuring access to maintenance and software updates. It allows providers to scale rapidly and diversify revenue streams. Companies are bundling hardware, software, and support under long-term contracts. The shift toward service-oriented offerings reflects an ongoing transformation in user behavior and infrastructure financing.
Expansion of Charging Infrastructure in Emerging Economies
Emerging economies are becoming critical to the long-term growth of the Global Electric Charging Station Market. Rapid urbanization, growing middle-class populations, and supportive government initiatives are encouraging EV adoption in markets like India, Brazil, and Southeast Asia. Infrastructure providers are entering these regions with low-cost, scalable charging solutions tailored to local conditions. It includes mobile charging units, solar-powered stations, and modular installations for remote areas. International partnerships are helping transfer technology and investment to underdeveloped markets. The trend supports global market diversification and balances demand beyond mature regions.
Market Challenges
High Installation Costs and Limited Grid Capacity Constrain Infrastructure Growth
The Global Electric Charging Station Market faces cost-related barriers that hinder widespread infrastructure deployment. High capital expenditure for hardware, site preparation, and electrical upgrades restricts adoption, especially in low-margin or rural areas. Many regions lack grid capacity to support high-density charging, which creates reliability concerns. It challenges public and private operators in meeting demand without overloading local distribution networks. Delays in utility approvals and costly permitting processes slow down station rollout. These obstacles demand coordinated planning between governments, utilities, and charging providers.
- For instance, a U.S. Department of Energy survey found that the installation of a single DC fast charger typically requires between 12 and 18 months from planning to operation, involving up to 10 separate permitting steps and coordination with as many as 5 different utility representatives1
Inconsistent Standards and Interoperability Issues Hinder User Experience
Lack of global standardization in charging connectors, payment systems, and communication protocols complicates user access and network integration. The Global Electric Charging Station Market continues to struggle with fragmented ecosystems that create compatibility issues across vehicles and station types. It limits seamless roaming between networks and discourages adoption among first-time EV users. Payment infrastructure is also inconsistent, with varied access methods and billing formats creating confusion. Standardized frameworks are still under development, which delays market maturity. Resolving these challenges requires strong regulatory oversight and industry collaboration.
Market Opportunities
Expansion of Public Charging Networks in Urban and Semi-Urban Regions
Urbanization and population growth create strong opportunities for expanding public EV charging infrastructure. The Global Electric Charging Station Market can benefit from municipal partnerships to develop smart cities with integrated transportation and energy systems. Governments are allocating land, funding, and policy support to encourage station deployment in high-traffic zones, commercial hubs, and residential complexes. It enables convenient access for users without home charging options, particularly in apartment-dense areas. Operators can tap into recurring revenue models through time-based or usage-based pricing. Growth in e-mobility services like ride-sharing also supports demand for accessible charging solutions.
Integration with Renewable Energy and Energy Storage Technologies
The rising focus on sustainability opens opportunities to align EV charging with renewable energy sources such as solar and wind. The Global Electric Charging Station Market can integrate solar-powered charging units and battery storage systems to lower grid dependency and operating costs. It allows operators to manage peak loads, store surplus energy, and support off-grid installations. Microgrids and vehicle-to-grid (V2G) systems offer added value by enabling two-way energy flow between vehicles and power networks. These solutions support energy resilience while reinforcing environmental goals. Companies investing in clean energy integration can differentiate their offerings and meet regulatory expectations.
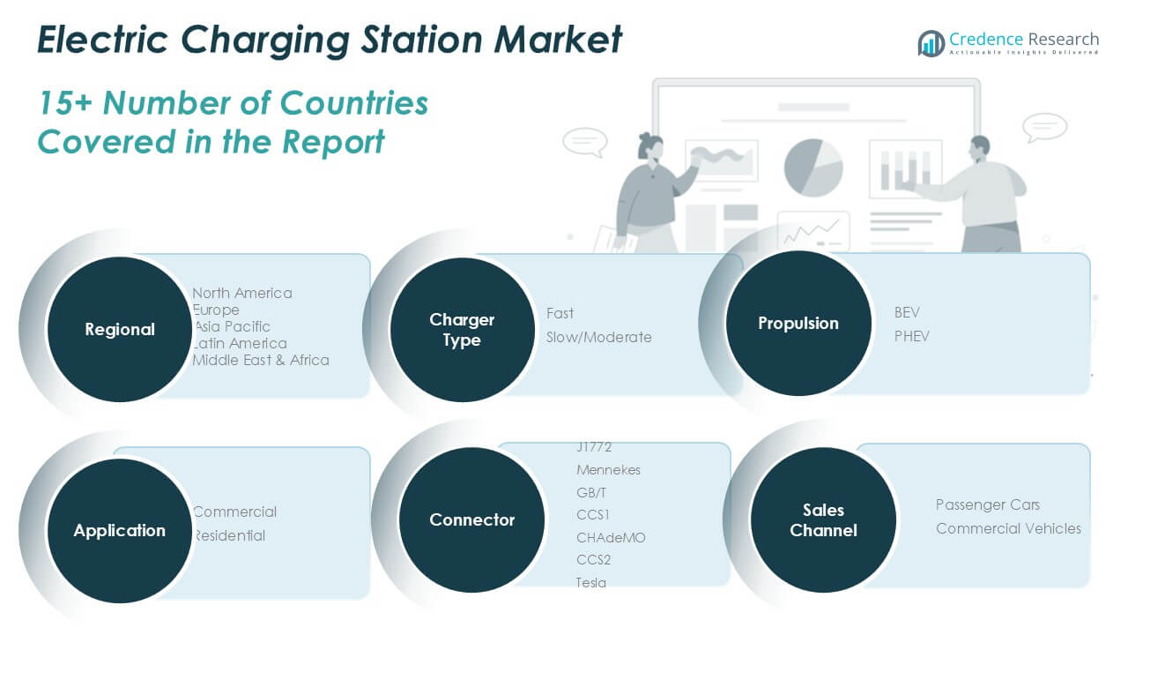
Market Segmentation Analysis
By Charger Type
The Global Electric Charging Station Market is segmented into fast and slow/moderate chargers. Fast chargers dominate revenue share due to their ability to recharge EVs in a shorter time, making them ideal for highways, urban commercial zones, and fleet applications. Slow/moderate chargers remain relevant in residential areas and workplaces where vehicles are parked for extended periods. It supports overnight and long-duration charging needs, offering convenience for private users. The fast charger segment is expected to expand significantly with advancements in ultra-fast DC charging technologies and increasing demand from long-distance travelers.
- For instance, according to a 2024 industry survey, over 50,000 fast charging stations were operational across the United States, compared to about 28,000 slow/moderate charging stations, reflecting the rapid deployment of fast chargers in public and commercial locations.
By Application
The market is divided into commercial and residential applications. Commercial charging holds a larger revenue share driven by rising installation in shopping centers, offices, public parking, and transportation hubs. It offers broader accessibility and meets the growing demand from shared mobility fleets. Residential applications are growing due to rising private EV ownership and supportive policies encouraging home-based charging setups. It supports energy management and cost savings for individual users. Demand in both segments is supported by smart grid integration and scalable charging models.
- For instance, a government report in 2024 noted that more than 120,000 commercial charging points were installed nationwide, while residential installations surpassed 600,000 units, indicating strong momentum in both segments as electric vehicle adoption rises.
By Connector
Connector types include J1772, Mennekes, GB/T, CCS1, CHAdeMO, CCS2, and Tesla. CCS variants are gaining traction globally due to compatibility with fast charging and broader vehicle support. CHAdeMO maintains a strong presence in Japan, while GB/T is standard in China. Tesla maintains proprietary networks optimized for its vehicle range. It drives investment in multiprotocol chargers to ensure cross-compatibility and enhance user flexibility. The shift toward universal connectors supports infrastructure standardization and network efficiency.
By Vehicle Type
The market is categorized into passenger cars and commercial vehicles. Passenger cars account for the largest share, driven by rising individual EV adoption across urban regions. Commercial vehicles are seeing rapid growth with the electrification of delivery fleets, logistics transport, and public transit systems. It reflects efforts to reduce operating costs and emissions. Infrastructure providers are expanding high-capacity stations to support heavy-duty vehicle requirements and fleet turnaround efficiency.
By Propulsion
Propulsion segmentation includes Battery Electric Vehicles (BEVs) and Plug-in Hybrid Electric Vehicles (PHEVs). BEVs dominate the market due to their zero-emission performance and increasing affordability. PHEVs still maintain relevance in regions with limited charging infrastructure, offering flexibility between fuel and electricity. It allows gradual transition toward full electrification. Growth in BEV charging supports wider adoption of high-powered DC chargers and grid-connected energy management systems.
Segments
Based on Charger Type
Based on Application
Based on Connector
- J1772
- Mennekes
- GB/T
- CCS1
- CHAdeMO
- CCS2
- Tesla
Based on Vehicle Type
- Passenger Cars
- Commercial Vehicles
Based on Propulsion
Based on Region
- North America
- Europe
- UK
- France
- Germany
- Italy
- Spain
- Russia
- Belgium
- Netherlands
- Austria
- Sweden
- Poland
- Denmark
- Switzerland
- Rest of Europe
- Asia Pacific
- China
- Japan
- South Korea
- India
- Australia
- Thailand
- Indonesia
- Vietnam
- Malaysia
- Philippines
- Taiwan
- Rest of Asia Pacific
- Latin America
- Brazil
- Argentina
- Peru
- Chile
- Colombia
- Rest of Latin America
- Middle East
- UAE
- KSA
- Israel
- Turkey
- Iran
- Rest of Middle East
- Africa
- Egypt
- Nigeria
- Algeria
- Morocco
- Rest of Africa
Regional Analysis
North America Electric Charging Station Market
North America holds a 35.2% share of the Global Electric Charging Station Market, with a market value of USD 19,015.06 million in 2024 and projected growth to USD 170,148.88 million by 2032, at a CAGR of 31.6%. The U.S. leads the region, driven by federal infrastructure investments and tax credits under clean energy acts. Canada is expanding its public charging infrastructure to support urban mobility targets and cross-border EV travel. The region is witnessing high demand for fast chargers, particularly in fleet operations and highway networks. It benefits from advanced grid infrastructure and strong collaborations between automakers and energy firms. The market remains highly competitive with strong penetration of private networks.
Europe Electric Charging Station Market
Europe accounts for 20.3% of the Global Electric Charging Station Market, valued at USD 10,943.69 million in 2024 and expected to reach USD 89,959.89 million by 2032, registering a CAGR of 30.2%. Germany, the UK, France, and the Netherlands lead regional expansion with stringent emission targets and EV incentives. The European Union supports cross-border interoperability and public-private investment models for charging networks. Urban infrastructure modernization includes mandatory EV-ready building codes and smart grid integration. It continues to advance sustainable mobility through policies such as the Fit for 55 package. Fast and ultra-fast chargers are expanding in motorways and city centers.
Asia Pacific Electric Charging Station Market
Asia Pacific represents 27.6% of the Global Electric Charging Station Market, with market size growing from USD 14,920.09 million in 2024 to USD 143,199.05 million by 2032, at the highest CAGR of 32.8%. China dominates the region with aggressive EV adoption, government mandates, and massive state-backed infrastructure projects. India and Southeast Asia are emerging rapidly with localized policy incentives and pilot programs. Japan and South Korea focus on advanced charging technologies and smart city projects. It benefits from high EV production and robust supply chain integration. Urban population growth and air quality concerns support long-term infrastructure demand.
Latin America Electric Charging Station Market
Latin America holds a 6.5% share of the Global Electric Charging Station Market, valued at USD 3,490.78 million in 2024 and forecast to reach USD 31,511.31 million by 2032, with a CAGR of 31.8%. Brazil, Mexico, and Chile are leading markets with early policy interventions and pilot infrastructure deployments. Regional adoption is supported by growing awareness of clean mobility and automotive electrification programs. It remains in early stages but shows strong potential in urban corridors and public transit electrification. Multilateral partnerships and international funding help close infrastructure gaps. Private firms are entering the space with flexible and mobile charging solutions.
Middle East Electric Charging Station Market
The Middle East captures a 4.8% share of the Global Electric Charging Station Market, starting at USD 2,612.66 million in 2024 and expected to grow to USD 21,806.99 million by 2032, at a CAGR of 30.5%. The UAE and Saudi Arabia lead regional adoption with national visions promoting EV mobility and smart infrastructure. Governments are integrating EV infrastructure with renewable energy projects and smart city plans. It focuses on luxury EV segments and tourist-oriented infrastructure. Charging stations are emerging in commercial zones, malls, and airports. The region is gradually building momentum in private sector investment and policy reform.
Africa Electric Charging Station Market
Africa holds a 5.6% share of the Global Electric Charging Station Market, with value projected to rise from USD 3,033.53 million in 2024 to USD 26,765.12 million by 2032, growing at a CAGR of 31.4%. South Africa, Kenya, and Egypt are leading markets, supported by pilot programs and clean energy targets. Infrastructure remains limited, but rising urbanization and renewable energy projects support expansion. It is adopting solar-powered and mobile charging models to overcome grid limitations. Government partnerships and NGO upport aid early-stage development. The market offers long-term potential for scalable, low-cost infrastructure soutions.
Shape Your Report to Specific Countries or Regions & Enjoy 30% Off!
Key players
- Siemens AG
- Eaton
- ChargePoint Inc.
- ABB
- Schneider Electric
- EVBox
- Webasto Group
- Tesla
- Blink Charging Co.
- EO Charging
Competitive Analysis
The Global Electric Charging Station Market is highly competitive, with key players focusing on technological innovation, strategic partnerships, and geographic expansion. Siemens AG and ABB lead the market through integrated solutions and global reach. ChargePoint Inc. and Blink Charging Co. dominate the North American landscape with extensive charging networks and software platforms. Tesla remains a significant player with its proprietary Supercharger network, offering optimized performance for its vehicles. EVBox and EO Charging target the European market with scalable solutions tailored for urban mobility. Schneider Electric and Eaton leverage their energy management expertise to support smart grid integration. Webasto Group focuses on modular charging products and OEM collaboration. It continues to evolve through product differentiation and investment in fast-charging infrastructure. Market leaders are prioritizing interoperability, network reliability, and user-centric features to capture growing demand across residential, commercial, and fleet applications.
Recent Development
- In March 2025, Siemens AG announced plans to restructure its electric vehicle charging business, impacting around 450 jobs globally according to Mobility Plaza and Pro MFG Media.
- In June 2025, ChargePoint Inc. reported its Q1 sales declined to $97.6 million, down from $107 million year-over-year, and its stock dropped 22.5%. Despite these challenges, the company announced a strategic partnership with Eaton to integrate integrated power management solutions and expand distribution in North America and Europe.
- In May 2025, Eaton and ChargePoint formed a strategic partnership to accelerate the development of EV charging infrastructure. This collaboration focused on creating a “one-stop shop” for EV charging solutions, including chargers, electrical infrastructure, and engineering services, all offered as turnkey solutions.
Market Concentration and Characteristics
The Global Electric Charging Station Market displays a moderately concentrated structure, with a mix of multinational corporations and emerging regional players competing on technology, pricing, and network coverage. It is characterized by rapid innovation, strong regulatory support, and growing private sector investment. The market favors companies with advanced fast-charging capabilities, scalable platforms, and integrated software services. Key characteristics include high capital intensity, infrastructure dependency, and increasing emphasis on interoperability. Strategic partnerships, mergers, and vertical integration are common, aiming to streamline deployment and reduce operational costs. The market continues to evolve with rising demand for smart, grid-connected, and renewable-integrated charging solutions.
Report Coverage
The research report offers an in-depth analysis based on Charger Type, Application, Connector, Vehicle Type, Propulsion and Region. It details leading market players, providing an overview of their business, product offerings, investments, revenue streams, and key applications. Additionally, the report includes insights into the competitive environment, SWOT analysis, current market trends, as well as the primary drivers and constraints. Furthermore, it discusses various factors that have driven market expansion in recent years. The report also explores market dynamics, regulatory scenarios, and technological advancements that are shaping the industry. It assesses the impact of external factors and global economic changes on market growth. Lastly, it provides strategic recommendations for new entrants and established companies to navigate the complexities of the market.
Future Outlook
- Industry leaders will install more 150 kW+ charging stations to support long-distance travel and commercial fleet electrification.
- Companies will invest in India, Southeast Asia, and Latin America to capitalize on rapid urbanization and rising EV adoption.
- Providers will deploy solar-powered stations and battery systems to reduce operational costs and manage peak demand.
- Charging networks will incorporate vehicle-to-grid functionality to support grid stability and offer new revenue streams.
- Subscription-based platforms will gain traction, enabling users to access charging networks without heavy upfront investment.
- Industry groups and regulators will push for universal connectors and payment platforms to simplify user experience.
- Logistics, ride-hailing, and public transit sectors will drive demand for high-capacity, fast-turnaround charging facilities.
- Joint ventures will expand nationwide charging networks, leveraging automotive, utility, and retail infrastructure.
- Providers will use analytics and remote diagnostics to improve uptime, reduce costs, and optimize charging performance.
- Policymakers will continue to offer grants, tax credits, and building codes requiring EV-ready installations to accelerate market growth.


