| REPORT ATTRIBUTE |
DETAILS |
| Historical Period |
2020-2023 |
| Base Year |
2024 |
| Forecast Period |
2025-2032 |
| Europe Pea Proteins Market Size 2024 |
USD 586.94 Million |
| Europe Pea Proteins Market, CAGR |
11.46% |
| Europe Pea Proteins Market Size 2032 |
USD 1398.55 Million |
Market Overview:
The Europe Pea Proteins Market is projected to grow from USD 586.94 million in 2024 to an estimated USD 1398.55 million by 2032, with a compound annual growth rate (CAGR) of 11.46% from 2024 to 2032.
The Europe pea protein market is primarily driven by the growing consumer demand for plant-based alternatives to animal proteins. Increasing health awareness among consumers has prompted a shift towards vegan, vegetarian, and flexitarian diets, as plant-based proteins like pea protein are considered healthier options. These proteins are also gaining popularity due to their high nutritional value, including essential amino acids, and are seen as beneficial for weight management, muscle recovery, and overall well-being. Environmental sustainability is another key driver, as pea protein production requires significantly fewer resources than traditional animal farming, such as water and land, and produces lower greenhouse gas emissions. Additionally, advancements in pea protein processing technologies have expanded its range of applications, making it suitable for use in a variety of food and beverage products, including meat substitutes, dairy alternatives, and protein-enriched snacks.
Germany is the leading market for pea protein in Europe, owing to its robust food technology sector and a high number of consumers prioritizing sustainability and eco-friendly products. The United Kingdom follows closely, benefiting from the country’s significant investments in plant-based food innovation and growing consumer demand for healthier, more sustainable diets. France is also experiencing rapid growth in the pea protein market, driven by the rise in flexitarian diets and an increasing focus on health and wellness. Other countries in Europe, including Italy, Spain, and the Nordic region, are emerging as key markets for pea protein. This is fueled by rising disposable incomes, increased awareness of the environmental impact of animal farming, and a growing interest in plant-based diets. Collectively, these regions are helping to shape a dynamic and diverse European market for pea protein, with significant opportunities for expansion across various consumer segments.
Access crucial information at unmatched prices!
Request your sample report today & start making informed decisions powered by Credence Research Inc.!
Download Sample
Market Insights:
- The Europe Pea Proteins Market is expected to grow from USD 586.94 million in 2024 to USD 1398.55 million by 2032, driven by rising demand for plant-based protein alternatives.
- The global pea proteins market is projected to grow from USD 2,229.15 million in 2024 to USD 5,618.92 million by 2032, at a CAGR of 12.25%.
- The shift towards vegan, vegetarian, and flexitarian diets is significantly increasing the demand for pea protein, as it is seen as a healthy and sustainable protein source.
- Pea protein’s environmental advantages, including lower resource use and reduced emissions compared to animal farming, are key factors supporting its growth in Europe.
- Advancements in pea protein processing technologies have expanded its versatility, enabling its use in meat substitutes, dairy alternatives, and protein-enriched snacks.
- Growing health awareness and the preference for clean-label, allergen-free, and natural ingredients are boosting the popularity of pea protein among European consumers.
- Supply chain challenges, such as fluctuations in crop yields and increasing demand from various industries, pose risks to the consistent availability of pea protein.
- Major markets in Europe, including Germany, the UK, and France, lead the way in pea protein adoption, while emerging markets in Southern and Eastern Europe are expected to see rapid growth.
Market Drivers:
Growing Demand for Plant-Based Proteins
The increasing consumer shift towards plant-based diets is a primary driver of the Europe pea protein market. As more individuals adopt vegan, vegetarian, and flexitarian lifestyles, the demand for plant-based protein sources has significantly risen. Pea protein, due to its rich amino acid profile, is considered a high-quality plant-based protein that can be used as an alternative to animal-derived proteins. Consumers are becoming more health-conscious and are seeking protein-rich food options that support muscle recovery, weight management, and overall wellness. This trend is particularly strong among millennials and Generation Z, who are more inclined to choose plant-based products for ethical, environmental, and health reasons.
Environmental Sustainability Concerns
Another key factor driving the growth of the pea protein market in Europe is the increasing awareness of the environmental impact of traditional animal farming. The production of pea protein is considerably more resource-efficient compared to animal-based proteins, requiring less land, water, and energy, and producing fewer greenhouse gas emissions. For instance, companies like Nordzucker AG have invested over EUR 100 million in new processing facilities for locally cultivated yellow peas, enhancing both the quality and availability of pea protein ingredients. As sustainability becomes a more pressing concern, consumers are increasingly seeking eco-friendly and sustainable food options. Pea protein’s low environmental footprint positions it as a preferred choice for environmentally-conscious consumers who are looking for ways to reduce their personal carbon footprints.
Innovation in Product Offerings
Advancements in pea protein processing technologies have expanded the versatility and functionality of pea protein, enabling its use in a wide range of food and beverage products. As manufacturers continue to innovate and improve processing methods, pea protein can now be incorporated into meat alternatives, dairy-free beverages, protein bars, and snacks, among other products. For instance, in 2023, Nestlé launched a pea protein-based version of its Nesquik drink in Spain and Portugal, targeting families seeking healthier, plant-based alternatives. The improvement in taste, texture, and nutritional profile of pea protein products has made them more appealing to a broader consumer base, including those who may not traditionally seek plant-based options. This innovation has opened new market opportunities and helped to cater to the growing demand for healthier, plant-based alternatives in the food industry.
Regulatory Support and Health Trends
Regulatory frameworks in Europe have increasingly supported plant-based diets and sustainable food production. European Union policies are focusing on promoting sustainability, reducing food waste, and encouraging plant-based eating habits, which align with the growth of the pea protein market. Additionally, the rise in health and wellness trends has contributed to the growing popularity of pea protein. As consumers become more health-conscious, there is a stronger preference for clean-label products with minimal processing and no artificial additives. Pea protein fits perfectly into this trend, as it is a natural, allergen-free, and nutritious ingredient that can cater to a variety of dietary preferences, further driving its demand in the region.
Market Trends:
Rise in Flexitarian Diets
One of the notable trends in the Europe pea protein market is the rise of the flexitarian diet. As consumers look to reduce their meat consumption without fully committing to a vegan or vegetarian lifestyle, the demand for plant-based protein alternatives, such as pea protein, continues to grow. This diet, which emphasizes plant-based foods while still allowing for occasional animal-based products, is gaining popularity, especially among health-conscious individuals who seek the benefits of plant-based proteins. This trend is influencing product development, with more manufacturers focusing on creating innovative, plant-based alternatives that appeal to flexitarians who prioritize taste, texture, and nutritional benefits in their food choices.
Increasing Popularity of Clean Label Products
Consumers in Europe are increasingly opting for clean-label products, and this trend is driving the demand for pea protein in food and beverage products. Clean-label products are those that contain minimal ingredients, with no artificial additives, preservatives, or coloring. As transparency and simplicity become significant factors in purchasing decisions, food manufacturers are responding by using pea protein as a key ingredient in their offerings. Pea protein, being natural and free from common allergens like gluten and soy, is highly valued in this trend. The growing preference for natural, non-GMO, and allergen-free products further supports the expansion of pea protein in the market.
Innovation in Pea Protein Applications
The versatility of pea protein continues to expand as manufacturers innovate and explore new applications for this ingredient. Pea protein is increasingly being used in a variety of product categories beyond traditional protein powders and meat substitutes, including dairy-free beverages, snacks, soups, and bakery products. The food industry is witnessing a shift towards protein-enriched products, and pea protein is an attractive option due to its neutral taste, ease of use, and health benefits. For instance, companies like Royal DSM have developed protein blends such as Vertis CanolaPRO, which, when combined with pea protein, improve the amino acid profile and functionality of plant-based foods. Companies are developing more advanced formulations, blending pea protein with other plant-based proteins to enhance its nutritional profile, thus broadening its appeal to health-conscious consumers looking for protein-rich, plant-based alternatives.
Expansion of Plant-Based Meat Alternatives
The growth of the plant-based meat substitute market in Europe is another significant trend driving the demand for pea protein. As more consumers opt for plant-based diets, the market for meat alternatives continues to flourish, particularly in countries like the United Kingdom, Germany, and France. Pea protein plays a central role in the development of these meat substitutes due to its excellent texture, ability to mimic the mouthfeel of meat, and high protein content. For instance, major brands like Endori and the Vegetarian Butcher have introduced pea protein-based meat substitutes that closely mimic the taste and mouthfeel of traditional meat, catering to consumers seeking healthier and more sustainable options. With an increasing focus on health and sustainability, many consumers are shifting towards plant-based meat alternatives as they look for options that provide the same nutritional benefits as meat without the environmental and ethical concerns associated with animal farming. This shift is further accelerating the demand for pea protein in the European market.
Market Challenges Analysis:
Supply Chain and Sourcing Challenges
One of the key challenges faced by the Europe pea protein market is the reliance on a limited supply of raw materials. While peas are increasingly cultivated in Europe, the supply chain for pea protein production can be susceptible to fluctuations in crop yields due to weather conditions, agricultural practices, and pest infestations. These issues can lead to price volatility and supply shortages, making it difficult for manufacturers to maintain consistent production. Additionally, the growing demand for peas from multiple industries, including the food and beverage sector, as well as animal feed production, can further strain the availability of peas, impacting the overall market dynamics.
Consumer Perception and Acceptance
Despite the growing popularity of plant-based diets, there are still challenges regarding consumer perception and acceptance of pea protein in certain European markets. Some consumers remain hesitant about incorporating plant-based proteins into their diets due to a lack of awareness about the nutritional benefits or concerns over the taste and texture of pea protein-based products. Convincing these consumers to adopt pea protein as a viable alternative to animal proteins remains a hurdle. Additionally, the market is highly competitive, with other plant-based proteins such as soy, rice, and hemp also vying for consumer attention, making it more challenging for pea protein to secure a dominant position in the market.
Regulatory Hurdles
The regulatory landscape surrounding plant-based ingredients, including pea protein, can pose a challenge to market expansion. While Europe has been generally supportive of plant-based food products, the regulatory approval processes for novel food ingredients, claims, and product formulations can be lengthy and complex. For instance, MycoTechnology, Inc. was granted exclusive rights by the European Commission in 2023 to market pea and rice protein fermented by Shiitake mushroom as a novel food for five years, illustrating the lengthy and complex process for novel ingredient approval in the EU. This can delay product launches or increase costs for manufacturers seeking to enter the market with new pea protein-based innovations. Additionally, differing regulations across European countries can create further complexities for companies looking to distribute pea protein products across multiple regions.
Market Opportunities:
The Europe pea protein market presents significant opportunities driven by the growing shift towards plant-based diets. With an increasing number of consumers adopting vegan, vegetarian, and flexitarian lifestyles, the demand for plant-based protein sources, including pea protein, is expected to rise substantially. This trend is particularly strong among health-conscious individuals seeking sustainable, allergen-free, and nutritious alternatives to animal proteins. As consumers become more aware of the environmental impact of animal farming, pea protein’s lower carbon footprint, water usage, and land requirements offer a compelling advantage. This growing preference for sustainable, plant-based food options creates ample opportunities for manufacturers to expand their product portfolios and meet the increasing demand for protein-rich, environmentally friendly foods.
The European market also presents substantial opportunities for innovation in pea protein applications. As food manufacturers increasingly focus on creating plant-based meat alternatives, dairy substitutes, and functional snacks, pea protein serves as a key ingredient due to its versatility, nutritional profile, and texture. There is significant potential for product innovation in developing new pea protein formulations to cater to the rising demand for clean-label, gluten-free, and non-GMO foods. Additionally, the growing popularity of ready-to-eat, protein-enriched snacks and beverages provides an opportunity for pea protein to be incorporated into a wide range of convenient, on-the-go food products. Companies that focus on enhancing the functional benefits of pea protein through innovative applications will be well-positioned to capitalize on this rapidly expanding market segment.
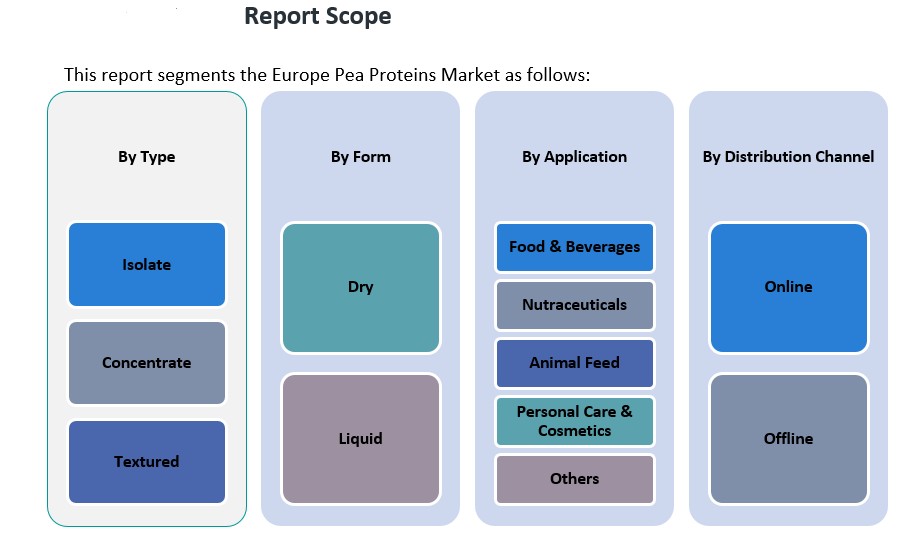
Market Segmentation Analysis:
The Europe pea protein market is segmented by type, application, form, and distribution channel, with each segment exhibiting distinct growth drivers and trends.
By Type
The pea protein market in Europe is primarily divided into isolates, concentrates, and textured varieties. Isolate holds the largest market share due to its high protein content and versatility in food and beverage applications. Concentrate follows closely, offering a cost-effective solution for various plant-based food products. Textured pea protein is gaining traction, particularly in meat substitutes, due to its ability to mimic the texture of meat, making it a popular choice in plant-based food innovations.
By Application
The largest share of the pea protein market is in the food and beverages sector, driven by the rising demand for plant-based protein alternatives in dairy-free products, protein bars, and meat substitutes. Nutraceuticals is another growing application, as consumers seek functional foods with added health benefits such as enhanced muscle recovery and immune support. Animal feed also represents a significant segment, as pea protein is increasingly used in animal diets, especially in the context of sustainable farming practices. The personal care and cosmetics segment, though smaller, is expanding due to the growing use of pea protein in skincare products for its moisturizing and anti-aging properties.
By Form
Pea protein is available in dry and liquid forms, with dry pea protein being more popular due to its longer shelf life and ease of storage. However, the demand for liquid forms is rising in ready-to-drink beverages and functional drinks.
By Distribution Channel
The market is served through both online and offline distribution channels, with offline channels such as supermarkets and health food stores maintaining a dominant share. However, online sales are rapidly growing as consumers increasingly seek convenience and variety when purchasing plant-based protein products.
Segmentation:
By Type
- Isolate
- Concentrate
- Textured
By Application
- Food & Beverages
- Nutraceuticals
- Animal Feed
- Personal Care & Cosmetics
- Others
By Form
By Distribution Channel
Regional Analysis:
The Europe pea protein market is characterized by diverse regional dynamics, with each region exhibiting unique trends and growth drivers. The market is expected to witness steady growth across all regions, driven by the increasing consumer demand for plant-based proteins and the rising focus on sustainability and health.
Germany
Germany holds the largest share of the Europe pea protein market, accounting for approximately 25% of the total market. The country’s strong food technology sector, combined with a growing consumer preference for plant-based alternatives, contributes significantly to this dominance. Germany is also a key hub for plant-based food innovation, with numerous manufacturers and research institutions focusing on developing pea protein-based products. The country’s robust food retail and foodservice industries further bolster demand for pea protein, particularly in meat substitutes and dairy alternatives.
United Kingdom
The United Kingdom is another major player in the European pea protein market, with an estimated market share of 20%. The country’s increasing adoption of flexitarian diets, combined with a strong emphasis on health and wellness, is fueling the demand for plant-based proteins. The UK is witnessing rapid growth in the plant-based food sector, particularly in the ready-to-eat meal and snack segments. Government initiatives to promote sustainable food practices also support the adoption of pea protein, making it an attractive option for both manufacturers and consumers.
France
France holds a market share of approximately 15%, and its growth is driven by an increasing number of consumers embracing plant-based diets. The rising trend of flexitarianism and the growing demand for clean-label and allergen-free products are key factors contributing to the market’s expansion in France. Additionally, France is witnessing increasing investments in plant-based food innovations, with pea protein being used in a variety of applications, including plant-based dairy products and meat analogs.
Nordic Countries
The Nordic region, including Sweden, Denmark, and Finland, accounts for around 10% of the Europe pea protein market. The region’s strong environmental awareness, coupled with a high adoption rate of sustainable and plant-based diets, is driving the demand for pea protein. The preference for clean-label and eco-friendly products is particularly prevalent in countries like Sweden, where consumers actively seek plant-based alternatives to support environmental sustainability.
Southern Europe
Southern European countries, including Italy, Spain, and Portugal, collectively hold around 15% of the market share. In these regions, the rising popularity of plant-based diets, particularly among younger populations, is fueling the demand for pea protein. The Mediterranean diet’s emphasis on fresh and healthy ingredients aligns well with the growing interest in plant-based proteins. Additionally, Southern Europe is witnessing a surge in the demand for plant-based meat and dairy substitutes, further driving the adoption of pea protein.
Other Regions
The remaining 15% of the Europe pea protein market is attributed to other European countries, including Eastern European nations such as Poland, Hungary, and the Czech Republic. While these regions currently hold a smaller share, they are expected to experience rapid growth as awareness of plant-based diets and sustainable food practices increases.
Key Player Analysis:
- Roquette Frères
- Cosucra Groupe Warcoing
- Burcon NutraScience Corporation
- Emsland Group
- Shandong Jianyuan Group
- Naturz Organics
- Fenchem Biotek Ltd.
- Kerry Group
- Sotexpro
- Meelunie B.V.
Competitive Analysis:
The Europe pea protein market is highly competitive, with several key players driving innovation and market expansion. Prominent companies include Roquette Frères, Cargill, Ingredion, and Cosucra, which have established strong footholds in the region. These companies are focusing on product development, enhancing the functionality of pea protein, and expanding their product portfolios to cater to the growing demand for plant-based proteins. Roquette Frères, a leader in plant-based proteins, has made significant investments in pea protein production, with advanced processing facilities in Europe. Cargill and Ingredion, both major players in the global food ingredients market, are increasingly tapping into the plant-based protein sector, leveraging their extensive distribution networks and product innovations. Additionally, smaller players and regional producers are entering the market, contributing to the overall growth. The increasing focus on sustainability, clean-label products, and the development of pea protein applications for various industries continue to drive competition in the market.
Recent Developments:
- In February 2024, Roquette Frères expanded its NUTRALYS® plant protein range by launching four new multi-functional pea proteins: NUTRALYS® Pea F853M (isolate), NUTRALYS® H85 (hydrolysate), NUTRALYS® T Pea 700FL (textured), and NUTRALYS® T Pea 700M (textured). These innovations are designed to enhance taste, texture, and functionality in plant-based foods and beverages, opening new formulation opportunities for manufacturers of nutritional bars, protein drinks, and meat and dairy alternatives.
- In December 2024, Burcon NutraScience Corporation launched Peazazz®C, a next-generation pea protein isolate featuring over 90% protein purity, low sodium content, and a neutral taste profile. Developed using proprietary technology, Peazazz®C is designed for a broad spectrum of applications, including beverages, dairy alternatives, baked goods, nutrition bars, and meal replacements, targeting the growing demand for high-quality, sustainable plant proteins.
- In April 2025, Lantmännen, a leading Swedish agricultural cooperative, secured a €50 million loan from the European Investment Bank (EIB) to co-finance the construction of a new pea protein isolate factory in Lidköping, Sweden. This facility, the first of its kind in the country, is expected to be completed in the first half of 2027 and will process over 40,000 tonnes of locally grown peas annually.
Market Concentration & Characteristics:
The Europe pea protein market is characterized by a low to moderate concentration, with both multinational corporations and regional players competing for market share. Leading companies such as Roquette Frères, Ingredion, and Cosucra dominate the market, leveraging their established distribution networks and research capabilities. However, the market also includes smaller and mid-sized players focusing on niche applications and regional markets, which fosters innovation and adaptability to local consumer preferences. In 2024, Europe accounted for approximately 26.1% of the global pea protein market, with Germany leading at 32.8%, followed by the United Kingdom at 22.9%, and other significant markets including France, Italy, and Spain. The market exhibits several key characteristics, including product segmentation into pea protein isolates, concentrates, and textured proteins, with isolates holding the largest share due to their high protein content and versatility across various applications. The food and beverage sector dominates the market, driven by the rising demand for plant-based alternatives, while other sectors such as nutraceuticals, animal feed, and personal care products also contribute to growth. Geographic distribution reveals that Germany, the United Kingdom, and France are the primary markets, with Germany showing the highest growth rate. Additionally, consumer trends toward clean-label, allergen-free, and sustainable products are significantly influencing market demand, further propelling the growth of pea protein in Europe.
Shape Your Report to Specific Countries or Regions & Enjoy 30% Off!
Report Coverage:
The research report offers an in-depth analysis based on Type, Application, Form and Distribution Channel. It details leading market players, providing an overview of their business, product offerings, investments, revenue streams, and key applications. Additionally, the report includes insights into the competitive environment, SWOT analysis, current market trends, as well as the primary drivers and constraints. Furthermore, it discusses various factors that have driven market expansion in recent years. The report also explores market dynamics, regulatory scenarios, and technological advancements that are shaping the industry. It assesses the impact of external factors and global economic changes on market growth. Lastly, it provides strategic recommendations for new entrants and established companies to navigate the complexities of the market.
Future Outlook:
- The Europe pea protein market is expected to experience continued strong growth in the coming years.
- Rising consumer demand for plant-based and sustainable food products will remain a key driver of market expansion.
- Ongoing innovation in pea protein applications, particularly in meat substitutes and dairy alternatives, will diversify product offerings.
- The increasing popularity of flexitarian diets across Europe will encourage more widespread use of pea protein in conventional food products.
- Supportive regulatory frameworks for plant-based food products will contribute to favorable market conditions.
- Improvements in pea protein processing technologies will enhance product quality, taste, and texture.
- Growing consumer preference for clean-label, allergen-free, and non-GMO products will boost the demand for pea protein.
- Major markets such as Germany, the UK, and France will continue to lead, driven by sustainability and health trends.
- Online distribution channels will see significant growth, offering consumers greater convenience and access to a variety of pea protein products.
- Emerging markets in Southern and Eastern Europe will adopt pea protein more rapidly as awareness of plant-based benefits increases.


