
| REPORT ATTRIBUTE | DETAILS |
|---|---|
| Historical Period | 2019-2022 |
| Base Year | 2023 |
| Forecast Period | 2024-2032 |
| Family Indoor Entertainment Centres (FECs) Market Size 2024 | USD 30,285 million |
| Family Indoor Entertainment Centres (FECs) Market, CAGR | 9.9% |
| Family Indoor Entertainment Centres (FECs) Market Size 2032 | USD 64,447.95 million |
Market Overview:
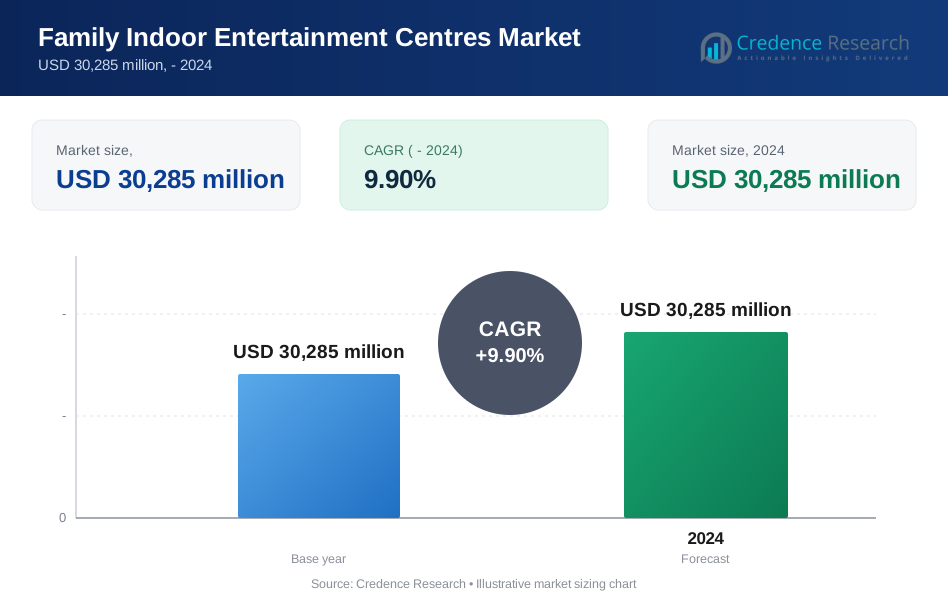
The Family Indoor Entertainment Centres (FECs) Market is poised to grow from USD 30,285 million in 2024 to USD 64,447.95 million by 2032 at a compound annual growth rate (CAGR) of 9.9% during the forecast period, 2024-2032.
This growth is fueled by the rising urbanization, increasing disposable incomes, and the growing preference for indoor entertainment options that offer a safe and enjoyable environment for families. Market drivers include the rapid urbanization and expanding middle-class population, which are leading to higher disposable incomes and increased spending on leisure activities. The growing trend of shopping malls incorporating FECs as anchor attractions to increase foot traffic and enhance the overall customer experience is also driving market growth. Additionally, advancements in technology, such as virtual reality (VR) and augmented reality (AR), are being integrated into FECs to offer unique and immersive experiences, further boosting their popularity. The increasing focus on safety and hygiene, particularly in the wake of the COVID-19 pandemic, has led FEC operators to adopt stringent health protocols, which has helped regain customer confidence and drive market growth.
Regional analysis reveals that North America holds the largest market share, driven by the high disposable incomes, well-established infrastructure, and the presence of key market players. The United States, in particular, is a major contributor to the market, with a strong emphasis on family entertainment and leisure activities. Europe also holds a significant market share, with countries like the United Kingdom, Germany, and France witnessing high demand for indoor entertainment centres. The Asia-Pacific region is expected to witness the fastest growth, fueled by the rapid urbanization, increasing disposable incomes, and the expanding middle-class population in countries like China and India. The region's growing focus on developing entertainment infrastructure and the rising popularity of shopping malls and retail complexes are also contributing to market growth. Overall, the Family Indoor Entertainment Centres Market is poised for substantial expansion, driven by the increasing demand for safe and enjoyable family-oriented recreational activities across various regions.
Market Insights:
- The market is projected to grow from USD 30,285 million in 2024 to USD 64,447.95 million by 2032, driven by rising demand for engaging family-friendly entertainment options.
- Increasing disposable incomes and consumer preference for recreational activities are key drivers of market growth.
- Technological advancements, such as augmented reality (AR) and virtual reality (VR), are transforming family entertainment centres into immersive and interactive experiences.
- The integration of food and beverage services and edutainment elements enhances the overall customer appeal and broadens the target demographic.
- High initial investments and operational costs pose challenges for small and medium-sized FEC operators.
- North America dominates the market, supported by high consumer spending and established infrastructure, while Asia-Pacific is the fastest-growing region due to urbanization and a rising middle class.
- Emerging markets in Latin America and the Middle East & Africa show potential as disposable incomes and modern entertainment demand increase.
Market Drivers:
Rising Consumer Spending and Urbanization:
The increasing disposable income and changing urban lifestyle patterns are driving significant growth in the Family Indoor Entertainment Centers (FECs) market. For instance, according to World Bank data, more than 50% of the world's population now resides in urban regions, with projections showing urban populations will reach 6 billion by 2045. This urbanization trend is particularly pronounced in countries like India, where the middle class is expected to grow from 50 million people in 2020 to 583 million by 2025, with their incomes ballooning to 51.5 trillion rupees ($1.1 billion), 11 times the level of today and 58 percent of total Indian income. For instance, young adults aged 20-25 represent the fastest-growing consumer segment, with this demographic spending an average of 20 hours per week on gaming and entertainment activities. This shift in consumer behavior is also evident in the U.S., where 21 percent of adults aged 18 to 29 years spent six to ten hours per week playing video games in 2024.
Technological Integration and Innovation:
The integration of advanced technologies is revolutionizing the FEC landscape. For instance, modern centers incorporate AI-powered gaming systems, virtual reality experiences, and interactive digital platforms. The AR and VR gaming zones segment demonstrates the highest growth potential, with more than 60% of visitors being school-aged children between 9-12 years. For instance, industrial platforms in these centers generate between 1-2 terabytes of data daily through 350,000 to 500,000 sensors, enabling enhanced customer experiences and operational efficiency. This technological advancement is not just limited to gaming; for example, VR technology is being widely embraced in education, with VR educational games for kids and teens becoming increasingly popular, offering immersive learning experiences that cater to visual and physical learners.
Social Media and Community Engagement:
Social media platforms have become crucial drivers for FEC growth, particularly in attracting younger demographics. For instance, the teenagers (13-19) segment maintains market dominance due to the increasing popularity of arcade games and amusement parks. For instance, Spectrum Metro's new 71,000 sq. ft Family Entertainment Center in India demonstrates the industry's commitment to creating comprehensive entertainment hubs that combine amusement parks, fitness options, and sports experiences. This trend is also evident in the U.S., where social media trends for 2025 include content experimentation, social listening, and the integration of generative AI, all of which are being utilized by FECs to engage with their audience more effectively.
Weather-Independent Entertainment Solutions:
The demand for weather-independent entertainment options continues to fuel FEC growth, particularly in urban areas. For instance, the industry is experiencing a significant shift toward experiential spending, with consumers prioritizing experiences over material goods. Centers incorporating hybrid entertainment concepts, combining traditional arcade games with educational elements, show particularly strong performance in North America, which dominates the market with approximately 40% market share as of 2023. For instance, in India, Spectrum@Metro has become a rising family entertainment hub, offering a holistic experience to visitors with its expansive phases and strategic proximity to residential areas, ensuring convenient access for daily commuters and visitors.
Market Trends:
Virtual and Augmented Reality Integration:
The adoption of immersive technologies is revolutionizing the family entertainment center experience. For instance, modern facilities incorporate AI-driven interactivity and motion-tracking technology, enabling venues to update attractions without physical modifications, while maintaining a 40-50% customer return rate. For instance, VR and AR technologies are revolutionizing children's entertainment centers by offering immersive and interactive experiences, with VR allowing children to explore fantastical worlds and AR enhancing physical play areas with digital elements.
Hybrid Entertainment Concepts:
Entertainment centers are evolving toward comprehensive leisure destinations that combine multiple activities under one roof. For instance, the 20,000 to 40,000 sq. ft segment dominates the market, with facilities typically featuring 20-30 arcade games, 3-5 major attractions, and 10-15 different games or activities. For instance, the average FEC welcomes 150,000-200,000 visitors annually, with families spending approximately $50-$75 per visit. For instance, the integration of AR and VR into traditional play structures is enhancing the interactive experiences offered at FECs, providing immersive environments that encourage creative play and learning.
Digital Transformation and Smart Operations:
Advanced technological integration is reshaping operational efficiency in family entertainment centers. For instance, modern facilities generate between 1-2 terabytes of data daily through 350,000 to 500,000 sensors, enabling enhanced customer experiences through smart ticketing and reservation systems. For instance, about 70% of FECs use customer feedback surveys to improve their offerings, with business peaks occurring during 3-5 months annually, often aligning with school vacations and holidays. For instance, the integration of IoT with AI and machine learning is revolutionizing manufacturing processes, allowing for real-time data collection and analytics to optimize operations and minimize downtime.
Family-Centric Dining Experiences:
The food and beverage sector are emerging as the fastest-growing revenue source for family entertainment centers. For instance, centers are introducing premium dining options specifically designed for different age groups, with 60% of visitors being school-aged children between 9-12 years. For instance, the integration of themed dining restaurants and snack stalls has become a key revenue generator, with approximately 60% of FECs including complementary attractions like laser tag arenas and 70% featuring bowling alleys. For instance, the food and beverage segment is expected to witness the highest growth due to the increase in availability of different food options for kids as well as adults, with people preferring FECs as locations of choice for corporate parties and birthday parties.
Market Challenges Analysis:
High Initial Investment and Operating Costs:
The substantial capital requirements for establishing and maintaining Family Indoor Entertainment Centers (FECs) pose significant market barriers. For instance, according to the U.S. Department of Commerce's industry reports, initial setup costs range from $1-5 million, with ongoing operational expenses accounting for 25-30% of annual revenue. For instance, the Consumer Product Safety Commission mandates strict safety standards, requiring additional investments in equipment upgrades and maintenance protocols. For instance, the cost of leasehold improvements can vary widely, with estimates ranging from $50,000 to $150,000 or more, depending on the size and scope of the facility. For instance, specialized entertainment equipment and technology can cost between $100,000 to $500,000, further adding to the initial investment.
Customer Retention and Competition:
Entertainment centers face mounting challenges in maintaining visitor loyalty amid increasing competition. For instance, the Federal Trade Commission reports that approximately 40% of FECs struggle with customer retention due to limited ability to regularly update attractions. For instance, centers require significant capital, averaging $500,000-$750,000, to modify or introduce new attractions, while space constraints in urban locations further complicate expansion possibilities. For instance, the constant need to upgrade and maintain play equipment, incorporate the latest technology, and ensure compliance with health and safety standards demands significant capital, making it harder for smaller or independent centers to manage costs while keeping prices affordable.
Regulatory Compliance and Safety Standards:
The Occupational Safety and Health Administration (OSHA) enforces stringent safety regulations that impact operational costs and facility management. For instance, centers must comply with specific requirements for equipment safety, staff training, and emergency protocols, leading to increased insurance premiums by 15-20% annually. For instance, local zoning boards and municipal authorities impose additional restrictions on operating hours and capacity limits. For instance, the cost of obtaining licenses and permits for legal compliance can range from $5,000 to $20,000, further adding to the financial burden.
Economic Sensitivity and Price Escalation:
The Bureau of Labor Statistics indicates that entertainment center ticket prices have risen by 25-30% over the past three years, significantly impacting middle-income families. For instance, centers face challenges in balancing operational costs with affordable pricing, particularly as consumer discretionary spending fluctuates. For instance, the National Recreation and Park Association reports that approximately 35% of families cite high ticket prices as a primary deterrent to regular visits. For instance, the rising operational costs, including utility costs such as electricity, water, and heating, are also impacting profitability, making it harder for FECs to manage costs while keeping prices competitive.
Market Opportunities:
The Family Indoor Entertainment Centres (FECs) market offers significant growth opportunities, driven by the rising demand for diverse and engaging recreational activities that cater to all age groups. As consumer preferences shift toward experiences that combine fun, education, and social interaction, FEC operators are exploring innovative concepts, such as augmented reality (AR), virtual reality (VR), and gamified learning. The growing popularity of themed entertainment and multi-activity centres further underscores the market's potential. Additionally, the integration of food and beverage services, along with tailored spaces for events such as birthdays and corporate gatherings, is enabling FECs to attract a wider customer base and generate higher revenues.
Emerging economies present untapped opportunities, particularly in regions such as Asia-Pacific, Latin America, and the Middle East & Africa, where rising disposable incomes and rapid urbanization are driving demand for modern entertainment facilities. Investments in infrastructure development and government support for leisure and tourism initiatives further bolster market growth. Technological advancements and the adoption of mobile booking platforms and loyalty programs enhance customer engagement, creating additional revenue streams. As global consumers increasingly prioritize safe, inclusive, and high-quality entertainment options, the FEC market is well-positioned for sustained growth and innovation, making it a focal point in the global leisure and entertainment industry.
Market Segmentation Analysis:
By FEC Type, the market includes arcade studios, physical play activities, skill/competition games, AR and VR gaming zones, and other activity areas. Arcade studios offer a variety of arcade games, while physical play activities include trampoline parks and obstacle courses. Skill/competition games encompass activities like bowling and laser tag, and AR and VR gaming zones provide immersive virtual reality experiences.
By Visitors Demographics, the market caters to families with children (0-8), families with children (9-12), teenagers (13-19), young adults (20-25), and adults (25+). Each demographic segment has unique preferences and requirements, with families seeking safe and engaging activities for their children, and teenagers and young adults looking for more thrilling and competitive experiences.
By Facility Size, the market is divided into facilities of different sizes, ranging from less than 5,000 sq. ft. to over 30 acres. Smaller facilities often focus on niche activities and cater to local communities, while larger facilities offer a wider range of attractions and amenities, attracting a larger and more diverse visitor base.
Segmentations:
By FEC Type:
- Arcade Studios
- VR Gaming Zones
- Sports Arcades
- Others
By Visitors Demographics:
- Families with Children (0–9)
- Families With Children (9–12)
- Teenagers (12–18)
- Young Adults (18–24)
- Adults (24+)
By Facility Size:
- <5,000 Sq. ft.
- 5,001 to 10,000 Sq. ft.
- 10,001 to 20,000 Sq. ft.
- 20,001 to 40,000 Sq. ft.
- >40,000 Sq. ft
By Attendance per day:
- <25,000
- 25,001 to 50,000
- 50,001 to 100,000
- 100,001 to 250,000
- >250,000
By Revenue Source:
- Entry Fees & Ticket Sales
- Food & Beverages
- Merchandising
- Advertising
- Others
By Region:
- North America
- The U.S.
- Canada
- Mexico
- Europe
- Germany
- France
- The U.K.
- Italy
- Spain
- Rest of Europe
- Asia Pacific
- China
- Japan
- India
- South Korea
- South-east Asia
- Rest of Asia Pacific
- Latin America
- Brazil
- Argentina
- Rest of Latin America
- Middle East & Africa
- GCC Countries
- South Africa
- Rest of the Middle East and Africa
Regional Analysis:
North America
North American market dominates the Family Indoor Entertainment Centres (FECs) market, accounting for 35% of global revenue in 2024. This dominance is driven by high disposable incomes, with average household spending on entertainment exceeding $2,500 annually in the United States. For instance, robust consumer spending on leisure activities and well-established entertainment infrastructure further bolster the market. For instance, the United States leads the region, supported by the presence of major FEC chains such as Dave & Buster’s and Chuck E. Cheese, which collectively operate over 500 locations. For instance, investments in advanced technologies like virtual reality (VR) and augmented reality (AR) have increased by 20% year-on-year, enhancing customer experiences. For instance, the integration of food and beverage services accounts for nearly 30% of total FEC revenue. For instance, Canada also contributes significantly, with urban areas witnessing a 15% increase in family-oriented activity centres in 2023.
Asia-Pacific
Asia-Pacific region is the fastest-growing market, capturing 30% of the global share in 2024. Rapid urbanization has resulted in over 60% of the population living in urban areas in China, driving demand for entertainment facilities. For instance, China’s entertainment sector grew by 18% in 2023, supported by government initiatives promoting leisure and tourism, such as investments exceeding $20 billion in theme parks and FECs. For instance, India’s retail boom, with over 500 new malls planned by 2030, is creating opportunities for FEC operators to expand. For instance, the adoption of mobile booking apps and gamified activities has surged by 25%, particularly among tech-savvy youth, accelerating market growth.
Europe
Europe holds a significant 20% share of the global FEC market, with Germany, the UK, and France driving growth. For instance, Germany leads the region, accounting for 35% of Europe’s FEC revenue, fueled by innovations such as VR-based educational gaming. For instance, European FECs are increasingly adopting sustainability practices, with nearly 40% of new centres incorporating eco-friendly designs. For instance, the inclusion of local and cultural themes has resulted in a 15% rise in customer engagement, particularly in themed entertainment venues.
Latin America
Latin America represents 10% of the market, led by Brazil and Mexico. For instance, Brazil’s urban population, which exceeds 87%, is driving demand for modern FECs, with mall-based entertainment centres accounting for 25% of the market. For instance, Mexico’s proximity to North America facilitates access to advanced technologies, but high operational costs and limited digital infrastructure continue to challenge some operators.
Middle East & Africa
The Middle East & Africa (MEA) accounts for 5% of the market. For instance, growth is driven by large-scale projects such as Saudi Arabia’s $500 billion NEOM city and UAE’s mega mall developments, with leisure and tourism investments growing by 12% annually. For instance, however, economic disparities and limited technology access restrict broader market penetration.
Key Player Analysis:
- Dave & Buster’s
- CEC Entertainment (Chuck E. Cheese)
- Cinergy Entertainment
- KidZania
- Scene75 Entertainment
- Main Event Entertainment
- Legoland Discovery Center
- Smaaash Entertainment
- Lucky Strike Entertainment
- FunCity
Competitive Analysis:
The Family Indoor Entertainment Centers market exhibits a moderately fragmented competitive landscape with several key players dominating regional segments. For instance, North America leads with approximately 40% market share in 2023, driven by rising disposable incomes and increasing emphasis on family-oriented leisure activities. For instance, major players include Dave & Buster's, The Walt Disney Company, CEC Entertainment Inc., and Merlin Entertainments, who maintain significant market presence through continuous innovation and strategic partnerships. For instance, Dave & Buster's reported a 6.3% increase in revenue to $599.1 million in the fourth quarter of 2023, showcasing their growth and market dominance. For instance, Merlin Entertainments, a global leader in location-based entertainment, reported record revenues in 2023, with a 13% increase in visitors over 2022, highlighting their strong market position. For instance, these industry leaders differentiate themselves through comprehensive entertainment offerings, combining traditional arcade games with advanced VR experiences and themed attractions. For instance, Merlin Entertainments launched a new LEGO® VR attraction at several of its locations in April 2023, blending physical play with digital elements to offer an immersive, interactive adventure for families. For instance, recent strategic developments include NEOM and MBC's partnership to establish AAA games studios in Saudi Arabia, demonstrating the industry's focus on technological integration. For instance, the gaming market in the Middle East and North Africa (MENA) reached $6 billion in 2021, underscoring the potential for this new gaming studio in NEOM to develop the sector in Saudi Arabia. For instance, companies are increasingly investing in digital transformation, with modern facilities generating between 1-2 terabytes of operational data daily through 350,000 to 500,000 sensors for enhanced customer experience management.
Recent Developments:
- In April 2022, Dave & Buster's expanded its footprint by acquiring Main Event for $835 million, adding 50 locations to its portfolio and enhancing its family entertainment offerings.
- In December 2023, Cinergy Entertainment launched "Cinergy Elite Plus," a membership program offering exclusive benefits to enhance customer engagement and loyalty.
Market Concentration & Characteristics:
The Family Indoor Entertainment Centres (FECs) market exhibits a moderately fragmented structure, characterized by a mix of established global players and regional operators catering to diverse consumer needs. Prominent companies such as Dave & Buster’s, CEC Entertainment (Chuck E. Cheese), and KidZania dominate the competitive landscape through strong brand presence, extensive networks, and innovative offerings. These leaders leverage advanced technologies like virtual reality (VR) and gamification to attract and retain customers. Regional players, often focusing on niche markets, provide tailored experiences to address local preferences, such as themed entertainment and educational activities. The market is defined by dynamic consumer demand for family-oriented, safe, and diverse entertainment options. Integration of food and beverage services, event hosting capabilities, and advancements in immersive technology further characterize the industry, highlighting its adaptability and potential for sustained growth amid evolving consumer trends and preferences.
Report Coverage:
The research report offers an in-depth analysis based on FEC Type, Visitors Demographics, Facility Size, and Revenue Source. It details leading market players, providing an overview of their business, product offerings, investments, revenue streams, and key applications. Additionally, the report includes insights into the competitive environment, SWOT analysis, current market trends, as well as the primary drivers and constraints. Furthermore, it discusses various factors that have driven market expansion in recent years. The report also explores market dynamics, regulatory scenarios, and technological advancements that are shaping the industry. It assesses the impact of external factors and global economic changes on market growth. Lastly, it provides strategic recommendations for new entrants and established companies to navigate the complexities of the market.
Future Outlook:
- Technological advancements, including augmented reality (AR) and virtual reality (VR), will transform FECs into immersive and interactive entertainment hubs.
- Rising disposable incomes and consumer preferences for family-oriented leisure activities will drive market growth across urban and semi-urban areas.
- Integration of gamification and mobile app-based booking systems will enhance customer engagement and streamline operations.
- Themed entertainment experiences, combining education and recreation, will gain popularity among families and younger audiences.
- Emerging markets in Asia-Pacific, Latin America, and the Middle East will offer significant growth opportunities due to urbanization and rising middle-class populations.
- Collaboration between FEC operators and retail spaces, such as malls, will help drive foot traffic and expand service offerings.
- Focus on sustainability and eco-friendly designs in FECs will align with global trends and appeal to environmentally conscious consumers.
- Event hosting capabilities, including birthday parties and corporate gatherings, will continue to be a major revenue stream for FEC operators.
- Adoption of advanced analytics and AI-driven insights will optimize operations, enhance customer satisfaction, and improve revenue generation.
- Strategic investments in hybrid entertainment models, combining physical and digital experiences, will redefine the market’s competitive landscape.
Request a Free Sample
Fill in your details and we'll send you a free sample report.
- Sample data tables & charts
- Research methodology
Market Dynamics
Urbanization and Rising Disposable Incomes
Rapid urbanization and the expansion of the middle class, especially in Asia-Pacific and North America, are increasing the number of families with higher disposable incomes who seek safe, convenient, and engaging indoor entertainment options.
Technological Integration (AR/VR)
The adoption of advanced technologies such as augmented reality (AR) and virtual reality (VR) is transforming FECs into immersive, interactive destinations, attracting tech-savvy youth and families looking for novel experiences.
Mall and Retail Complex Integration
Shopping malls and retail complexes are increasingly incorporating FECs as anchor attractions to boost foot traffic and enhance the overall customer experience, driving demand for diverse entertainment offerings.
Focus on Safety, Hygiene, and Family-Centric Experiences
Post-pandemic consumer preferences for safe, clean, and family-oriented environments have led FEC operators to implement stringent health protocols and offer tailored experiences, regaining customer confidence and increasing repeat visits.
Diversification of Revenue Streams
The integration of food and beverage services, event hosting (such as birthday parties and corporate gatherings), and merchandising is enabling FECs to attract a broader demographic and increase per-visit spending, supporting sustained market growth.
Need a Custom Version of This Report?
Tailor the scope, geography, or segments to your exact requirements.
- Custom geography or segment scope
- Direct access to our analyst team
Frequently Asked Questions
What is the current size of the Family Indoor Entertainment Centres Market?
What factors are driving the growth of the Family Indoor Entertainment Centres Market?
What are some challenges faced by the Family Indoor Entertainment Centres Market?
Who are the major players in the Family Indoor Entertainment Centres Market?
Which segment is leading the market share?
Table of Content
Chapter 1 Market Segmentation
- 1.1 Segmentation Framework
- 1.1.1 Product and Service Classification
- 1.1.2 Application and End-Use Classification
- 1.1.3 Technology and Solution Classification
- 1.1.4 Customer and Distribution Channel Classification
- 1.1.5 Geographic Segmentation
- 1.1.6 Market Segment Definitions and Boundaries
- 1.2 By FEC Type
- 1.2.1 Arcade Studios
- 1.2.2 VR Gaming Zones
- 1.2.3 Sports Arcades
- 1.2.4 Physical Play Activities
- 1.2.5 Skill/Competition Games
- 1.2.6 Others
- 1.3 By Facility Size
- 1.3.1 <5,000 Sq. ft.
- 1.3.2 5,001 to 10,000 Sq. ft.
- 1.3.3 10,001 to 20,000 Sq. ft.
- 1.3.4 20,001 to 40,000 Sq. ft.
- 1.3.5 >40,000 Sq. ft
- 1.4 By Revenue Source
- 1.4.1 Entry Fees & Ticket Sales
- 1.4.2 Food & Beverages
- 1.4.3 Merchandising
- 1.4.4 Advertising
- 1.4.5 Others
- 1.5 By Visitors Demographics
- 1.5.1 Families with Children (0–9)
- 1.5.2 Families with Children (9–12)
- 1.5.3 Teenagers (12–18)
- 1.5.4 Young Adults (18–24)
- 1.5.5 Adults (24+)
Chapter 2 Introduction
- 2.1 Report Objectives and Scope
- 2.2 Product Definition and Industry Terminology
- 2.3 Market Inclusions and Exclusions
- 2.4 Research Process
- 2.4.1 Primary Research and Expert Interviews
- 2.4.2 Secondary Research and Source Review
- 2.4.3 Top-Down and Bottom-Up Estimation
- 2.4.4 Data Triangulation and Verification
- 2.5 Market Size Measurement Basis
- 2.5.1 2024: USD 30,285 million → 2024: USD 30,285 million
- 2.6 Historical and Forecast Reference Periods
- 2.6.1 Base Year: 2024
- 2.6.2 Forecast Period: 2024-2024
- 2.7 Research Assumptions and Limitations
Chapter 3 Executive Summary
- 3.1 Market Snapshot and Key Findings
- 3.2 Base-Year Market Size, 2024
- 3.3 Forecast Market Size, 2024
- 3.4 Revenue and Volume Growth Outlook
- 3.5 Key Demand and Supply Indicators
- 3.6 Leading Market Segments
- 3.7 Fastest-Growing Market Opportunities
- 3.8 Regional Performance Highlights
- 3.9 Technology and Industry Transformation
- 3.10 Competitive Landscape Summary
- 3.11 Analyst View and Strategic Implications
Chapter 4 Global Family Indoor Entertainment Centres Market Trends and Developments
- 4.1 Historical Industry Development
- 4.2 Recent Market Trends and Developments
- 4.3 Demand and Customer Behavior Trends
- 4.4 Technology and Product Innovation
- 4.5 Artificial Intelligence, Automation and Digitalization
- 4.6 Local Manufacturing and Supply Chain Realignment
- 4.7 Industry Partnerships, Mergers and Acquisitions
- 4.8 Sustainability and Circular Economy Developments
- 4.9 Government and Private Sector Investment Trends
- 4.10 Emerging Business Models and Commercialization
- 4.11 Industry Developments and Announcements
Chapter 5 Global Family Indoor Entertainment Centres Market Production, Supply and Demand Analysis
- 5.1 Demand Trend and Consumption Analysis
- 5.2 Demand Forecast, 2024-2024
- 5.3 Production and Output Trend
- 5.4 Production and Output Forecast, 2024-2024
- 5.5 Installed Capacity and Capacity Utilization
- 5.6 Company-Wise Production Plants and Statistics
- 5.6.1 Installed Production Capacity
- 5.6.2 Actual Production
- 5.6.3 Planned Capacity and Expansion Targets
- 5.7 Supply Chain Structure and Procurement Trends
- 5.8 Supply-Demand Gap and Bottlenecks
- 5.9 Import Dependence and Sourcing Structure
- 5.10 Contract Manufacturing and Outsourcing
- 5.11 Regional Supply and Demand Concentration
Chapter 6 Global Family Indoor Entertainment Centres Market Pricing Analysis
- 6.1 Pricing Structure and Measurement
- 6.2 Historical Pricing Trends
- 6.3 Pricing Outlook, 2024-2024
- 6.4 Average Selling Price and Unit Economics
- 6.5 Pricing by Product and Market Segment
- 6.6 Geographic Pricing Differences
- 6.7 Key Input, Energy, Labor and Logistics Costs
- 6.8 Contract Pricing and Purchasing Models
- 6.9 Pricing Sensitivity and Competitive Positioning
- 6.10 Price, Margin and Profitability Implications
Chapter 7 Global Family Indoor Entertainment Centres Market Dynamics
- 7.1 Market Growth Drivers
- 7.1.1 Demand-Side Drivers
- 7.1.2 Technology and Innovation Drivers
- 7.1.3 Infrastructure and Investment Drivers
- 7.1.4 Regulatory and Policy Drivers
- 7.2 Market Restraints
- 7.2.1 Cost and Affordability Constraints
- 7.2.2 Technology and Adoption Barriers
- 7.2.3 Supply Chain and Operational Constraints
- 7.3 Market Challenges
- 7.3.1 Competitive Pressure and Margin Erosion
- 7.3.2 Skills, Infrastructure and Implementation Gaps
- 7.4 Emerging Market Opportunities
- 7.5 Market Dynamics Impact and Time-Horizon Assessment
Chapter 8 Global Family Indoor Entertainment Centres Value Chain Analysis
- 8.1 Industry Value Chain Overview
- 8.2 Upstream Suppliers and Critical Inputs
- 8.3 Technology and Component Providers
- 8.4 Manufacturing or Service Delivery
- 8.5 Distribution, Channel Partners and Integrators
- 8.6 Downstream Applications and End Users
- 8.7 Value Addition and Profit Pools
- 8.8 Vertical Integration and Outsourcing
- 8.9 Supplier Concentration and Risk
- 8.10 Supply Chain Localization and Resilience
Chapter 9 Global Family Indoor Entertainment Centres Market Regulations and Policies
- 9.1 Relevant Laws, Standards and Compliance Frameworks
- 9.2 Product, Service, Safety and Quality Requirements
- 9.3 Government Policies, Incentives and Subsidies
- 9.4 Imports, Exports and Trade Barriers
- 9.5 Public Procurement and Local Content Requirements
- 9.6 Environmental and Sustainability Compliance
- 9.7 Upcoming Policy Changes and Market Implications
Chapter 10 Global Family Indoor Entertainment Centres Market Hotspots and Opportunities
- 10.1 Market Opportunity Mapping and Growth Hotspots
- 10.2 High-Growth Applications and Customer Groups
- 10.3 Underserved Markets and White-Space Opportunities
- 10.4 Emerging Technology and Product Opportunities
- 10.5 New Capacity and Investment Hotspots
- 10.6 Market Entry and Expansion Opportunities
- 10.7 Distribution and Partnership Opportunities
- 10.8 Near-Term and Long-Term Commercial Potential
- 10.9 Opportunity Attractiveness and Execution Risks
Chapter 11 Global Family Indoor Entertainment Centres Market Outlook, 2024-2024
- 11.1 Market Size and Analysis
- 11.1.1 Revenue (Market Measurement: 2024: USD 30,285 million → 2024: USD 30,285 million)
- 11.1.2 Market Volume and Quantity Sold
- 11.1.3 Historical Market Size
- 11.1.4 Base-Year Market Size, 2024
- 11.2 Market Forecast, 2024-2024
- 11.2.1 Revenue Forecast to 2024
- 11.2.2 Volume Forecast to 2024
- 11.2.3 CAGR and Year-on-Year Growth
- 11.2.4 Incremental Revenue Opportunity
- 11.3 Forecast Assumptions and Scenario Analysis
- 11.3.1 Base-Case Forecast
- 11.3.2 Optimistic and Conservative Scenarios
- 11.3.3 Technology, Pricing and Policy Sensitivities
- 11.4 Market Attractiveness and Growth Outlook
Chapter 12 Global Family Indoor Entertainment Centres Market Segmentation and Outlook
- 12.1 Segmentation Summary and Market Shares, 2024
- 12.2 Largest and Fastest-Growing Segments
- 12.3 By FEC Type - Market Size and Forecast, 2024-2024
- 12.3.1 Segment Definition and Scope
- 12.3.2 Historical Market Size
- 12.3.3 Revenue Forecast, 2024-2024
- 12.3.4 Volume Forecast, 2024-2024
- 12.3.5 Base-Year Market Share, 2024
- 12.3.6 Segment CAGR and Growth Drivers
- 12.3.7 Subsegment Market Size and Forecast
- 12.3.7.1 Arcade Studios
- 12.3.7.2 VR Gaming Zones
- 12.3.7.3 Sports Arcades
- 12.3.7.4 Physical Play Activities
- 12.3.7.5 Skill/Competition Games
- 12.3.7.6 Others
- 12.3.8 Subsegment Pricing and Adoption Trends
- 12.3.9 Leading Suppliers and Competition
- 12.3.10 Regional Demand and Opportunities
- 12.4 By Facility Size - Market Size and Forecast, 2024-2024
- 12.4.1 Segment Definition and Scope
- 12.4.2 Historical Market Size
- 12.4.3 Revenue Forecast, 2024-2024
- 12.4.4 Volume Forecast, 2024-2024
- 12.4.5 Base-Year Market Share, 2024
- 12.4.6 Segment CAGR and Growth Drivers
- 12.4.7 Subsegment Market Size and Forecast
- 12.4.7.1 <5,000 Sq. ft.
- 12.4.7.2 5,001 to 10,000 Sq. ft.
- 12.4.7.3 10,001 to 20,000 Sq. ft.
- 12.4.7.4 20,001 to 40,000 Sq. ft.
- 12.4.7.5 >40,000 Sq. ft
- 12.4.8 Subsegment Pricing and Adoption Trends
- 12.4.9 Leading Suppliers and Competition
- 12.4.10 Regional Demand and Opportunities
- 12.5 By Revenue Source - Market Size and Forecast, 2024-2024
- 12.5.1 Segment Definition and Scope
- 12.5.2 Historical Market Size
- 12.5.3 Revenue Forecast, 2024-2024
- 12.5.4 Volume Forecast, 2024-2024
- 12.5.5 Base-Year Market Share, 2024
- 12.5.6 Segment CAGR and Growth Drivers
- 12.5.7 Subsegment Market Size and Forecast
- 12.5.7.1 Entry Fees & Ticket Sales
- 12.5.7.2 Food & Beverages
- 12.5.7.3 Merchandising
- 12.5.7.4 Advertising
- 12.5.7.5 Others
- 12.5.8 Subsegment Pricing and Adoption Trends
- 12.5.9 Leading Suppliers and Competition
- 12.5.10 Regional Demand and Opportunities
- 12.6 By Visitors Demographics - Market Size and Forecast, 2024-2024
- 12.6.1 Segment Definition and Scope
- 12.6.2 Historical Market Size
- 12.6.3 Revenue Forecast, 2024-2024
- 12.6.4 Volume Forecast, 2024-2024
- 12.6.5 Base-Year Market Share, 2024
- 12.6.6 Segment CAGR and Growth Drivers
- 12.6.7 Subsegment Market Size and Forecast
- 12.6.7.1 Families with Children (0–9)
- 12.6.7.2 Families with Children (9–12)
- 12.6.7.3 Teenagers (12–18)
- 12.6.7.4 Young Adults (18–24)
- 12.6.7.5 Adults (24+)
- 12.6.8 Subsegment Pricing and Adoption Trends
- 12.6.9 Leading Suppliers and Competition
- 12.6.10 Regional Demand and Opportunities
- 12.7 Segment Growth Comparison
- 12.8 Segment Attractiveness and Priority Matrix
Chapter 13 Global Family Indoor Entertainment Centres Geographic Market Outlook, 2024-2024
- 13.1 Regional Market Size and Share, 2024
- 13.2 Regional Market Forecast, 2024-2024
- 13.3 Regional Pricing, Production and Demand Differences
- 13.4 North America
- 13.4.1 United States
- 13.4.2 Canada
- 13.4.3 Mexico
- 13.5 Europe
- 13.5.1 Germany
- 13.5.2 France
- 13.5.3 Italy
- 13.5.4 United Kingdom
- 13.5.5 Spain
- 13.5.6 Poland
- 13.5.7 Russia
- 13.5.8 Netherlands
- 13.5.9 Belgium
- 13.5.10 Sweden
- 13.5.11 Denmark
- 13.5.12 Norway
- 13.5.13 Rest of Europe
- 13.6 Asia Pacific
- 13.6.1 China
- 13.6.2 India
- 13.6.3 Japan
- 13.6.4 South Korea
- 13.6.5 Thailand
- 13.6.6 Indonesia
- 13.6.7 Vietnam
- 13.6.8 Malaysia
- 13.6.9 Australia
- 13.6.10 Rest of Asia Pacific
- 13.7 Latin America
- 13.7.1 Brazil
- 13.7.2 Argentina
- 13.7.3 Colombia
- 13.7.4 Chile
- 13.7.5 Rest of Latin America
- 13.8 Middle East
- 13.8.1 Saudi Arabia
- 13.8.2 United Arab Emirates
- 13.8.3 Turkey
- 13.8.4 Israel
- 13.8.5 Iran
- 13.8.6 Rest of the Middle East
- 13.9 Africa
- 13.9.1 South Africa
- 13.9.2 Egypt
- 13.9.3 Nigeria
- 13.9.4 Morocco
- 13.9.5 Rest of Africa
- 13.10 Regional Investment, Policy and Supply Chain Differences
- 13.11 Regional Competitive Landscape
- 13.12 Geographic Growth Hotspots
Chapter 14 Global Family Indoor Entertainment Centres Technology, Innovation and Sustainability Outlook
- 14.1 Technology Landscape and Maturity
- 14.2 Product, Process and Service Innovation
- 14.3 AI, Automation and Digital Tools in the Industry
- 14.4 Technology Adoption and Performance Benchmarking
- 14.5 Innovation Pipeline and R&D Investment
- 14.6 Patent and Intellectual Property Trends
- 14.7 Energy Efficiency and Resource Management
- 14.8 Sustainability, Recycling and Circularity
- 14.9 Technology Roadmap, 2024-2024
- 14.10 Risks of Obsolescence and Technology Substitution
Chapter 15 Global Family Indoor Entertainment Centres Market Key Strategic Imperatives
- 15.1 Growth and Market Entry Priorities
- 15.2 High-Return Products and Segments
- 15.3 Pricing, Profitability and Cost Optimization
- 15.4 Technology Investment and Product Differentiation
- 15.5 Supply Chain Localization and Resilience
- 15.6 Distribution and Customer Acquisition
- 15.7 Partnership, Acquisition and Capacity Strategy
- 15.8 Regional Expansion Priorities
- 15.9 Short-, Medium- and Long-Term Actions
Chapter 16 Competition Outlook
- 16.1 Industry Competition Characteristics
- 16.2 Market Structure and Concentration
- 16.3 Market Share and Competitive Positioning, 2024
- 16.4 Company-Wise Revenue and Product Benchmarking
- 16.5 Production and Service Capacity Benchmarking
- 16.6 Technology, Pricing and Differentiation
- 16.7 Regional Footprint and Distribution Strength
- 16.8 Mergers, Acquisitions and Strategic Alliances
- 16.9 New Entrants and Competitive Threats
- 16.10 Porter's Five Forces and Industry Attractiveness
- 16.11 Competitive Outlook, 2024-2024
Chapter 17 Company Profiles
- 17.1 Company Coverage and Selection Criteria
- 17.2 Dave & Buster’s
- 17.2.1 Business Description
- 17.2.2 Company Ownership and Geographic Presence
- 17.2.3 Product and Service Portfolio
- 17.2.4 Manufacturing and Operating Footprint
- 17.2.5 Production Capacity and Expansion Plans
- 17.2.6 Financial Performance and Investment
- 17.2.7 Market Share and Competitive Position
- 17.2.8 Technology and Innovation Capabilities
- 17.2.9 Strategic Alliances or Partnerships
- 17.2.10 Recent Developments
- 17.2.11 Growth Strategy and Outlook
- 17.3 CEC Entertainment (Chuck E. Cheese)
- 17.4 Cinergy Entertainment
- 17.5 KidZania
- 17.6 Scene75 Entertainment
- 17.7 Main Event Entertainment
- 17.8 Legoland Discovery Center
- 17.9 Smaaash Entertainment
- 17.10 Lucky Strike Entertainment
- 17.11 FunCity
- 17.12 Other Relevant Market Participants
Note: Every listed company is profiled on the structure shown under the first company. The company list is preliminary and may change based on research findings, market developments, data availability and client requirements.
Chapter 18 Disclaimer
- 18.1 Research and Forecast Disclaimer
- 18.2 Data Source and Estimation Limitations
Note: The depth of individual sections depends on data availability for this market. Volume, capacity, trade and other unit-based metrics are included where applicable.

