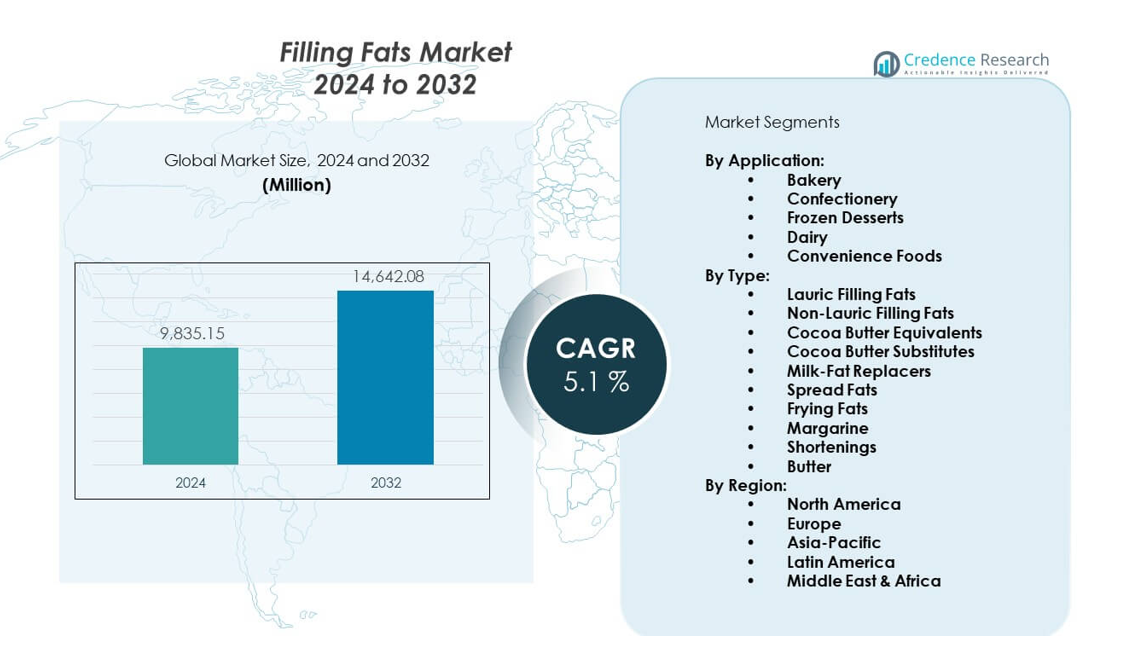
Home » Food & Beverage » Filling Fats Market

Filling Fats Market By Type (Lauric, Non-Lauric) By End-Use (Confectionery, Toffee Filling, Confectionery Spreads, Chocolate Compounding, Confectionery bars, Pralines) – Growth, Future Prospects & Competitive Analysis, 2016 – 2030

Price: $4999

Published: | Report ID: 18292 | Report Format : PDF

Key Highlights of the Report

The global filling fats market is categorized by type, end-use, fat content, and region. Lauric filling fats are the most popular, while non-lauric fats are the primary user segment. The confectionery sector is the most commonly used end-user. Low fats are a major type of filling fats, with Asia Pacific leading the market growth.

The market for filling fats is expanding due to factors like increasing demand for alternatives and ingredients with added value, rising consumption of processed foods and confectionery, massively increased production of oils and fats, and growing adoption of bakery and confectionery products. However, high pricing for oil crops and raw materials and lacking cutting-edge farming methods would restrain industry expansion.

Nonetheless, the global filling fats market offers significant growth opportunities, including huge growth potential in the Asia Pacific region due to the region’s growing urbanization and modernization, increase in disposable income, and rising number of applications among various end-use industries.

Market Overview

The global filling fats market has grown constantly in the last few years and is projected to expand at a CAGR of 4.20% between 2023 and 2030. The market was valued at USD 12.8 billion in 2022 and is assumed to achieve USD 17.07 billion in 2030.

What Are The Leading Drivers Of The Global Filling Fats Market?

The global filling fats market is driven by several factors, including rising demand for bakery and confectionery goods and the rising fat consumption and the food processing industry.

What Are The Leading Challenges Faced By The Global Filling Fats Market?

The global filling fats market also faces several challenges, including the rising consumer awareness of leading a healthy lifestyle and increasing health problems like obesity, overweight, and high cholesterol.

What Are The Possible Growth Opportunities In The Global Filling Fats Market?

The global filling fats market offers significant growth opportunities, including increased development potential due to the increase in the demand for natural cosmetic goods and the trend of microencapsulation.

Design Element 2

Access crucial information at unmatched prices!

Request your free sample report today & start making informed decisions powered by Credence Research!

Download Free Sample
CTA Design Element 3

Executive Summary

Overview of the Global Filling Fats Market

The increased awareness of superior trans-fat alternatives, consumer interest in a more nutrient-dense and tailored diet, and supportive food and energy frameworks all contributed to this sector’s growth. The market for filling fats is expanding due to the growing investments in the research and development of specialty fats to reduce fat content and optimize filling fats to produce gratifying effects in the finished product.

Market Definition

Filling fats contribute to the delightful eating experience in confectionery-based products. Because a small change in the quality of the filling fats could result in an undesirable flavor and texture of the confectionary product, filling fats are particularly created in accordance with the texture, taste, and form standards of the finished confection product. Filling fats are under the specialty fats group and have been utilized by confectionery manufacturers for a long time.

Market Insights

  • The global demand for filling fats was prized at USD 12.8 Billion in 2022. It is also predicted to reach USD 17.07 Billion in 2030, expanding at a CAGR of 4.20% between 2023 and 2030.
  • Lauric is the leading segment by type and held over 58.7% share in terms of value in 2022, while the non-lauric segment is likely to exhibit the fastest CAGR during the forecast period.
  • The confectionery segment governs the demand for filling fats globally, holding a massive share of over 35.9% in 2022, and is expected to grow at a rapid CAGR.
  • The high-fat segment is expected to post the highest CAGR during the forecasted period, while the low-fat segment is leading the market share with over 60.5% share in 2022.
  • Asia Pacific is boosting the growth of the filling fats industry with over one-third share in 2022, while North America and Europe collectively account for just under 50% share in 2022. Europe held over 25.8% share in 2022.
  • Filling fats and oils are in high demand within the food and beverage industries due to their unique qualities, such as high stability, texture enhancement, and flavor enhancement. This demand is the primary driver of market growth.  However, market expansion is constrained by challenges such as varying raw material prices, stringent regulations, and fierce competition.
  • Rising urbanization and shifting dietary choices in developing nations such as India and China are pushing the demand for filling fats. Growing middle-class populations, rising disposable incomes, and improved consumer awareness of the health advantages of income fats are driving a trend toward better food options.

Segmentation by Type

  • Lauric is the leading segment by type and held over 58.7% share in terms of value in 2022.
  • The non-lauric segment will likely exhibit the fastest CAGR during the forecast period.
  • Lauric fatty acids are used in various industries, including the food and cosmetics sectors.  Due to its moisturizing properties, it has been commonly used to prepare formulations containing fat.

Segmentation by End-Use

  • The confectionery segment governs the demand for filling fats in the world, holding a massive share of over 35.9% in 2022, and is also expected to grow at a rapid CAGR.
  • The bakery & snacks segment contributes the rest to the demand for filling fats.
  • Filling fats and oils are widely used to manufacture chocolates, candies and other confectionery goods to enhance their texture, flavor and appearance.

Segmentation by Fat Content

  • The high-fat segment is expected to post the highest CAGR during the forecast period.
  • The low-fat segment is leading the market share with over 60.5% share in 2022.
  • Many consumers are limiting their consumption of foods that are high in fat and instead choose low-fat food products with fewer artificial components since they are nutritious and nutritionally dense with lower fat and calories.

Segmentation by Region

  • Asia Pacific will account for nearly one-third of the global market for the filling fats industry in 2022.
  • North America and Europe collectively account for just under 50% share in 2022, with Europe holding over 25.8% share in the same year.
  • The rest of the World, including Africa, Latin America, and Middle East, contributes the remainder to the demand for filling fats.

The food and beverage sector places a significant demand on filling fats and oils because of their unique qualities, which include high stability, texture and flavor enhancement, and high stability. However, obstacles, including fluctuating raw material prices, strict regulations, and intense rivalry, limit industry expansion.

The top market players’ quick research and development has enabled the market to expand significantly and concentrate on potential customers to maintain long-term product sales. This research and development aim to comprehend and offer long-term answers to the rising consumer desire for convenient and healthy food options, boosting the market for filling fats in the USA.

It is predicted that factors such as increased disposable income, brisk middle-class population expansion, high purchasing power, and rising consumer demand for convenience foods will contribute to the growth in China. A significant growth rate in filling fats is projected due to rising demand from the chocolate and confectionery industries. Another significant driver of growth is rising consumer expenditure on prepared foods.

The increasing demand for filling fats can be attributed to the growing demand for chocolate and packaged food items.

While the filling fats market is growing, it faces challenges due to its growing negative effects on human health.

Growing Demand for Chocolate & Cocoa Products

The industry is expanding due to the popularity and demand for dark and organic chocolates. However, in recent years, the world’s total cocoa bean production has been slightly hindered by the unpredictable weather that top cocoa-producing nations are experiencing. Filling fats provide a different approach to the problem of increasing demand for cocoa as an ingredient and declining production rates.  Filling fats, including cocoa butter substitutes and equivalents, have properties similar to those of cocoa. Filling fats is additionally less expensive than cocoa butter.

According to its makeup, dark chocolate consumption in developing nations is predicted to expand, affecting the sector’s growth and seasonal sales. Due to its many health advantages, chocolate is the most popular sweetener in the world. As a result, several businesses are now creating sugar-free and organic chocolate products to appeal to health-conscious urban consumers. Additionally, eating chocolate has advantageous physiological impacts. For instance, a filling fat used in the production of chocolate, such as cocoa butter, can set and firm on a cake’s surface while providing a supple mouthfeel.

Rising Demand for Packaged Foods

Packaged goods demand is rising because customers find them the most convenient to buy and have confidence in the brands attached to the packaging. These goods are unaltered from the outside and simple to use. Urban packaged food habits are replacing traditional food consumption. Consumers are being informed about new product introductions and their USPs by packaged foods. The global market for filling fats is expanding due to people’s increased knowledge of the importance of adequate nutrition and their rising propensity for packaged foods.

The demand for packaged food products will be driven by an exponential rise in working individuals and their hectic schedules during the anticipated time period. Working people prefer food products that can be produced quickly and with few ingredients due to a lack of time. Due to this issue, demand has increased for foods that are ready to eat, including frozen foods, bakery goods, snacks, chocolates, and other goods. In addition, due to increased urbanization and a high urbanization rate, the market for filling fats has grown favorably due to rising packaged food demand. In addition, customer preference for healthier food and beverage options will hasten industry expansion.

Filling Fats Market.png

Negative Effect on Human Health

Consuming too many hydrogenated fats and oils raises the blood’s LDL (low-density lipoprotein) level while lowering HDL (high-density lipoprotein) levels, which raises the risk of thrombosis. This is because, during food preparation, the PUFA in vegetable oils naturally oxidizes, producing inflammatory peroxides and hydroperoxides. Trans fatty acid consumption is strongly associated with an elevated health risk of cancer and cardiovascular disease. Thus, the market for filling fats is being impacted by the growing knowledge of the harmful health effects of trans fatty acids. Thus, the market for confectionery fats, and consequently the markets for filling fats, are being impacted by knowledge of the harmful health effects of trans-fatty acid inclusion.

Rise in Demand for Natural Cosmetic Products

The beauty and personal care sector is trending towards natural goods over synthetic chemicals. Several factors, including a growing millennials population, particularly in the Asia Pacific region, rising per capita income, a surge in online presence and internet use, and a growing awareness of sustainable and environmentally-friendly products have all contributed to the growth of the market for organic cosmetics and personal care products. This has caused a recent rise in the demand for specialized chemicals used in the personal care and cosmetics industries. Oils like palm and olive oil are examples of these substances.

Growing Popularity of Low Fats Product

As people become increasingly conscious of the health benefits of fat-free food, global demand for low-fat products is expected to rise.  People select nutritious diets over other cuisines to maintain a healthy lifestyle as they become more health conscious. A rise in obese people who are adopting healthy lifestyles is having a beneficial effect on the global market for low-fat foods. Additionally, people’s lifestyles are frequently changing, and a busy schedule forces them to choose nutritious foods that are low in calories and fat. The market is encouraged to increase demand for products that promote physical health with nutritional values by consuming low-calorie and low-fat products because consumers are generally aware of the risk to their health associated with consuming high-fat and high-calorie foods.

Competitive Landscape

Key Players

The global filling fats market is largely competitive, with the presence of several prominent players. Some of the notable market players in the market and their market share are as follows:

  • Bunge
  • Fuji Oil Europe NV
  • Manorama Industries Private Limited
  • Mewah International Group
  • Loders Croklaan B.V.
  • Wilmar International Ltd.
  • Sime Darby Plantation Berhad
  • Felda Iffo LLC
  • Rieckermann GmbH AAK AB
  • Eksper Gida

These companies focus on product innovation, expanding their distribution channels, and mergers and acquisitions to stay ahead in the market.

The major players in the global filling fats market constantly strive to stay ahead by introducing new products and innovations.

In October 2022, Puratos India introduced two types of colored and flavored compound and compound filling: hard compound chocolate, Carat Cover Classic, and fat-based filling, Carat Supercrem. Puratos Coloured & Flavoured Compound and Compound Filling add the best flavor and color to final products without the hassle of acquiring ingredients. These one-of-a-kind components are available in various colors and flavors based on consumer feedback and expert panels.

In May 2021, Cargill purchased Leman Decoration Group, a leading provider of cake decorations to the bakery industry, including the artisanal, small industrial, home-baking segments, and food service. The acquisition considerably broadens Cargill’s decorating options, allowing the company’s cocoa and chocolate businesses to better serve gourmet consumers in Europe and around the world.

Shape Your Report to Specific Countries or Regions & Enjoy 30% Off!

Summary of Key Findings

  • The rising need for filling fats can be ascribed to the rising desire for chocolate and packaged foods and the benefits of filling fats.
  • Market segmented by type, end-use, fat content, and region.
  • Lauric filling fats are the most popular,
  • The confectionery sector is the primary user segment.
  • Low fats products are most commonly used.
  • Asia Pacific is leading market growth; the market is highly competitive with key players including Sime Darby Plantation Berhad, Loders Croklaan B.V., Manorama Industries Private Limited, and Fuji Oil Europe NV.

Future Outlook

  • Positive outlook for the global filling fats market with significant growth potential in the Asia Pacific region
  • Increased consumer awareness of superior trans-fat alternatives, consumer enthusiasm for a more nutrient-dense and personalized diet, and supportive food and energy frameworks have all contributed to the expansion of this market.
  • Challenges from the rising negative effect on human health
  • Key players to focus on product innovation, expanding market reach and maintaining competitive pricing to stay ahead in the market.

Segmentation

  • By Type
    • Lauric
    • Non-Lauric
  • By End-Use
    • Confectionery
    • Toffee Filling
    • Confectionery Spreads
    • Chocolate Compounding
    • Confectionery bars
    • Pralines
    • Others
    • Bakery & Snacks
    • Frozen desserts
    • Spreads & Dressings
  • By Fat Content
    • High Fat
    • Low Fat
  • By Region
  • North America
    • US
    • Canada
    • Mexico
  • Europe
    • Germany
    • France
    • UK.
    • Italy
    • Spain
    • Rest of Europe
  • Asia Pacific
    • China
    • Japan
    • India
    • South Korea
    • South-east Asia
    • Rest of Asia Pacific
  • Latin America
    • Brazil
    • Argentina
    • Rest of Latin America
  • Middle East & Africa
    • GCC Countries
    • South Africa
    • Rest of Middle East and Africa

1. Preface
1.1. Report Description
1.1.1. Purpose of the Report
1.1.2. Target Audience
1.1.3. USP and Key Offerings
1.2. Research Scope
1.3. Research Methodology
1.3.1. Phase I – Secondary Research
1.3.2. Phase II – Data Modelling
1.3.2.1. Company Share Analysis Model
1.3.2.2. Revenue Based Modelling
1.3.3. Phase III – Primary Research
1.3.4. Research Limitations
1.3.5. Assumptions
1.4. Market Introduction
1.5. Market Research Scope

2. Executive Summary
2.1. Market Snapshot: Global Filling Fats Market
2.2. Global Filling Fats Market, By Type
2.3. Global Filling Fats Market, By End Use
2.4. Global Filling Fats Market, By Fat Content
2.5. Global Filling Fats Market, By Region

3. Market Dynamics & Factors Analysis
3.1. Introduction
3.1.1. Global Filling Fats Market Value, 2017-2030, (US$ Mn)
3.1.2. Global Filling Fats Market Volume, 2017-2030, (Kilo Tons)
3.1.3. Y-o-Y Growth Trend Analysis
3.2. Market Dynamics
3.2.1. Market Drivers
3.2.1.1. Driver 1
3.2.1.2. Driver 2
3.2.1.3. Driver 3
3.2.2. Market Restraints
3.2.2.1. Restraint 1
3.2.2.2. Restraint 2
3.2.3. Market Opportunities
3.2.3.1. Opportunity 1
3.2.3.2. Opportunity 2
3.2.4. Major Industry Challenges
3.2.4.1. Challenge 1
3.2.4.2. Challenge 2
3.3. Growth and Development Patterns
3.4. Investment Feasibility Analysis
3.5. Market Opportunity Analysis
3.5.1. Type
3.5.2. End Use
3.5.3. Fat Content
3.5.4. Geography

4. Premium Insights
4.1. STAR (Situation, Task, Action, Results) Analysis
4.2. Porter’s Five Forces Analysis
4.2.1. Threat of New Entrants
4.2.2. Bargaining Power of Buyers/Consumers
4.2.3. Bargaining Power of Suppliers
4.2.4. Threat of Substitute Types
4.2.5. Intensity of Competitive Rivalry
4.3. Key Market Trends
4.3.1. Demand Side Trends
4.3.2. Supply Side Trends
4.4. Value Chain Analysis
4.5. Technology Analysis
4.6. Analysis and Recommendations
4.7. Marketing Strategy Analysis
4.7.1. Toffee Filling Marketing
4.7.2. Indirect Marketing
4.7.3. Marketing Channel Development Trend

5. Import Export Analysis
5.1. Import Analysis by Region
5.1.1. Global Filling Fats Market Import Volume, By Region, 2017-2022 (Kilo Tons)
5.2. Export Analysis by Region
5.2.1. Global Filling Fats Market Export Volume, By Region, 2017-2022 (Kilo Tons)

6. Demand-Supply Analysis
6.1. Demand Analysis by Region
6.1.1. Global Filling Fats Market Demand Volume, By Region, 2017-2022 (Kilo Tons)
6.2. Supply Analysis by Region
6.2.1. Global Filling Fats Market Supply Volume, By Region, 2017-2022 (Kilo Tons)

7. Pricing Analysis
7.1. Average Price of Filling Fats by Region, 2017-2022 (USD/Unit)
7.2. Average Price of Filling Fats by Region, 2023-2030 (USD/Unit)

8. Market Positioning of Key Players, 2022
8.1. Company market share of key players, 2022
8.2. Competitive Benchmarking
8.3. Market Positioning of Key Vendors
8.4. Geographical Presence Analysis
8.5. Major Strategies Adopted by Key Players
8.5.1. Key Strategies Analysis
8.5.2. Mergers and Acquisitions
8.5.3. Partnerships
8.5.4. Product Launch
8.5.5. Geographical Expansion
8.5.6. Others

9. Economic Impact Analysis
9.1. Recession Impact
9.1.1. North America
9.1.2. Europe
9.1.3. Asia Pacific
9.1.4. Latin America
9.1.5. Middle East and Africa
9.2. Ukraine-Russia War Impact
9.2.1. North America
9.2.2. Europe
9.2.3. Asia Pacific
9.2.4. Latin America
9.2.5. Middle East and Africa
9.3. COVID-19 Impact Analysis
9.3.1. North America
9.3.2. Europe
9.3.3. Asia Pacific
9.3.4. Latin America
9.3.5. Middle East and Africa

10. Global Filling Fats Market, By Type
10.1. Global Filling Fats Market Overview, by Type
10.1.1. Global Filling Fats Market Revenue Share, By Type, 2022 Vs 2030 (in %)
10.1.2. Global Filling Fats Market Volume Share, By Type, 2022 Vs 2030 (in %)
10.2. Lauric
10.2.1. Global Filling Fats Market, By Region, 2017-2030 (US$ Mn)
10.2.2. Global Filling Fats Market, By Region, 2017-2030 (Kilo Tons)
10.3. Non-lauric
10.3.1. Global Filling Fats Market, By Region, 2017-2030 (US$ Mn)
10.3.2. Global Filling Fats Market, By Region, 2017-2030 (Kilo Tons)

11. Global Filling Fats Market, By End Use
11.1. Global Filling Fats Market Overview, by End Use
11.1.1. Global Filling Fats Market, By End Use, 2022 vs 2030 (in %)
11.2. Confectionery
11.2.1. Global Filling Fats Market, By Region, 2017-2030 (US$ Mn)
11.2.2. Global Filling Fats Market, By Region, 2017-2030 (Kilo Tons)
11.3. Toffee Filling
11.3.1. Global Filling Fats Market, By Region, 2017-2030 (US$ Mn)
11.3.2. Global Filling Fats Market, By Region, 2017-2030 (Kilo Tons)
11.4. Confectionery Spreads
11.4.1. Global Filling Fats Market, By Region, 2017-2030 (US$ Mn)
11.4.2. Global Filling Fats Market, By Region, 2017-2030 (Kilo Tons)
11.5. Chocalate Compounding
11.5.1. Global Filling Fats Market, By Region, 2017-2030 (US$ Mn)
11.5.2. Global Filling Fats Market, By Region, 2017-2030 (Kilo Tons)
11.6. Confectionery bars
11.6.1. Global Filling Fats Market, By Region, 2017-2030 (US$ Mn)
11.6.2. Global Filling Fats Market, By Region, 2017-2030 (Kilo Tons)
11.7. Pralines
11.7.1. Global Filling Fats Market, By Region, 2017-2030 (US$ Mn)
11.7.2. Global Filling Fats Market, By Region, 2017-2030 (Kilo Tons)
11.8. Bakery & Snacks
11.8.1. Global Filling Fats Market, By Region, 2017-2030 (US$ Mn)
11.8.2. Global Filling Fats Market, By Region, 2017-2030 (Kilo Tons)
11.9. Frozen desserts
11.9.1. Global Filling Fats Market, By Region, 2017-2030 (US$ Mn)
11.9.2. Global Filling Fats Market, By Region, 2017-2030 (Kilo Tons)
11.10. Spreads & Dressings
11.10.1. Global Filling Fats Market, By Region, 2017-2030 (US$ Mn)
11.10.2. Global Filling Fats Market, By Region, 2017-2030 (Kilo Tons)
11.11. Others
11.11.1. Global Filling Fats Market, By Region, 2017-2030 (US$ Mn)
11.11.2. Global Filling Fats Market, By Region, 2017-2030 (Kilo Tons)

12. Global Filling Fats Market, by Fat Content, 2017-2030 (US$ Mn)
12.1. Global Filling Fats Market Overview, by Fat Content
12.1.1. Global Filling Fats Market, By Fat Content, 2022 vs 2030 (in%)
12.2. High Fat
12.2.1. Global Filling Fats Market, By Region, 2017-2030 (US$ Mn)
12.2.2. Global Filling Fats Market, By Region, 2017-2030 (Kilo Tons)
12.3. Low Fat
12.3.1. Global Filling Fats Market, By Region, 2017-2030 (US$ Mn)
12.3.2. Global Filling Fats Market, By Region, 2017-2030 (Kilo Tons)

13. Global Filling Fats Market, By Region
13.1. Global Filling Fats Market Overview, by Region
13.1.1. Global Filling Fats Market Revenue, By Region, 2022 vs 2030 (in%)
13.1.2. Global Filling Fats Market Volume, By Region, 2022 vs 2030 (in%)
13.2. Type
13.2.1. Global Filling Fats Market, By Type, 2017-2030 (US$ Mn)
13.2.2. Global Filling Fats Market, By Type, 2017-2030 (Kilo Tons)
13.3. End Use
13.3.1. Global Filling Fats Market, By End Use, 2017-2030 (US$ Mn)
13.3.2. Global Filling Fats Market, By End Use, 2017-2030 (Kilo Tons)
13.4. Fat Content
13.4.1. Global Filling Fats Market, By Fat Content, 2017-2030 (US$ Mn)
13.4.2. Global Filling Fats Market, By Fat Content, 2017-2030 (Kilo Tons)

14. North America Filling Fats Market Analysis
14.1. North America Filling Fats Market, by Type, 2017-2030(US$ Mn)
14.1.1. Overview
14.1.2. SRC Analysis
14.2. North America Filling Fats Market, by Type, 2017-2030(Kilo Tons)
14.2.1. Overview
14.2.2. SRC Analysis
14.3. North America Filling Fats Market, by End Use, 2017-2030(US$ Mn)
14.3.1. Overview
14.3.2. SRC Analysis
14.4. North America Filling Fats Market, by End Use, 2017-2030(Kilo Tons)
14.4.1. Overview
14.4.2. SRC Analysis
14.5. North America Filling Fats Market, by Fat Content, 2017-2030(US$ Mn)
14.5.1. Overview
14.5.2. SRC Analysis
14.6. North America Filling Fats Market, by Fat Content, 2017-2030 (Kilo Tons)
14.6.1. Overview
14.6.2. SRC Analysis
14.7. North America Filling Fats Market, by Country, 2017-2030 (US$ Mn)
14.7.1. North America Filling Fats Market Revenue, by Country, 2022 Vs 2030 (in%)
14.7.2. North America Filling Fats Market Volume, by Country, 2022 Vs 2030 (in%)
14.7.3. U.S.
14.7.3.1. U.S. Filling Fats Market Estimates and Forecast, 2017-2030 (US$ Mn)
14.7.3.2. U.S. Filling Fats Market Estimates and Forecast, 2017-2030 (Kilo Tons)
14.7.3.3. U.S. Filling Fats, By Type, 2017-2030 (US$ Mn)
14.7.3.4. U.S. Filling Fats, By Type, 2017-2030 (Kilo Tons)
14.7.3.5. U.S. Filling Fats, By End Use, 2017-2030 (US$ Mn)
14.7.3.6. U.S. Filling Fats, By End Use, 2017-2030 (Kilo Tons)
14.7.3.7. U.S. Filling Fats, By Fat Content, 2017-2030 (US$ Mn)
14.7.3.8. U.S. Filling Fats, By Fat Content, 2017-2030 (Kilo Tons)
14.7.4. Canada
14.7.4.1. Canada Filling Fats Market Estimates and Forecast, 2017-2030 (US$ Mn)
14.7.4.2. Canada Filling Fats Market Estimates and Forecast, 2017-2030 (Kilo Tons)
14.7.4.3. Canada Filling Fats, By Type, 2017-2030 (US$ Mn)
14.7.4.4. Canada Filling Fats, By Type, 2017-2030 (Kilo Tons)
14.7.4.5. Canada Filling Fats, By End Use, 2017-2030 (US$ Mn)
14.7.4.6. Canada Filling Fats, By End Use, 2017-2030 (Kilo Tons)
14.7.4.7. Canada Filling Fats, By Fat Content, 2017-2030 (US$ Mn)
14.7.4.8. Canada Filling Fats, By Fat Content, 2017-2030 (Kilo Tons)
14.7.5. Mexico
14.7.5.1. Mexico Filling Fats Market Estimates and Forecast, 2017-2030 (US$ Mn)
14.7.5.2. Mexico Filling Fats Market Estimates and Forecast, 2017-2030 (Kilo Tons)
14.7.5.3. Mexico Filling Fats, By Type, 2017-2030 (US$ Mn)
14.7.5.4. Mexico Filling Fats, By Type, 2017-2030 (Kilo Tons)
14.7.5.5. Mexico Filling Fats, By End Use, 2017-2030 (US$ Mn)
14.7.5.6. Mexico Filling Fats, By End Use, 2017-2030 (Kilo Tons)
14.7.5.7. Mexico Filling Fats, By Fat Content, 2017-2030 (US$ Mn)
14.7.5.8. Mexico Filling Fats, By Fat Content, 2017-2030 (Kilo Tons)

15. Europe Filling Fats Market Analysis
15.1. Europe Filling Fats Market, by Type, 2017-2030(US$ Mn)
15.1.1. Overview
15.1.2. SRC Analysis
15.2. Europe Filling Fats Market, by Type, 2017-2030(Kilo Tons)
15.2.1. Overview
15.2.2. SRC Analysis
15.3. Europe Filling Fats Market, by End Use, 2017-2030(US$ Mn)
15.3.1. Overview
15.3.2. SRC Analysis
15.4. Europe Filling Fats Market, by End Use, 2017-2030(Kilo Tons)
15.4.1. Overview
15.4.2. SRC Analysis
15.5. Europe Filling Fats Market, by Fat Content, 2017-2030(US$ Mn)
15.5.1. Overview
15.5.2. SRC Analysis
15.6. Europe Filling Fats Market, by Fat Content, 2017-2030(Kilo Tons)
15.6.1. Overview
15.6.2. SRC Analysis
15.7. Europe Filling Fats Market, by Country, 2017-2030 (US$ Mn)
15.7.1. Europe Filling Fats Market Revenue, by Country, 2022 Vs 2030 (in%)
15.7.2. Europe Filling Fats Market Volume, by Country, 2022 Vs 2030 (in%)
15.7.3. Germany
15.7.3.1. Germany Filling Fats Market Estimates and Forecast, 2017-2030 (US$ Mn)
15.7.3.2. Germany Filling Fats Market Estimates and Forecast, 2017-2030 (Kilo Tons)
15.7.3.3. Germany Filling Fats, By Type, 2017-2030 (US$ Mn)
15.7.3.4. Germany Filling Fats, By Type, 2017-2030 (Kilo Tons)
15.7.3.5. Germany Filling Fats, By End Use, 2017-2030 (US$ Mn)
15.7.3.6. Germany Filling Fats, By End Use, 2017-2030 (Kilo Tons)
15.7.3.7. Germany Filling Fats, By Fat Content, 2017-2030 (US$ Mn)
15.7.3.8. Germany Filling Fats, By Fat Content, 2017-2030 (Kilo Tons)
15.7.4. France
15.7.4.1. France Filling Fats Market Estimates and Forecast, 2017-2030 (US$ Mn)
15.7.4.2. France Filling Fats Market Estimates and Forecast, 2017-2030 (Kilo Tons)
15.7.4.3. France Filling Fats, By Type, 2017-2030 (US$ Mn)
15.7.4.4. France Filling Fats, By Type, 2017-2030 (Kilo Tons)
15.7.4.5. France Filling Fats, By End Use, 2017-2030 (US$ Mn)
15.7.4.6. France Filling Fats, By End Use, 2017-2030 (Kilo Tons)
15.7.4.7. France Filling Fats, By Fat Content, 2017-2030 (US$ Mn)
15.7.4.8. France Filling Fats, By Fat Content, 2017-2030 (Kilo Tons)
15.7.5. U.K.
15.7.5.1. U.K. Filling Fats Market Estimates and Forecast, 2017-2030 (US$ Mn)
15.7.5.2. U.K. Filling Fats Market Estimates and Forecast, 2017-2030 (Kilo Tons)
15.7.5.3. U.K. Filling Fats, By Type, 2017-2030 (US$ Mn)
15.7.5.4. U.K. Filling Fats, By Type, 2017-2030 (Kilo Tons)
15.7.5.5. U.K. Filling Fats, By End Use, 2017-2030 (US$ Mn)
15.7.5.6. U.K. Filling Fats, By End Use, 2017-2030 (Kilo Tons)
15.7.5.7. U.K. Filling Fats, By Fat Content, 2017-2030 (US$ Mn)
15.7.5.8. U.K. Filling Fats, By Fat Content, 2017-2030 (Kilo Tons)
15.7.6. Italy
15.7.6.1. Italy Filling Fats Market Estimates and Forecast, 2017-2030 (US$ Mn)
15.7.6.2. Italy Filling Fats Market Estimates and Forecast, 2017-2030 (Kilo Tons)
15.7.6.3. Italy Filling Fats, By Type, 2017-2030 (US$ Mn)
15.7.6.4. Italy Filling Fats, By Type, 2017-2030 (Kilo Tons)
15.7.6.5. Italy Filling Fats, By End Use, 2017-2030 (US$ Mn)
15.7.6.6. Italy Filling Fats, By End Use, 2017-2030 (Kilo Tons)
15.7.6.7. Italy Filling Fats, By Fat Content, 2017-2030 (US$ Mn)
15.7.6.8. Italy Filling Fats, By Fat Content, 2017-2030 (Kilo Tons)
15.7.7. Spain
15.7.7.1. Spain Filling Fats Market Estimates and Forecast, 2017-2030 (US$ Mn)
15.7.7.2. Spain Filling Fats Market Estimates and Forecast, 2017-2030 (Kilo Tons)
15.7.7.3. Spain Filling Fats, By Type, 2017-2030 (US$ Mn)
15.7.7.4. Spain Filling Fats, By Type, 2017-2030 (Kilo Tons)
15.7.7.5. Spain Filling Fats, By End Use, 2017-2030 (US$ Mn)
15.7.7.6. Spain Filling Fats, By End Use, 2017-2030 (Kilo Tons)
15.7.7.7. Spain Filling Fats, By Fat Content, 2017-2030 (US$ Mn)
15.7.7.8. Spain Filling Fats, By Fat Content, 2017-2030 (Kilo Tons)
15.7.8. Rest of Europe
15.7.8.1. Rest of Europe Filling Fats Market Estimates and Forecast, 2017-2030 (US$ Mn)
15.7.8.2. Rest of Europe Filling Fats Market Estimates and Forecast, 2017-2030 (Kilo Tons)
15.7.8.3. Rest of Europe Filling Fats, By Type, 2017-2030 (US$ Mn)
15.7.8.4. Rest of Europe Filling Fats, By Type, 2017-2030 (Kilo Tons)
15.7.8.5. Rest of Europe Filling Fats, By End Use, 2017-2030 (US$ Mn)
15.7.8.6. Rest of Europe Filling Fats, By End Use, 2017-2030 (Kilo Tons)
15.7.8.7. Rest of Europe Filling Fats, By Fat Content, 2017-2030 (US$ Mn)
15.7.8.8. Rest of Europe Filling Fats, By Fat Content, 2017-2030 (Kilo Tons)

16. Asia Pacific Filling Fats Market Analysis
16.1. Asia Pacific Filling Fats Market, by Type, 2017-2030(US$ Mn)
16.1.1. Overview
16.1.2. SRC Analysis
16.2. Asia Pacific Filling Fats Market, by Type, 2017-2030(Kilo Tons)
16.2.1. Overview
16.2.2. SRC Analysis
16.3. Asia Pacific Filling Fats Market, by End Use, 2017-2030(US$ Mn)
16.3.1. Overview
16.3.2. SRC Analysis
16.4. Asia Pacific Filling Fats Market, by End Use, 2017-2030(Kilo Tons)
16.4.1. Overview
16.4.2. SRC Analysis
16.5. Asia Pacific Filling Fats Market, by Fat Content, 2017-2030(US$ Mn)
16.5.1. Overview
16.5.2. SRC Analysis
16.6. Asia Pacific Filling Fats Market, by Fat Content, 2017-2030(Kilo Tons)
16.6.1. Overview
16.6.2. SRC Analysis
16.7. Asia Pacific Filling Fats Market, by Country, 2017-2030 (US$ Mn)
16.7.1. Asia Pacific Filling Fats Market Revenue, by Country, 2022 Vs 2030 (in%)
16.7.2. Asia Pacific Filling Fats Market Volume, by Country, 2022 Vs 2030 (in%)
16.7.3. China
16.7.3.1. China Filling Fats Market Estimates and Forecast, 2017-2030 (US$ Mn)
16.7.3.2. China Filling Fats Market Estimates and Forecast, 2017-2030 (Kilo Tons)
16.7.3.3. China Filling Fats, By Type, 2017-2030 (US$ Mn)
16.7.3.4. China Filling Fats, By Type, 2017-2030 (Kilo Tons)
16.7.3.5. China Filling Fats, By End Use, 2017-2030 (US$ Mn)
16.7.3.6. China Filling Fats, By End Use, 2017-2030 (Kilo Tons)
16.7.3.7. China Filling Fats, By Fat Content, 2017-2030 (US$ Mn)
16.7.3.8. China Filling Fats, By Fat Content, 2017-2030 (Kilo Tons)
16.7.4. Japan
16.7.4.1. Japan Filling Fats Market Estimates and Forecast, 2017-2030 (US$ Mn)
16.7.4.2. Japan Filling Fats Market Estimates and Forecast, 2017-2030 (Kilo Tons)
16.7.4.3. Japan Filling Fats, By Type, 2017-2030 (US$ Mn)
16.7.4.4. Japan Filling Fats, By Type, 2017-2030 (Kilo Tons)
16.7.4.5. Japan Filling Fats, By End Use, 2017-2030 (US$ Mn)
16.7.4.6. Japan Filling Fats, By End Use, 2017-2030 (Kilo Tons)
16.7.4.7. Japan Filling Fats, By Fat Content, 2017-2030 (US$ Mn)
16.7.4.8. Japan Filling Fats, By Fat Content, 2017-2030 (Kilo Tons)
16.7.5. India
16.7.5.1. India Filling Fats Market Estimates and Forecast, 2017-2030 (US$ Mn)
16.7.5.2. India Filling Fats Market Estimates and Forecast, 2017-2030 (Kilo Tons)
16.7.5.3. India Filling Fats, By Type, 2017-2030 (US$ Mn)
16.7.5.4. India Filling Fats, By Type, 2017-2030 (Kilo Tons)
16.7.5.5. India Filling Fats, By End Use, 2017-2030 (US$ Mn)
16.7.5.6. India Filling Fats, By End Use, 2017-2030 (Kilo Tons)
16.7.5.7. India Filling Fats, By Fat Content, 2017-2030 (US$ Mn)
16.7.5.8. India Filling Fats, By Fat Content, 2017-2030 (Kilo Tons)
16.7.6. South Korea
16.7.6.1. South Korea Filling Fats Market Estimates and Forecast, 2017-2030 (US$ Mn)
16.7.6.2. South Korea Filling Fats Market Estimates and Forecast, 2017-2030 (Kilo Tons)
16.7.6.3. South Korea Filling Fats, By Type, 2017-2030 (US$ Mn)
16.7.6.4. South Korea Filling Fats, By Type, 2017-2030 (Kilo Tons)
16.7.6.5. South Korea Filling Fats, By End Use, 2017-2030 (US$ Mn)
16.7.6.6. South Korea Filling Fats, By End Use, 2017-2030 (Kilo Tons)
16.7.6.7. South Korea Filling Fats, By Fat Content, 2017-2030 (US$ Mn)
16.7.6.8. South Korea Filling Fats, By Fat Content, 2017-2030 (Kilo Tons)
16.7.7. South-East Asia
16.7.7.1. South-East Asia Filling Fats Market Estimates and Forecast, 2017-2030 (US$ Mn)
16.7.7.2. South-East Asia Filling Fats Market Estimates and Forecast, 2017-2030 (Kilo Tons)
16.7.7.3. South-East Asia Filling Fats, By Type, 2017-2030 (US$ Mn)
16.7.7.4. South-East Asia Filling Fats, By Type, 2017-2030 (Kilo Tons)
16.7.7.5. South-East Asia Filling Fats, By End Use, 2017-2030 (US$ Mn)
16.7.7.6. South-East Asia Filling Fats, By End Use, 2017-2030 (Kilo Tons)
16.7.7.7. South-East Asia Filling Fats, By Fat Content, 2017-2030 (US$ Mn)
16.7.7.8. South-East Asia Filling Fats, By Fat Content, 2017-2030 (Kilo Tons)
16.7.8. Rest of Asia Pacific
16.7.8.1. Rest of Asia Pacific Filling Fats Market Estimates and Forecast, 2017-2030 (US$ Mn)
16.7.8.2. Rest of Asia Pacific Filling Fats Market Estimates and Forecast, 2017-2030 (Kilo Tons)
16.7.8.3. Rest of Asia Pacific Filling Fats, By Type, 2017-2030 (US$ Mn)
16.7.8.4. Rest of Asia Pacific Filling Fats, By Type, 2017-2030 (Kilo Tons)
16.7.8.5. Rest of Asia Pacific Filling Fats, By End Use, 2017-2030 (US$ Mn)
16.7.8.6. Rest of Asia Pacific Filling Fats, By End Use, 2017-2030 (Kilo Tons)
16.7.8.7. Rest of Asia Pacific Filling Fats, By Fat Content, 2017-2030 (US$ Mn)
16.7.8.8. Rest of Asia Pacific Filling Fats, By Fat Content, 2017-2030 (Kilo Tons)

17. Latin America Filling Fats Market Analysis
17.1. Latin America Filling Fats Market, by Type, 2017-2030(US$ Mn)
17.1.1. Overview
17.1.2. SRC Analysis
17.2. Latin America Filling Fats Market, by Type, 2017-2030(Kilo Tons)
17.2.1. Overview
17.2.2. SRC Analysis
17.3. Latin America Filling Fats Market, by End Use, 2017-2030(US$ Mn)
17.3.1. Overview
17.3.2. SRC Analysis
17.4. Latin America Filling Fats Market, by End Use, 2017-2030(Kilo Tons)
17.4.1. Overview
17.4.2. SRC Analysis
17.5. Latin America Filling Fats Market, by Fat Content, 2017-2030(US$ Mn)
17.5.1. Overview
17.5.2. SRC Analysis
17.6. Latin America Filling Fats Market, by Fat Content, 2017-2030(Kilo Tons)
17.6.1. Overview
17.6.2. SRC Analysis
17.7. Latin America Filling Fats Market, by Country, 2017-2030 (US$ Mn)
17.7.1. Latin America Filling Fats Market Revenue, by Country, 2022 Vs 2030 (in%)
17.7.2. Latin America Filling Fats Market Volume, by Country, 2022 Vs 2030 (in%)
17.7.3. Brazil
17.7.3.1. Brazil Filling Fats Market Estimates and Forecast, 2017-2030 (US$ Mn)
17.7.3.2. Brazil Filling Fats Market Estimates and Forecast, 2017-2030 (Kilo Tons)
17.7.3.3. Brazil Filling Fats, By Type, 2017-2030 (US$ Mn)
17.7.3.4. Brazil Filling Fats, By Type, 2017-2030 (Kilo Tons)
17.7.3.5. Brazil Filling Fats, By End Use, 2017-2030 (US$ Mn)
17.7.3.6. Brazil Filling Fats, By End Use, 2017-2030 (Kilo Tons)
17.7.3.7. Brazil Filling Fats, By Fat Content, 2017-2030 (US$ Mn)
17.7.3.8. Brazil Filling Fats, By Fat Content, 2017-2030 (Kilo Tons)
17.7.4. Argentina
17.7.4.1. Argentina Filling Fats Market Estimates and Forecast, 2017-2030 (US$ Mn)
17.7.4.2. Argentina Filling Fats Market Estimates and Forecast, 2017-2030 (Kilo Tons)
17.7.4.3. Argentina Filling Fats, By Type, 2017-2030 (US$ Mn)
17.7.4.4. Argentina Filling Fats, By Type, 2017-2030 (Kilo Tons)
17.7.4.5. Argentina Filling Fats, By End Use, 2017-2030 (US$ Mn)
17.7.4.6. Argentina Filling Fats, By End Use, 2017-2030 (Kilo Tons)
17.7.4.7. Argentina Filling Fats, By Fat Content, 2017-2030 (US$ Mn)
17.7.4.8. Argentina Filling Fats, By Fat Content, 2017-2030 (Kilo Tons)
17.7.5. Rest of Latin America
17.7.5.1. Rest of Latin America Filling Fats Market Estimates and Forecast, 2017-2030 (US$ Mn)
17.7.5.2. Rest of Latin America Filling Fats Market Estimates and Forecast, 2017-2030 (Kilo Tons)
17.7.5.3. Rest of Latin America Filling Fats, By Type, 2017-2030 (US$ Mn)
17.7.5.4. Rest of Latin America Filling Fats, By Type, 2017-2030 (Kilo Tons)
17.7.5.5. Rest of Latin America Filling Fats, By End Use, 2017-2030 (US$ Mn)
17.7.5.6. Rest of Latin America Filling Fats, By End Use, 2017-2030 (Kilo Tons)
17.7.5.7. Rest of Latin America Filling Fats, By Fat Content, 2017-2030 (US$ Mn)
17.7.5.8. Rest of Latin America Filling Fats, By Fat Content, 2017-2030 (Kilo Tons)

18. Middle East and Africa Filling Fats Market Analysis
18.1. Middle East and Africa Filling Fats Market, by Type, 2017-2030(US$ Mn)
18.1.1. Overview
18.1.2. SRC Analysis
18.2. Middle East and Africa Filling Fats Market, by Type, 2017-2030(Kilo Tons)
18.2.1. Overview
18.2.2. SRC Analysis
18.3. Middle East and Africa Filling Fats Market, by End Use, 2017-2030(US$ Mn)
18.3.1. Overview
18.3.2. SRC Analysis
18.4. Middle East and Africa Filling Fats Market, by End Use, 2017-2030(Kilo Tons)
18.4.1. Overview
18.4.2. SRC Analysis
18.5. Middle East and Africa Filling Fats Market, by Fat Content, 2017-2030(US$ Mn)
18.5.1. Overview
18.5.2. SRC Analysis
18.6. Middle East and Africa Filling Fats Market, by Fat Content, 2017-2030(Kilo Tons)
18.6.1. Overview
18.6.2. SRC Analysis
18.7. Middle East and Africa Filling Fats Market, by Country, 2017-2030 (US$ Mn)
18.7.1. Middle East and Africa Filling Fats Market Revenue, by Country, 2022 Vs 2030 (in%)
18.7.2. Middle East and Africa Filling Fats Market Volume, by Country, 2022 Vs 2030 (in%)
18.7.3. GCC Countries
18.7.3.1. GCC Countries Filling Fats Market Estimates and Forecast, 2017-2030 (US$ Mn)
18.7.3.2. GCC Countries Filling Fats Market Estimates and Forecast, 2017-2030 (Kilo Tons)
18.7.3.3. GCC Countries Filling Fats, By Type, 2017-2030 (US$ Mn)
18.7.3.4. GCC Countries Filling Fats, By Type, 2017-2030 (Kilo Tons)
18.7.3.5. GCC Countries Filling Fats, By End Use, 2017-2030 (US$ Mn)
18.7.3.6. GCC Countries Filling Fats, By End Use, 2017-2030 (Kilo Tons)
18.7.3.7. GCC Countries Filling Fats, By Fat Content, 2017-2030 (US$ Mn)
18.7.3.8. GCC Countries Filling Fats, By Fat Content, 2017-2030 (Kilo Tons)
18.7.4. South Africa
18.7.4.1. South Africa Filling Fats Market Estimates and Forecast, 2017-2030 (US$ Mn)
18.7.4.2. South Africa Filling Fats Market Estimates and Forecast, 2017-2030 (Kilo Tons)
18.7.4.3. South Africa Filling Fats, By Type, 2017-2030 (US$ Mn)
18.7.4.4. South Africa Filling Fats, By Type, 2017-2030 (Kilo Tons)
18.7.4.5. South Africa Filling Fats, By End Use, 2017-2030 (US$ Mn)
18.7.4.6. South Africa Filling Fats, By End Use, 2017-2030 (Kilo Tons)
18.7.4.7. South Africa Filling Fats, By Fat Content, 2017-2030 (US$ Mn)
18.7.4.8. South Africa Filling Fats, By Fat Content, 2017-2030 (Kilo Tons)
18.7.5. Rest of Middle East and Africa
18.7.5.1. Rest of Middle East and Africa Filling Fats Market Estimates and Forecast, 2017-2030 (US$ Mn)
18.7.5.2. Rest of Middle East and Africa Filling Fats Market Estimates and Forecast, 2017-2030 (Kilo Tons)
18.7.5.3. Rest of Middle East and Africa Filling Fats, By Type, 2017-2030 (US$ Mn)
18.7.5.4. Rest of Middle East and Africa Filling Fats, By Type, 2017-2030 (Kilo Tons)
18.7.5.5. Rest of Middle East and Africa Filling Fats, By End Use, 2017-2030 (US$ Mn)
18.7.5.6. Rest of Middle East and Africa Filling Fats, By End Use, 2017-2030 (Kilo Tons)
18.7.5.7. Rest of Middle East and Africa Filling Fats, By Fat Content, 2017-2030 (US$ Mn)
18.7.5.8. Rest of Middle East and Africa Filling Fats, By Fat Content, 2017-2030 (Kilo Tons)

19. Company Profiles
19.1. Bunge
19.1.1. Company Overview
19.1.2. Products/Services Portfolio
19.1.3. Geographical Presence
19.1.4. Financial Summary
19.1.4.1. Market Revenue and Net Profit (2019-2022)
19.1.4.2. Business Segment Revenue Analysis
19.1.4.3. Geographical Revenue Analysis
19.2. Fuji Oil Europe NV
19.3. Manorama Industries Private Limited
19.4. Mewah International Group
19.5. Loders Croklaan B.V.
19.6. Wilmar International Ltd.
19.7. Sime Darby Plantation Berhad
19.8. Felda Iffo LLC
19.9. Rieckermann GmbH AAK AB
19.10. Eksper Gida

List of Figures
FIG. 1 Global Filling Fats Market: Research Methodology
FIG. 2 Market Size Estimation – Top Down & Bottom up Approach
FIG. 3 Global Filling Fats Market Segmentation
FIG. 4 Global Filling Fats Market, by Type, 2022 (US$ Mn) (Kilo Tons)
FIG. 5 Global Filling Fats Market, by End Use, 2022 (US$ Mn) (Kilo Tons)
FIG. 6 Global Filling Fats Market, by Fat Content, 2022 (US$ Mn) (Kilo Tons)
FIG. 7 Global Filling Fats Market, by Geography, 2022 (US$ Mn) (Kilo Tons)
FIG. 8 Attractive Investment Proposition, by Type, 2022
FIG. 9 Attractive Investment Proposition, by End Use, 2022
FIG. 10 Attractive Investment Proposition, by Fat Content, 2022
FIG. 11 Attractive Investment Proposition, by Geography, 2022
FIG. 12 Global Market Share Analysis of Key Filling Fats Market Manufacturers, 2022
FIG. 13 Global Market Positioning of Key Filling Fats Market Manufacturers, 2022
FIG. 14 Global Filling Fats Market Value Contribution, By Type, 2022 & 2030 (Value %)
FIG. 15 Global Filling Fats Market, by Lauric, Value, 2017-2030 (US$ Mn) (Kilo Tons)
FIG. 16 Global Filling Fats Market, by Non-lauric, Value, 2017-2030 (US$ Mn) (Kilo Tons)
FIG. 17 Global Filling Fats Market Value Contribution, By End Use, 2022 & 2030 (Value %)
FIG. 18 Global Filling Fats Market, by Confectionery, Value, 2017-2030 (US$ Mn) (Kilo Tons)
FIG. 19 Global Filling Fats Market, by Toffee Filling, 2017-2030 (US$ Mn) (Kilo Tons)
FIG. 20 Global Filling Fats Market, by Confectionery Spreads, 2017-2030 (US$ Mn) (Kilo Tons)
FIG. 21 Global Filling Fats Market, by Chocalate Compounding, 2017-2030 (US$ Mn) (Kilo Tons)
FIG. 22 Global Filling Fats Market, by Confectionery bars, 2017-2030 (US$ Mn) (Kilo Tons)
FIG. 23 Global Filling Fats Market, by Pralines, 2017-2030 (US$ Mn) (Kilo Tons)
FIG. 24 Global Filling Fats Market, by Bakery & Snacks, 2017-2030 (US$ Mn) (Kilo Tons)
FIG. 25 Global Filling Fats Market, by Frozen desserts, 2017-2030 (US$ Mn) (Kilo Tons)
FIG. 26 Global Filling Fats Market, by Spreads & Dressings, 2017-2030 (US$ Mn) (Kilo Tons)
FIG. 27 Global Filling Fats Market, by Others, 2017-2030 (US$ Mn) (Kilo Tons)
FIG. 28 Global Filling Fats Market Value Contribution, By Fat Content, 2022 & 2030 (Value %)
FIG. 29 Global Filling Fats Market, by High Fat, Value, 2017-2030 (US$ Mn) (Kilo Tons)
FIG. 30 Global Filling Fats Market, by Low Fat, 2017-2030 (US$ Mn) (Kilo Tons)
FIG. 31 North America Filling Fats Market, 2017-2030 (US$ Mn) (Kilo Tons)
FIG. 32 U.S. Filling Fats Market, 2017-2030 (US$ Mn) (Kilo Tons)
FIG. 33 Canada Filling Fats Market, 2017-2030 (US$ Mn) (Kilo Tons)
FIG. 34 Europe Filling Fats Market, 2017-2030 (US$ Mn) (Kilo Tons)
FIG. 35 Germany Filling Fats Market, 2017-2030 (US$ Mn) (Kilo Tons)
FIG. 36 France Filling Fats Market, 2017-2030 (US$ Mn) (Kilo Tons)
FIG. 37 U.K. Filling Fats Market, 2017-2030 (US$ Mn) (Kilo Tons)
FIG. 38 Italy Filling Fats Market, 2017-2030 (US$ Mn) (Kilo Tons)
FIG. 39 Spain Filling Fats Market, 2017-2030 (US$ Mn) (Kilo Tons)
FIG. 40 Rest of Europe Filling Fats Market, 2017-2030 (US$ Mn) (Kilo Tons)
FIG. 41 Asia Pacific Filling Fats Market, 2017-2030 (US$ Mn) (Kilo Tons)
FIG. 42 China Filling Fats Market, 2017-2030 (US$ Mn) (Kilo Tons)
FIG. 43 Japan Filling Fats Market, 2017-2030 (US$ Mn) (Kilo Tons)
FIG. 44 India Filling Fats Market, 2017-2030 (US$ Mn) (Kilo Tons)
FIG. 45 South Korea Filling Fats Market, 2017-2030 (US$ Mn) (Kilo Tons)
FIG. 46 South-East Asia Filling Fats Market, 2017-2030 (US$ Mn) (Kilo Tons)
FIG. 47 Rest of Asia Pacific Filling Fats Market, 2017-2030 (US$ Mn) (Kilo Tons)
FIG. 48 Latin America Filling Fats Market, 2017-2030 (US$ Mn) (Kilo Tons)
FIG. 49 Brazil Filling Fats Market, 2017-2030 (US$ Mn) (Kilo Tons)
FIG. 50 Mexico Filling Fats Market, 2017-2030 (US$ Mn) (Kilo Tons)
FIG. 51 Rest of Latin America Filling Fats Market, 2017-2030 (US$ Mn) (Kilo Tons)
FIG. 52 Middle East & Africa Filling Fats Market, 2017-2030 (US$ Mn) (Kilo Tons)
FIG. 53 GCC Countries Filling Fats Market, 2017-2030 (US$ Mn) (Kilo Tons)
FIG. 54 South Africa Filling Fats Market, 2017-2030 (US$ Mn) (Kilo Tons)
FIG. 55 Rest of Middle East and Africa Filling Fats Market, 2017-2030 (US$ Mn) (Kilo Tons)


List of Tables
TABLE 1 Market Snapshot: Global Filling Fats Market
TABLE 2 Global Filling Fats Market: Market Drivers Impact Analysis
TABLE 3 Global Filling Fats Market: Market Restraints Impact Analysis
TABLE 4 Global Filling Fats Market, by Competitive Benchmarking, 2022
TABLE 5 Global Filling Fats Market, by Geographical Presence Analysis, 2022
TABLE 6 Global Filling Fats Market, by Key Strategies Analysis, 2022
TABLE 7 Global Filling Fats Market, by Lauric, By Region, 2017-2022 (US$ Mn)
TABLE 8 Global Filling Fats Market, by Lauric, By Region, 2023-2030 (US$ Mn)
TABLE 9 Global Filling Fats Market, by Lauric, By Region, 2017-2022 (Kilo Tons)
TABLE 10 Global Filling Fats Market, by Lauric, By Region, 2023-2030 (Kilo Tons)
TABLE 11 Global Filling Fats Market, by Non-Lauric, By Region, 2017-2022 (US$ Mn)
TABLE 12 Global Filling Fats Market, by Non-Lauric, By Region, 2023-2030 (US$ Mn)
TABLE 13 Global Filling Fats Market, by Non-Lauric, By Region, 2017-2022 (Kilo Tons)
TABLE 14 Global Filling Fats Market, by Non-Lauric, By Region, 2023-2030 (Kilo Tons)
TABLE 15 Global Filling Fats Market, by Confectionery, By Region, 2017-2022 (US$ Mn)
TABLE 16 Global Filling Fats Market, by Confectionery, By Region, 2023-2030 (US$ Mn)
TABLE 17 Global Filling Fats Market, by Confectionery, By Region, 2017-2022 (Kilo Tons)
TABLE 18 Global Filling Fats Market, by Confectionery, By Region, 2023-2030 (Kilo Tons)
TABLE 19 Global Filling Fats Market, by Toffee Filling, By Region, 2017-2022 (US$ Mn)
TABLE 20 Global Filling Fats Market, by Toffee Filling, By Region, 2023-2030 (US$ Mn)
TABLE 21 Global Filling Fats Market, by Toffee Filling, By Region, 2017-2022 (Kilo Tons)
TABLE 22 Global Filling Fats Market, by Toffee Filling, By Region, 2023-2030 (Kilo Tons)
TABLE 23 Global Filling Fats Market, by Confectionery Spreads, By Region, 2017-2022 (US$ Mn)
TABLE 24 Global Filling Fats Market, by Confectionery Spreads, By Region, 2023-2030 (US$ Mn)
TABLE 25 Global Filling Fats Market, by Confectionery Spreads, By Region, 2017-2022 (Kilo Tons)
TABLE 26 Global Filling Fats Market, by Confectionery Spreads, By Region, 2023-2030 (Kilo Tons)
TABLE 27 Global Filling Fats Market, by Chocalate Compounding, By Region, 2017-2022 (US$ Mn)
TABLE 28 Global Filling Fats Market, by Chocalate Compounding, By Region, 2023-2030 (US$ Mn)
TABLE 29 Global Filling Fats Market, by Chocalate Compounding, By Region, 2017-2022 (Kilo Tons)
TABLE 30 Global Filling Fats Market, by Chocalate Compounding, By Region, 2023-2030 (Kilo Tons)
TABLE 31 Global Filling Fats Market, by Confectionery bars, By Region, 2017-2022 (US$ Mn)
TABLE 32 Global Filling Fats Market, by Confectionery bars, By Region, 2023-2030 (US$ Mn)
TABLE 33 Global Filling Fats Market, by Confectionery bars, By Region, 2017-2022 (Kilo Tons)
TABLE 34 Global Filling Fats Market, by Confectionery bars, By Region, 2023-2030 (Kilo Tons)
TABLE 35 Global Filling Fats Market, by Pralines, By Region, 2017-2022 (US$ Mn)
TABLE 36 Global Filling Fats Market, by Pralines, By Region, 2023-2030 (US$ Mn)
TABLE 37 Global Filling Fats Market, by Pralines, By Region, 2017-2022 (Kilo Tons)
TABLE 38 Global Filling Fats Market, by Pralines, By Region, 2023-2030 (Kilo Tons)
TABLE 39 Global Filling Fats Market, by Bakery & Snacks, By Region, 2017-2022 (US$ Mn)
TABLE 40 Global Filling Fats Market, by Bakery & Snacks, By Region, 2023-2030 (US$ Mn)
TABLE 41 Global Filling Fats Market, by Bakery & Snacks, By Region, 2017-2022 (Kilo Tons)
TABLE 42 Global Filling Fats Market, by Bakery & Snacks, By Region, 2023-2030 (Kilo Tons)
TABLE 43 Global Filling Fats Market, by Frozen desserts, By Region, 2017-2022 (US$ Mn)
TABLE 44 Global Filling Fats Market, by Frozen desserts, By Region, 2023-2030 (US$ Mn)
TABLE 45 Global Filling Fats Market, by Frozen desserts, By Region, 2017-2022 (Kilo Tons)
TABLE 46 Global Filling Fats Market, by Frozen desserts, By Region, 2023-2030 (Kilo Tons)
TABLE 47 Global Filling Fats Market, by Spreads & Dressings, By Region, 2017-2022 (US$ Mn)
TABLE 48 Global Filling Fats Market, by Spreads & Dressings, By Region, 2023-2030 (US$ Mn)
TABLE 49 Global Filling Fats Market, by Spreads & Dressings, By Region, 2017-2022 (Kilo Tons)
TABLE 50 Global Filling Fats Market, by Spreads & Dressings, By Region, 2023-2030 (Kilo Tons)
TABLE 51 Global Filling Fats Market, by Others, By Region, 2017-2022 (US$ Mn)
TABLE 52 Global Filling Fats Market, by Others, By Region, 2023-2030 (US$ Mn)
TABLE 53 Global Filling Fats Market, by Others, By Region, 2017-2022 (Kilo Tons)
TABLE 54 Global Filling Fats Market, by Others, By Region, 2023-2030 (Kilo Tons)
TABLE 55 Global Filling Fats Market, by High Fat, By Region, 2017-2022 (US$ Mn)
TABLE 56 Global Filling Fats Market, by High Fat, By Region, 2023-2030 (US$ Mn)
TABLE 57 Global Filling Fats Market, by High Fat, By Region, 2017-2022 (Kilo Tons)
TABLE 58 Global Filling Fats Market, by High Fat, By Region, 2023-2030 (Kilo Tons)
TABLE 59 Global Filling Fats Market, by Low Fat, By Region, 2017-2022 (US$ Mn)
TABLE 60 Global Filling Fats Market, by Low Fat, By Region, 2023-2030 (US$ Mn)
TABLE 61 Global Filling Fats Market, by Low Fat, By Region, 2017-2022 (Kilo Tons)
TABLE 62 Global Filling Fats Market, by Low Fat, By Region, 2023-2030 (Kilo Tons)
TABLE 63 Global Filling Fats Market, by Type, 2017-2022 (US$ Mn)
TABLE 64 Global Filling Fats Market, by Type, 2023-2030 (US$ Mn)
TABLE 65 Global Filling Fats Market, by Type, 2017-2022 (Kilo Tons)
TABLE 66 Global Filling Fats Market, by Type, 2023-2030 (Kilo Tons)
TABLE 67 Global Filling Fats Market, by End Use, 2017-2022 (US$ Mn)
TABLE 68 Global Filling Fats Market, by End Use, 2023-2030 (US$ Mn)
TABLE 69 Global Filling Fats Market, by End Use, 2017-2022 (Kilo Tons)
TABLE 70 Global Filling Fats Market, by End Use, 2023-2030 (Kilo Tons)
TABLE 71 Global Filling Fats Market, by Fat Content, 2017-2022 (US$ Mn)
TABLE 72 Global Filling Fats Market, by Fat Content, 2023-2030 (US$ Mn)
TABLE 73 Global Filling Fats Market, by Fat Content, 2017-2022 (Kilo Tons)
TABLE 74 Global Filling Fats Market, by Fat Content, 2023-2030 (Kilo Tons)
TABLE 75 Global Filling Fats Market, by Region, 2017-2022 (US$ Mn)
TABLE 76 Global Filling Fats Market, by Region, 2023-2030 (US$ Mn)
TABLE 77 Global Filling Fats Market, by Region, 2017-2022 (Kilo Tons)
TABLE 78 Global Filling Fats Market, by Region, 2023-2030 (Kilo Tons)
TABLE 79 North America Filling Fats Market, by Type, 2017-2022 (US$ Mn)
TABLE 80 North America Filling Fats Market, by Type, 2023-2030 (US$ Mn)
TABLE 81 North America Filling Fats Market, by Type, 2017-2022 (Kilo Tons)
TABLE 82 North America Filling Fats Market, by Type, 2023-2030 (Kilo Tons)
TABLE 83 North America Filling Fats Market, by End Use, 2017-2022 (US$ Mn)
TABLE 84 North America Filling Fats Market, by End Use, 2023-2030 (US$ Mn)
TABLE 85 North America Filling Fats Market, by End Use, 2017-2022 (Kilo Tons)
TABLE 86 North America Filling Fats Market, by End Use, 2023-2030 (Kilo Tons)
TABLE 87 North America Filling Fats Market, by Fat Content, 2017-2022 (US$ Mn)
TABLE 88 North America Filling Fats Market, by Fat Content, 2023-2030 (US$ Mn)
TABLE 89 North America Filling Fats Market, by Fat Content, 2017-2022 (Kilo Tons)
TABLE 90 North America Filling Fats Market, by Fat Content, 2023-2030 (Kilo Tons)
TABLE 91 North America Filling Fats Market, by Country, 2017-2022 (US$ Mn)
TABLE 92 North America Filling Fats Market, by Country, 2023-2030 (US$ Mn)
TABLE 93 North America Filling Fats Market, by Country, 2017-2022 (Kilo Tons)
TABLE 94 North America Filling Fats Market, by Country, 2023-2030 (Kilo Tons)
TABLE 95 U.S. Filling Fats Market, by Type, 2017-2022 (US$ Mn)
TABLE 96 U.S. Filling Fats Market, by Type, 2023-2030 (US$ Mn)
TABLE 97 U.S. Filling Fats Market, by Type, 2017-2022 (Kilo Tons)
TABLE 98 U.S. Filling Fats Market, by Type, 2023-2030 (Kilo Tons)
TABLE 99 U.S. Filling Fats Market, by End Use, 2017-2022 (US$ Mn)
TABLE 100 U.S. Filling Fats Market, by End Use, 2023-2030 (US$ Mn)
TABLE 101 U.S. Filling Fats Market, by End Use, 2017-2022 (Kilo Tons)
TABLE 102 U.S. Filling Fats Market, by End Use, 2023-2030 (Kilo Tons)
TABLE 103 U.S. Filling Fats Market, by Fat Content, 2017-2022 (US$ Mn)
TABLE 104 U.S. Filling Fats Market, by Fat Content, 2023-2030 (US$ Mn)
TABLE 105 U.S. Filling Fats Market, by Fat Content, 2017-2022 (Kilo Tons)
TABLE 106 U.S. Filling Fats Market, by Fat Content, 2023-2030 (Kilo Tons)
TABLE 107 Canada Filling Fats Market, by Type, 2017-2022 (US$ Mn)
TABLE 108 Canada Filling Fats Market, by Type, 2023-2030 (US$ Mn)
TABLE 109 Canada Filling Fats Market, by Type, 2017-2022 (Kilo Tons)
TABLE 110 Canada Filling Fats Market, by Type, 2023-2030 (Kilo Tons)
TABLE 111 Canada Filling Fats Market, by End Use, 2017-2022 (US$ Mn)
TABLE 112 Canada Filling Fats Market, by End Use, 2023-2030 (US$ Mn)
TABLE 113 Canada Filling Fats Market, by End Use, 2017-2022 (Kilo Tons)
TABLE 114 Canada Filling Fats Market, by End Use, 2023-2030 (Kilo Tons)
TABLE 115 Canada Filling Fats Market, by Fat Content, 2017-2022 (US$ Mn)
TABLE 116 Canada Filling Fats Market, by Fat Content, 2023-2030 (US$ Mn)
TABLE 117 Canada Filling Fats Market, by Fat Content, 2017-2022 (Kilo Tons)
TABLE 118 Canada Filling Fats Market, by Fat Content, 2023-2030 (Kilo Tons)
TABLE 119 Mexico Filling Fats Market, by Type, 2017-2022 (US$ Mn)
TABLE 120 Mexico Filling Fats Market, by Type, 2023-2030 (US$ Mn)
TABLE 121 Mexico Filling Fats Market, by Type, 2017-2022 (Kilo Tons)
TABLE 122 Mexico Filling Fats Market, by Type, 2023-2030 (Kilo Tons)
TABLE 123 Mexico Filling Fats Market, by End Use, 2017-2022 (US$ Mn)
TABLE 124 Mexico Filling Fats Market, by End Use, 2023-2030 (US$ Mn)
TABLE 125 Mexico Filling Fats Market, by End Use, 2017-2022 (Kilo Tons)
TABLE 126 Mexico Filling Fats Market, by End Use, 2023-2030 (Kilo Tons)
TABLE 127 Mexico Filling Fats Market, by Fat Content, 2017-2022 (US$ Mn)
TABLE 128 Mexico Filling Fats Market, by Fat Content, 2023-2030 (US$ Mn)
TABLE 129 Mexico Filling Fats Market, by Fat Content, 2017-2022 (Kilo Tons)
TABLE 130 Mexico Filling Fats Market, by Fat Content, 2023-2030 (Kilo Tons)
TABLE 131 Europe Filling Fats Market, by Type, 2017-2022 (US$ Mn)
TABLE 132 Europe Filling Fats Market, by Type, 2023-2030 (US$ Mn)
TABLE 133 Europe Filling Fats Market, by Type, 2017-2022 (Kilo Tons)
TABLE 134 Europe Filling Fats Market, by Type, 2023-2030 (Kilo Tons)
TABLE 135 Europe Filling Fats Market, by End Use, 2017-2022 (US$ Mn)
TABLE 136 Europe Filling Fats Market, by End Use, 2023-2030 (US$ Mn)
TABLE 137 Europe Filling Fats Market, by End Use, 2017-2022 (Kilo Tons)
TABLE 138 Europe Filling Fats Market, by End Use, 2023-2030 (Kilo Tons)
TABLE 139 Europe Filling Fats Market, by Fat Content, 2017-2022 (US$ Mn)
TABLE 140 Europe Filling Fats Market, by Fat Content, 2023-2030 (US$ Mn)
TABLE 141 Europe Filling Fats Market, by Fat Content, 2017-2022 (Kilo Tons)
TABLE 142 Europe Filling Fats Market, by Fat Content, 2023-2030 (Kilo Tons)
TABLE 143 Germany Filling Fats Market, by Type, 2017-2022 (US$ Mn)
TABLE 144 Germany Filling Fats Market, by Type, 2023-2030 (US$ Mn)
TABLE 145 Germany Filling Fats Market, by Type, 2017-2022 (Kilo Tons)
TABLE 146 Europe Filling Fats Market, by Country, 2017-2022 (US$ Mn)
TABLE 147 Europe Filling Fats Market, by Country, 2023-2030 (US$ Mn)
TABLE 148 Europe Filling Fats Market, by Country, 2017-2022 (Kilo Tons)
TABLE 149 Europe Filling Fats Market, by Country, 2023-2030 (Kilo Tons)
TABLE 150 Germany Filling Fats Market, by Type, 2023-2030 (Kilo Tons)
TABLE 151 Germany Filling Fats Market, by End Use, 2017-2022 (US$ Mn)
TABLE 152 Germany Filling Fats Market, by End Use, 2023-2030 (US$ Mn)
TABLE 153 Germany Filling Fats Market, by End Use, 2017-2022 (Kilo Tons)
TABLE 154 Germany Filling Fats Market, by End Use, 2023-2030 (Kilo Tons)
TABLE 155 Germany Filling Fats Market, by Fat Content, 2017-2022 (US$ Mn)
TABLE 156 Germany Filling Fats Market, by Fat Content, 2023-2030 (US$ Mn)
TABLE 157 Germany Filling Fats Market, by Fat Content, 2017-2022 (Kilo Tons)
TABLE 158 Germany Filling Fats Market, by Fat Content, 2023-2030 (Kilo Tons)
TABLE 159 France Filling Fats Market, by Type, 2017-2022 (US$ Mn)
TABLE 160 France Filling Fats Market, by Type, 2023-2030 (US$ Mn)
TABLE 161 France Filling Fats Market, by Type, 2017-2022 (Kilo Tons)
TABLE 162 France Filling Fats Market, by Type, 2023-2030 (Kilo Tons)
TABLE 163 France Filling Fats Market, by End Use, 2017-2022 (US$ Mn)
TABLE 164 France Filling Fats Market, by End Use, 2023-2030 (US$ Mn)
TABLE 165 France Filling Fats Market, by End Use, 2017-2022 (Kilo Tons)
TABLE 166 France Filling Fats Market, by End Use, 2023-2030 (Kilo Tons)
TABLE 167 France Filling Fats Market, by Fat Content, 2017-2022 (US$ Mn)
TABLE 168 France Filling Fats Market, by Fat Content, 2023-2030 (US$ Mn)
TABLE 169 France Filling Fats Market, by Fat Content, 2017-2022 (Kilo Tons)
TABLE 170 France Filling Fats Market, by Fat Content, 2023-2030 (Kilo Tons)
TABLE 171 U.K. Filling Fats Market, by Type, 2017-2022 (US$ Mn)
TABLE 172 U.K. Filling Fats Market, by Type, 2023-2030 (US$ Mn)
TABLE 173 U.K. Filling Fats Market, by Type, 2017-2022 (Kilo Tons)
TABLE 174 U.K. Filling Fats Market, by Type, 2023-2030 (Kilo Tons)
TABLE 175 U.K. Filling Fats Market, by End Use, 2017-2022 (US$ Mn)
TABLE 176 U.K. Filling Fats Market, by End Use, 2023-2030 (US$ Mn)
TABLE 177 U.K. Filling Fats Market, by End Use, 2017-2022 (Kilo Tons)
TABLE 178 U.K. Filling Fats Market, by End Use, 2023-2030 (Kilo Tons)
TABLE 179 U.K. Filling Fats Market, by Fat Content, 2017-2022 (US$ Mn)
TABLE 180 U.K. Filling Fats Market, by Fat Content, 2023-2030 (US$ Mn)
TABLE 181 U.K. Filling Fats Market, by Fat Content, 2017-2022 (Kilo Tons)
TABLE 182 U.K. Filling Fats Market, by Fat Content, 2023-2030 (Kilo Tons)
TABLE 183 Italy Filling Fats Market, by Type, 2017-2022 (US$ Mn)
TABLE 184 Italy Filling Fats Market, by Type, 2023-2030 (US$ Mn)
TABLE 185 Italy Filling Fats Market, by Type, 2017-2022 (Kilo Tons)
TABLE 186 Italy Filling Fats Market, by Type, 2023-2030 (Kilo Tons)
TABLE 187 Italy Filling Fats Market, by End Use, 2017-2022 (US$ Mn)
TABLE 188 Italy Filling Fats Market, by End Use, 2023-2030 (US$ Mn)
TABLE 189 Italy Filling Fats Market, by End Use, 2017-2022 (Kilo Tons)
TABLE 190 Italy Filling Fats Market, by End Use, 2023-2030 (Kilo Tons)
TABLE 191 Italy Filling Fats Market, by Fat Content, 2017-2022 (US$ Mn)
TABLE 192 Italy Filling Fats Market, by Fat Content, 2023-2030 (US$ Mn)
TABLE 193 Italy Filling Fats Market, by Fat Content, 2017-2022 (Kilo Tons)
TABLE 194 Italy Filling Fats Market, by Fat Content, 2023-2030 (Kilo Tons)
TABLE 195 Spain Filling Fats Market, by Type, 2017-2022 (US$ Mn)
TABLE 196 Spain Filling Fats Market, by Type, 2023-2030 (US$ Mn)
TABLE 197 Spain Filling Fats Market, by Type, 2017-2022 (Kilo Tons)
TABLE 198 Spain Filling Fats Market, by Type, 2023-2030 (Kilo Tons)
TABLE 199 Spain Filling Fats Market, by End Use, 2017-2022 (US$ Mn)
TABLE 200 Spain Filling Fats Market, by End Use, 2023-2030 (US$ Mn)
TABLE 201 Spain Filling Fats Market, by End Use, 2017-2022 (Kilo Tons)
TABLE 202 Spain Filling Fats Market, by End Use, 2023-2030 (Kilo Tons)
TABLE 203 Spain Filling Fats Market, by Fat Content, 2017-2022 (US$ Mn)
TABLE 204 Spain Filling Fats Market, by Fat Content, 2023-2030 (US$ Mn)
TABLE 205 Spain Filling Fats Market, by Fat Content, 2017-2022 (Kilo Tons)
TABLE 206 Spain Filling Fats Market, by Fat Content, 2023-2030 (Kilo Tons)
TABLE 207 Rest of Europe Filling Fats Market, by Type, 2017-2022 (US$ Mn)
TABLE 208 Rest of Europe Filling Fats Market, by Type, 2023-2030 (US$ Mn)
TABLE 209 Rest of Europe Filling Fats Market, by Type, 2017-2022 (Kilo Tons)
TABLE 210 Rest of Europe Filling Fats Market, by Type, 2023-2030 (Kilo Tons)
TABLE 211 Rest of Europe Filling Fats Market, by End Use, 2017-2022 (US$ Mn)
TABLE 212 Rest of Europe Filling Fats Market, by End Use, 2023-2030 (US$ Mn)
TABLE 213 Rest of Europe Filling Fats Market, by End Use, 2017-2022 (Kilo Tons)
TABLE 214 Rest of Europe Filling Fats Market, by End Use, 2023-2030 (Kilo Tons)
TABLE 215 Rest of Europe Filling Fats Market, by Fat Content, 2017-2022 (US$ Mn)
TABLE 216 Rest of Europe Filling Fats Market, by Fat Content, 2023-2030 (US$ Mn)
TABLE 217 Rest of Europe Filling Fats Market, by Fat Content, 2017-2022 (Kilo Tons)
TABLE 218 Rest of Europe Filling Fats Market, by Fat Content, 2023-2030 (Kilo Tons)
TABLE 219 Asia Pacific Filling Fats Market, by Type, 2017-2022 (US$ Mn)
TABLE 220 Asia Pacific Filling Fats Market, by Type, 2023-2030 (US$ Mn)
TABLE 221 Asia Pacific Filling Fats Market, by Type, 2017-2022 (Kilo Tons)
TABLE 222 Asia Pacific Filling Fats Market, by Type, 2023-2030 (Kilo Tons)
TABLE 223 Asia Pacific Filling Fats Market, by End Use, 2017-2022 (US$ Mn)
TABLE 224 Asia Pacific Filling Fats Market, by End Use, 2023-2030 (US$ Mn)
TABLE 225 Asia Pacific Filling Fats Market, by End Use, 2017-2022 (Kilo Tons)
TABLE 226 Asia Pacific Filling Fats Market, by End Use, 2023-2030 (Kilo Tons)
TABLE 227 Asia Pacific Filling Fats Market, by Fat Content, 2017-2022 (US$ Mn)
TABLE 228 Asia Pacific Filling Fats Market, by Fat Content, 2023-2030 (US$ Mn)
TABLE 229 Asia Pacific Filling Fats Market, by Fat Content, 2017-2022 (Kilo Tons)
TABLE 230 Asia Pacific Filling Fats Market, by Fat Content, 2023-2030 (Kilo Tons)
TABLE 231 Asia Pacific Filling Fats Market, by Country, 2017-2022 (US$ Mn)
TABLE 232 Asia Pacific Filling Fats Market, by Country, 2023-2030 (US$ Mn)
TABLE 233 Asia Pacific Filling Fats Market, by Country, 2017-2022 (Kilo Tons)
TABLE 234 Asia Pacific Filling Fats Market, by Country, 2023-2030 (Kilo Tons)
TABLE 235 China Filling Fats Market, by Type, 2017-2022 (US$ Mn)
TABLE 236 China Filling Fats Market, by Type, 2023-2030 (US$ Mn)
TABLE 237 China Filling Fats Market, by Type, 2017-2022 (Kilo Tons)
TABLE 238 China Filling Fats Market, by Type, 2023-2030 (Kilo Tons)
TABLE 239 China Filling Fats Market, by End Use, 2017-2022 (US$ Mn)
TABLE 240 China Filling Fats Market, by End Use, 2023-2030 (US$ Mn)
TABLE 241 China Filling Fats Market, by End Use, 2017-2022 (Kilo Tons)
TABLE 242 China Filling Fats Market, by End Use, 2023-2030 (Kilo Tons)
TABLE 243 China Filling Fats Market, by Fat Content, 2017-2022 (US$ Mn)
TABLE 244 China Filling Fats Market, by Fat Content, 2023-2030 (US$ Mn)
TABLE 245 China Filling Fats Market, by Fat Content, 2017-2022 (Kilo Tons)
TABLE 246 China Filling Fats Market, by Fat Content, 2023-2030 (Kilo Tons)
TABLE 247 Japan Filling Fats Market, by Type, 2017-2022 (US$ Mn)
TABLE 248 Japan Filling Fats Market, by Type, 2023-2030 (US$ Mn)
TABLE 249 Japan Filling Fats Market, by Type, 2017-2022 (Kilo Tons)
TABLE 250 Japan Filling Fats Market, by Type, 2023-2030 (Kilo Tons)
TABLE 251 Japan Filling Fats Market, by End Use, 2017-2022 (US$ Mn)
TABLE 252 Japan Filling Fats Market, by End Use, 2023-2030 (US$ Mn)
TABLE 253 Japan Filling Fats Market, by End Use, 2017-2022 (Kilo Tons)
TABLE 254 Japan Filling Fats Market, by End Use, 2023-2030 (Kilo Tons)
TABLE 255 Japan Filling Fats Market, by Fat Content, 2017-2022 (US$ Mn)
TABLE 256 Japan Filling Fats Market, by Fat Content, 2023-2030 (US$ Mn)
TABLE 257 Japan Filling Fats Market, by Fat Content, 2017-2022 (Kilo Tons)
TABLE 258 Japan Filling Fats Market, by Fat Content, 2023-2030 (Kilo Tons)
TABLE 259 India Filling Fats Market, by Type, 2017-2022 (US$ Mn)
TABLE 260 India Filling Fats Market, by Type, 2023-2030 (US$ Mn)
TABLE 261 India Filling Fats Market, by Type, 2017-2022 (Kilo Tons)
TABLE 262 India Filling Fats Market, by Type, 2023-2030 (Kilo Tons)
TABLE 263 India Filling Fats Market, by End Use, 2017-2022 (US$ Mn)
TABLE 264 India Filling Fats Market, by End Use, 2023-2030 (US$ Mn)
TABLE 265 India Filling Fats Market, by End Use, 2017-2022 (Kilo Tons)
TABLE 266 India Filling Fats Market, by End Use, 2023-2030 (Kilo Tons)
TABLE 267 India Filling Fats Market, by Fat Content, 2017-2022 (US$ Mn)
TABLE 268 India Filling Fats Market, by Fat Content, 2023-2030 (US$ Mn)
TABLE 269 India Filling Fats Market, by Fat Content, 2017-2022 (Kilo Tons)
TABLE 270 India Filling Fats Market, by Fat Content, 2023-2030 (Kilo Tons)
TABLE 271 South Korea Filling Fats Market, by Type, 2017-2022 (US$ Mn)
TABLE 272 South Korea Filling Fats Market, by Type, 2023-2030 (US$ Mn)
TABLE 273 South Korea Filling Fats Market, by Type, 2017-2022 (Kilo Tons)
TABLE 274 South Korea Filling Fats Market, by Type, 2023-2030 (Kilo Tons)
TABLE 275 South Korea Filling Fats Market, by End Use, 2017-2022 (US$ Mn)
TABLE 276 South Korea Filling Fats Market, by End Use, 2023-2030 (US$ Mn)
TABLE 277 South Korea Filling Fats Market, by End Use, 2017-2022 (Kilo Tons)
TABLE 278 South Korea Filling Fats Market, by End Use, 2023-2030 (Kilo Tons)
TABLE 279 South Korea Filling Fats Market, by Fat Content, 2017-2022 (US$ Mn)
TABLE 280 South Korea Filling Fats Market, by Fat Content, 2023-2030 (US$ Mn)
TABLE 281 South Korea Filling Fats Market, by Fat Content, 2017-2022 (Kilo Tons)
TABLE 282 South Korea Filling Fats Market, by Fat Content, 2023-2030 (Kilo Tons)
TABLE 283 South-East Asia Filling Fats Market, by Type, 2017-2022 (US$ Mn)
TABLE 284 South-East Asia Filling Fats Market, by Type, 2023-2030 (US$ Mn)
TABLE 285 South-East Asia Filling Fats Market, by Type, 2017-2022 (Kilo Tons)
TABLE 286 South-East Asia Filling Fats Market, by Type, 2023-2030 (Kilo Tons)
TABLE 287 South-East Asia Filling Fats Market, by End Use, 2017-2022 (US$ Mn)
TABLE 288 South-East Asia Filling Fats Market, by End Use, 2023-2030 (US$ Mn)
TABLE 289 South-East Asia Filling Fats Market, by End Use, 2017-2022 (Kilo Tons)
TABLE 290 South-East Asia Filling Fats Market, by End Use, 2023-2030 (Kilo Tons)
TABLE 291 South-East Asia Filling Fats Market, by Fat Content, 2017-2022 (US$ Mn)
TABLE 292 South-East Asia Filling Fats Market, by Fat Content, 2023-2030 (US$ Mn)
TABLE 293 South-East Asia Filling Fats Market, by Fat Content, 2017-2022 (Kilo Tons)
TABLE 294 South-East Asia Filling Fats Market, by Fat Content, 2023-2030 (Kilo Tons)
TABLE 295 Rest of Asia Pacific Filling Fats Market, by Type, 2017-2022 (US$ Mn)
TABLE 296 Rest of Asia Pacific Filling Fats Market, by Type, 2023-2030 (US$ Mn)
TABLE 297 Rest of Asia Pacific Filling Fats Market, by Type, 2017-2022 (Kilo Tons)
TABLE 298 Rest of Asia Pacific Filling Fats Market, by Type, 2023-2030 (Kilo Tons)
TABLE 299 Rest of Asia Pacific Filling Fats Market, by End Use, 2017-2022 (US$ Mn)
TABLE 300 Rest of Asia Pacific Filling Fats Market, by End Use, 2023-2030 (US$ Mn)
TABLE 301 Rest of Asia Pacific Filling Fats Market, by End Use, 2017-2022 (Kilo Tons)
TABLE 302 Rest of Asia Pacific Filling Fats Market, by End Use, 2023-2030 (Kilo Tons)
TABLE 303 Rest of Asia Pacific Filling Fats Market, by Fat Content, 2017-2022 (US$ Mn)
TABLE 304 Rest of Asia Pacific Filling Fats Market, by Fat Content, 2023-2030 (US$ Mn)
TABLE 305 Rest of Asia Pacific Filling Fats Market, by Fat Content, 2017-2022 (Kilo Tons)
TABLE 306 Rest of Asia Pacific Filling Fats Market, by Fat Content, 2023-2030 (Kilo Tons)
TABLE 307 Latin America Filling Fats Market, by Type, 2017-2022 (US$ Mn)
TABLE 308 Latin America Filling Fats Market, by Type, 2023-2030 (US$ Mn)
TABLE 309 Latin America Filling Fats Market, by Type, 2017-2022 (Kilo Tons)
TABLE 310 Latin America Filling Fats Market, by Type, 2023-2030 (Kilo Tons)
TABLE 311 Latin America Filling Fats Market, by End Use, 2017-2022 (US$ Mn)
TABLE 312 Latin America Filling Fats Market, by End Use, 2023-2030 (US$ Mn)
TABLE 313 Latin America Filling Fats Market, by End Use, 2017-2022 (Kilo Tons)
TABLE 314 Latin America Filling Fats Market, by End Use, 2023-2030 (Kilo Tons)
TABLE 315 Latin America Filling Fats Market, by Fat Content, 2017-2022 (US$ Mn)
TABLE 316 Latin America Filling Fats Market, by Fat Content, 2023-2030 (US$ Mn)
TABLE 317 Latin America Filling Fats Market, by Fat Content, 2017-2022 (Kilo Tons)
TABLE 318 Latin America Filling Fats Market, by Fat Content, 2023-2030 (Kilo Tons)
TABLE 319 Latin America Filling Fats Market, by Country, 2017-2022 (US$ Mn)
TABLE 320 Latin America Filling Fats Market, by Country, 2023-2030 (US$ Mn)
TABLE 321 Latin America Filling Fats Market, by Country, 2017-2022 (Kilo Tons)
TABLE 322 Latin America Filling Fats Market, by Country, 2023-2030 (Kilo Tons)
TABLE 323 Brazil Filling Fats Market, by Type, 2017-2022 (US$ Mn)
TABLE 324 Brazil Filling Fats Market, by Type, 2023-2030 (US$ Mn)
TABLE 325 Brazil Filling Fats Market, by Type, 2017-2022 (Kilo Tons)
TABLE 326 Brazil Filling Fats Market, by Type, 2023-2030 (Kilo Tons)
TABLE 327 Brazil Filling Fats Market, by End Use, 2017-2022 (US$ Mn)
TABLE 328 Brazil Filling Fats Market, by End Use, 2023-2030 (US$ Mn)
TABLE 329 Brazil Filling Fats Market, by End Use, 2017-2022 (Kilo Tons)
TABLE 330 Brazil Filling Fats Market, by End Use, 2023-2030 (Kilo Tons)
TABLE 331 Brazil Filling Fats Market, by Fat Content, 2017-2022 (US$ Mn)
TABLE 332 Brazil Filling Fats Market, by Fat Content, 2023-2030 (US$ Mn)
TABLE 333 Brazil Filling Fats Market, by Fat Content, 2017-2022 (Kilo Tons)
TABLE 334 Brazil Filling Fats Market, by Fat Content, 2023-2030 (Kilo Tons)
TABLE 335 Argentina Filling Fats Market, by Type, 2017-2022 (US$ Mn)
TABLE 336 Argentina Filling Fats Market, by Type, 2023-2030 (US$ Mn)
TABLE 337 Argentina Filling Fats Market, by Type, 2017-2022 (Kilo Tons)
TABLE 338 Argentina Filling Fats Market, by Type, 2023-2030 (Kilo Tons)
TABLE 339 Argentina Filling Fats Market, by End Use, 2017-2022 (US$ Mn)
TABLE 340 Argentina Filling Fats Market, by End Use, 2023-2030 (US$ Mn)
TABLE 341 Argentina Filling Fats Market, by End Use, 2017-2022 (Kilo Tons)
TABLE 342 Argentina Filling Fats Market, by End Use, 2023-2030 (Kilo Tons)
TABLE 343 Argentina Filling Fats Market, by Fat Content, 2017-2022 (US$ Mn)
TABLE 344 Argentina Filling Fats Market, by Fat Content, 2023-2030 (US$ Mn)
TABLE 345 Argentina Filling Fats Market, by Fat Content, 2017-2022 (Kilo Tons)
TABLE 346 Argentina Filling Fats Market, by Fat Content, 2023-2030 (Kilo Tons)
TABLE 347 Rest of Latin America Filling Fats Market, by Type, 2017-2022 (US$ Mn)
TABLE 348 Rest of Latin America Filling Fats Market, by Type, 2023-2030 (US$ Mn)
TABLE 349 Rest of Latin America Filling Fats Market, by Type, 2017-2022 (Kilo Tons)
TABLE 350 Rest of Latin America Filling Fats Market, by Type, 2023-2030 (Kilo Tons)
TABLE 351 Rest of Latin America Filling Fats Market, by End Use, 2017-2022 (US$ Mn)
TABLE 352 Rest of Latin America Filling Fats Market, by End Use, 2023-2030 (US$ Mn)
TABLE 353 Rest of Latin America Filling Fats Market, by End Use, 2017-2022 (Kilo Tons)
TABLE 354 Rest of Latin America Filling Fats Market, by End Use, 2023-2030 (Kilo Tons)
TABLE 355 Rest of Latin America Filling Fats Market, by Fat Content, 2017-2022 (US$ Mn)
TABLE 356 Rest of Latin America Filling Fats Market, by Fat Content, 2023-2030 (US$ Mn)
TABLE 357 Rest of Latin America Filling Fats Market, by Fat Content, 2017-2022 (Kilo Tons)
TABLE 358 Rest of Latin America Filling Fats Market, by Fat Content, 2023-2030 (Kilo Tons)
TABLE 359 Middle East and Africa Filling Fats Market, by Type, 2017-2022 (US$ Mn)
TABLE 360 Middle East and Africa Filling Fats Market, by Type, 2023-2030 (US$ Mn)
TABLE 361 Middle East and Africa Filling Fats Market, by Type, 2017-2022 (Kilo Tons)
TABLE 362 Middle East and Africa Filling Fats Market, by Type, 2023-2030 (Kilo Tons)
TABLE 363 Middle East and Africa Filling Fats Market, by End Use, 2017-2022 (US$ Mn)
TABLE 364 Middle East and Africa Filling Fats Market, by End Use, 2023-2030 (US$ Mn)
TABLE 365 Middle East and Africa Filling Fats Market, by End Use, 2017-2022 (Kilo Tons)
TABLE 366 Middle East and Africa Filling Fats Market, by End Use, 2023-2030 (Kilo Tons)
TABLE 367 Middle East and Africa Filling Fats Market, by Fat Content, 2017-2022 (US$ Mn)
TABLE 368 Middle East and Africa Filling Fats Market, by Fat Content, 2023-2030 (US$ Mn)
TABLE 369 Middle East and Africa Filling Fats Market, by Fat Content, 2017-2022 (Kilo Tons)
TABLE 370 Middle East and Africa Filling Fats Market, by Fat Content, 2023-2030 (Kilo Tons)
TABLE 371 Middle East and Africa Filling Fats Market, by Country, 2017-2022 (US$ Mn)
TABLE 372 Middle East and Africa Filling Fats Market, by Country, 2023-2030 (US$ Mn)
TABLE 373 Middle East and Africa Filling Fats Market, by Country, 2017-2022 (Kilo Tons)
TABLE 374 Middle East and Africa Filling Fats Market, by Country, 2023-2030 (Kilo Tons)
TABLE 375 GCC Countries Filling Fats Market, by Type, 2017-2022 (US$ Mn)
TABLE 376 GCC Countries Filling Fats Market, by Type, 2023-2030 (US$ Mn)
TABLE 377 GCC Countries Filling Fats Market, by Type, 2017-2022 (Kilo Tons)
TABLE 378 GCC Countries Filling Fats Market, by Type, 2023-2030 (Kilo Tons)
TABLE 379 GCC Countries Filling Fats Market, by End Use, 2017-2022 (US$ Mn)
TABLE 380 GCC Countries Filling Fats Market, by End Use, 2023-2030 (US$ Mn)
TABLE 381 GCC Countries Filling Fats Market, by End Use, 2017-2022 (Kilo Tons)
TABLE 382 GCC Countries Filling Fats Market, by End Use, 2023-2030 (Kilo Tons)
TABLE 383 GCC Countries Filling Fats Market, by Fat Content, 2017-2022 (US$ Mn)
TABLE 384 GCC Countries Filling Fats Market, by Fat Content, 2023-2030 (US$ Mn)
TABLE 385 GCC Countries Filling Fats Market, by Fat Content, 2017-2022 (Kilo Tons)
TABLE 386 GCC Countries Filling Fats Market, by Fat Content, 2023-2030 (Kilo Tons)
TABLE 387 South Africa Filling Fats Market, by Type, 2017-2022 (US$ Mn)
TABLE 388 South Africa Filling Fats Market, by Type, 2023-2030 (US$ Mn)
TABLE 389 South Africa Filling Fats Market, by Type, 2017-2022 (Kilo Tons)
TABLE 390 South Africa Filling Fats Market, by Type, 2023-2030 (Kilo Tons)
TABLE 391 South Africa Filling Fats Market, by End Use, 2017-2022 (US$ Mn)
TABLE 392 South Africa Filling Fats Market, by End Use, 2023-2030 (US$ Mn)
TABLE 393 South Africa Filling Fats Market, by End Use, 2017-2022 (Kilo Tons)
TABLE 394 South Africa Filling Fats Market, by End Use, 2023-2030 (Kilo Tons)
TABLE 395 South Africa Filling Fats Market, by Fat Content, 2017-2022 (US$ Mn)
TABLE 396 South Africa Filling Fats Market, by Fat Content, 2023-2030 (US$ Mn)
TABLE 397 South Africa Filling Fats Market, by Fat Content, 2017-2022 (Kilo Tons)
TABLE 398 South Africa Filling Fats Market, by Fat Content, 2023-2030 (Kilo Tons)
TABLE 399 Rest of Middle East and Africa Filling Fats Market, by Type, 2017-2022 (US$ Mn)
TABLE 400 Rest of Middle East and Africa Filling Fats Market, by Type, 2023-2030 (US$ Mn)
TABLE 401 Rest of Middle East and Africa Filling Fats Market, by Type, 2017-2022 (Kilo Tons)
TABLE 402 Rest of Middle East and Africa Filling Fats Market, by Type, 2023-2030 (Kilo Tons)
TABLE 403 Rest of Middle East and Africa Filling Fats Market, by End Use, 2017-2022 (US$ Mn)
TABLE 404 Rest of Middle East and Africa Filling Fats Market, by End Use, 2023-2030 (US$ Mn)
TABLE 405 Rest of Middle East and Africa Filling Fats Market, by End Use, 2017-2022 (Kilo Tons)
TABLE 406 Rest of Middle East and Africa Filling Fats Market, by End Use, 2023-2030 (Kilo Tons)
TABLE 407 Rest of Middle East and Africa Filling Fats Market, by Fat Content, 2017-2022 (US$ Mn)
TABLE 408 Rest of Middle East and Africa Filling Fats Market, by Fat Content, 2023-2030 (US$ Mn)
TABLE 409 Rest of Middle East and Africa Filling Fats Market, by Fat Content, 2017-2022 (Kilo Tons)
TABLE 410 Rest of Middle East and Africa Filling Fats Market, by Fat Content, 2023-2030 (Kilo Tons)

Frequently Asked Questions

What is the present global market size of filling fats?

The global filling fats market was valued at USD 12.8 billion in 2022.

What is the expected global growth rate of the filling fats market between 2023 and 2030?

The filling fats market is predicted to expand at a CAGR of 4.20% between 2023 and 2030, reaching USD 17.07 billion in 2030.

Which segment is leading the market share in terms of type?

Lauric is the leading segment by type, holding over 58.7% share in terms of value in 2022.

Which end-user segment governs the demand for filling fats in the world?

The confectionery segment governs the demand for filling fats in the world, holding a massive share of over 35.9% in 2022.

Which fat content segment is expected to post the highest CAGR during the forecast period?

The low-fat segment is expected to post the highest CAGR during the forecast period.

Which region is fueling the growth of the filling fats industry?

Asia Pacific is fueling the growth of the filling fats industry, with an over one-third share in 2022.

Who are the notable market players in the global filling fats market?

The top players include Felda Iffo LLC, Wilmar International Ltd., Sime Darby Plantation Berhad, and Fuji Oil Europe NV. Other major players include Loders Croklaan B.V., Mewah International Group, Manorama Industries Private Limited, and Bunge.

What are the leading market drivers of the filling fats industry?

Filling fats and oils are in high demand in the food and beverage industries due to their unique features, which include high stability, texture enhancement, and flavor enhancement.

What are the major market restraints of the filling fats industry?

The market growth needs to be improved by difficulties such as fluctuating raw material prices, tight regulations, and tough competition.

What are the major market opportunities of the filling fats industry?

The huge demand for natural cosmetic products and increased demand for low-fat products are the major opportunities in the filling fats industry.

Natural Flavors Market

Published:
Report ID: 14378

Oat Milk Market

Published:
Report ID: 37052

Processed Meat Market

Published:
Report ID: 11443

Dill Juice Market

Published:
Report ID: 5087

Edible Oils Market

Published:
Report ID: 4775

Dehydrated Food Market

Published:
Report ID: 4904

Argan Oil Market

Published:
Report ID: 1674

India Pet Food Market

Published:
Report ID: 36785

Amla Extracts Market

Published:
Report ID: 12475

Fermented Beverages Market

Published:
Report ID: 6227

Dairy Ingredients Market

Published:
Report ID: 4463

Food & Beverage Vending Machines Market

Published:
Report ID: 5489

Purchase Options

$2999
Delivery Format: Excel.
$4999
Designed for the individual purchaser.
$6999
Users located at a single corporate site or regional office.
$7999
Allowed for unlimited sharing globally within one company.
Smallform of Sample request

Have a question?

User Profile

Don’t settle for less – trust Mitul to help you find the best solution.

Report delivery within 24 to 48 hours

– Other Info –

What people say?-

User Review

I am very impressed with the information in this report. The author clearly did their research when they came up with this product and it has already given me a lot of ideas.

Jana Schmidt
CEDAR CX Technologies

– Connect with us –

Phone

+91 6232 49 3207


support

24/7 Research Support


sales@credenceresearch.com

– Research Methodology –

Going beyond the basics: advanced techniques in research methodology

– Trusted By –

Pepshi, LG, Nestle
Motorola, Honeywell, Johnson and johnson
LG Chem, SIEMENS, Pfizer
Unilever, Samsonite, QIAGEN