
FinFET value peaks with 3 nm as nanosheets take the lead
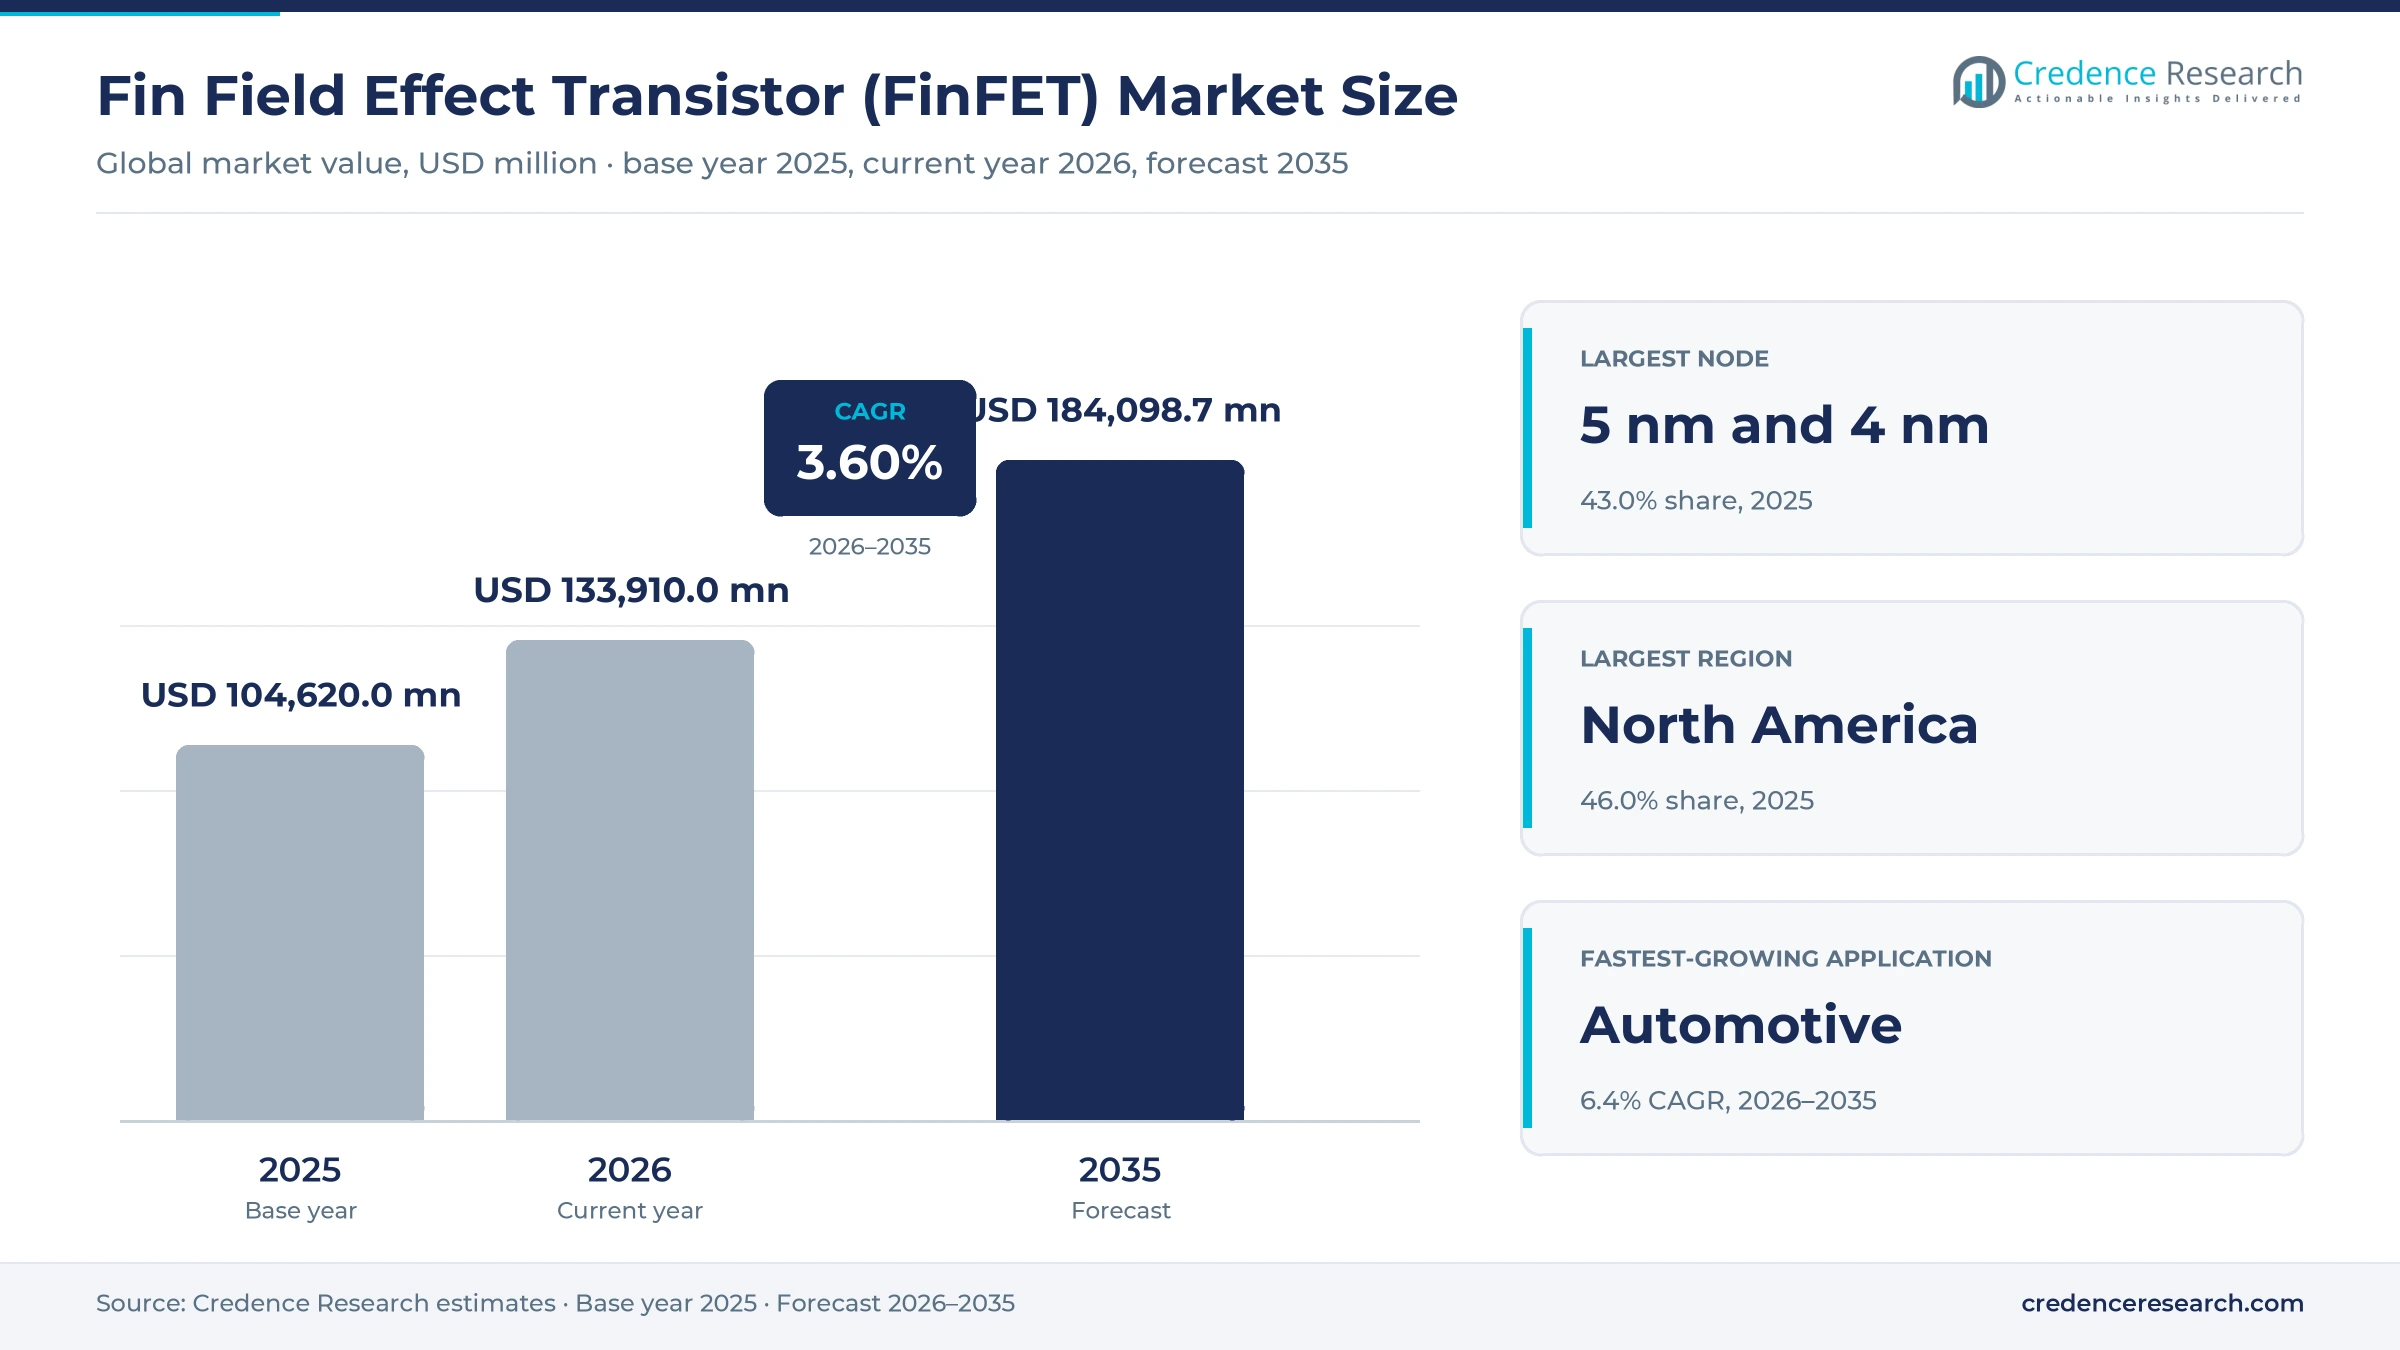
The global fin field effect transistor (FinFET) market was valued at USD 104.62 billion in 2025 and is projected to increase from USD 133.91 billion in 2026 to USD 184.10 billion by 2035, registering a CAGR of 3.60% during 2026–2035. Demand comes from AI accelerators, server processors, flagship smartphone chips and a growing set of automotive computers that still use FinFET nodes from 22 nm down to 3 nm. North America held the largest regional share, 46.0% in 2025, because hyperscale data centers there deploy the largest FinFET-made processors. Middle East & Africa is the fastest-growing region at 5.2% a year as Gulf AI programs install accelerator clusters from a small base. The main technology change is the move of the leading edge to gate-all-around nanosheet transistors at 2 nm, which caps FinFET growth once the 3 nm cycle peaks. Older FinFET nodes keep their value because automotive, networking and mid-range chip designs are still migrating from planar 28 nm processes.
Why do FinFET nodes still carry most leading-edge wafer value?
The market counts the value of logic wafers processed on FinFET nodes, from the 22 nm class through 3 nm, by pure-play foundries and integrated device manufacturers. Captive output, such as Intel processors made in Intel fabs, is valued at equivalent wafer prices so that foundry and in-house production compare on one basis. FinFET is the field-effect transistor architecture that replaced planar designs at 22 nm to 16 nm, because a vertical fin wrapped by the gate on three sides limits leakage at short gate lengths. Chip designers such as Apple, NVIDIA, Qualcomm, MediaTek, AMD and Broadcom are the buyers, and they pay per processed wafer.
Packaging, test, mask sets and design services sit outside the market, as do chips made on 2 nm class gate-all-around nodes and on planar or FD-SOI processes. Node maturity sets the economics of every FinFET generation in this market. A new node carries high prices and scarce capacity for two to three years, then becomes a long-lived workhorse as second-tier designs arrive. That pattern now applies to 3 nm, which is moving from flagship status toward a high-volume node for accelerators and premium phones.
Fin Field Effect Transistor (FinFET) Market Insights
- The fin field effect transistor (FinFET) market reaches USD 184.10 billion by 2035 from USD 104.62 billion in 2025, with growth slowing to 3.60% a year as nanosheets take over.
- North America held 46.0% of 2025 value, because AI data centers there deploy the largest FinFET-made accelerators and server processors.
- 5 nm and 4 nm led with 43.0% of 2025 value, since two generations of AI accelerators and flagship phone chips were designed on them.
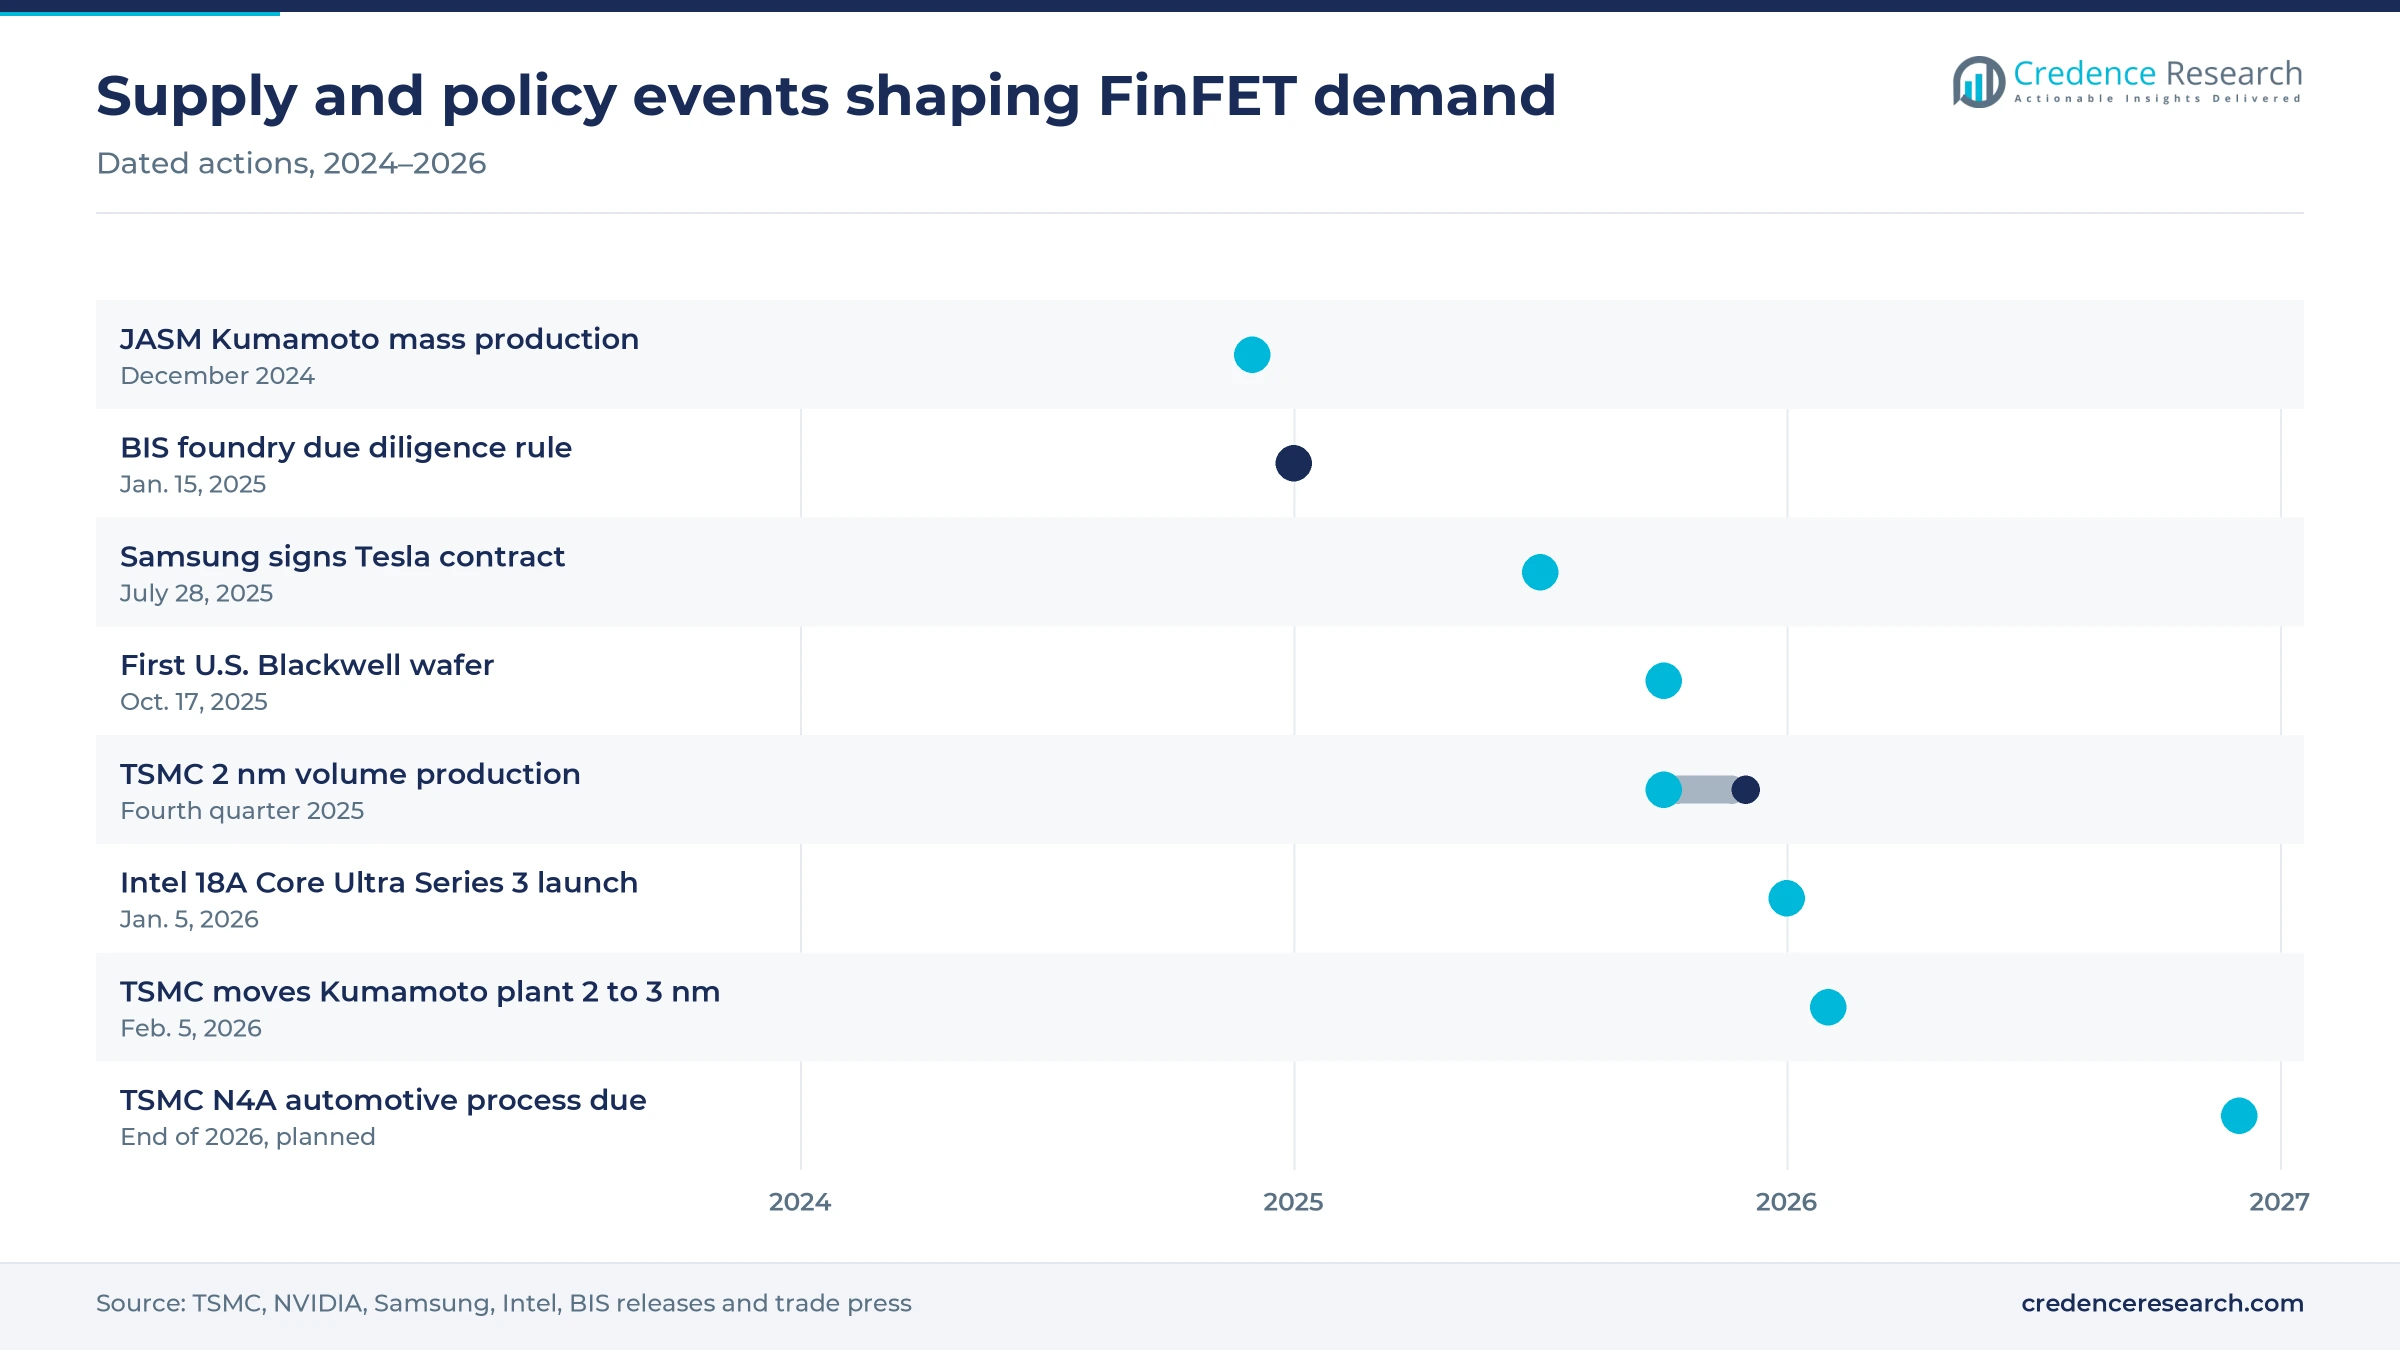
- TSMC reported that 2 nm nanosheet wafers reached 8% of its wafer revenue in the third quarter of 2026, about a year after volume production began.
- Pure-play foundries hold most FinFET capacity, while Intel and Samsung have moved their own leading products to gate-all-around nodes.
Leading FinFET nodes and AI chips hold most wafer value
Why do 5 nm and 4 nm lead while 3 nm grows fastest?
Based on technology node, the market is categorized into 3 nm, 5 nm and 4 nm, 10 nm to 6 nm and 22 nm to 12 nm. 5 nm and 4 nm led with 43.0% of 2025 value because these nodes combine mature yields with enough density for accelerators and premium phone chips. In the fourth quarter of 2025, 5 nm made up 35% of TSMC wafer revenue, the company said. 3 nm grows fastest at 6.6% a year as flagship designs move up a node, lifting its TSMC share from 18% in 2024 to 24% in 2025, Tom's Hardware reported. Suppliers holding 3 nm capacity gain most from this shift.
Data center chips lead while automotive compute grows fastest
Based on application, the market is categorized into data center and AI computing, smartphones, computers and tablets, automotive and wearables, IoT and other products. Data Center and AI Computing led with 42.0% of 2025 value because accelerators and server processors use the largest dies on the costliest FinFET nodes. Manufacturing Dive reported in January 2026 that high-performance computing reached 58% of TSMC 2025 revenue, up from 51% in 2024, while smartphones fell to 29%. Automotive grows fastest at 6.4% a year as central vehicle computers move onto FinFET processes, and TSMC lists N5A automotive products in volume production since 2025. Long qualification cycles mean that design wins made now hold wafer demand into the 2030s.
Why do pure-play foundries hold most FinFET output?
Based on business model, the market is categorized into pure-play foundries and integrated device manufacturers. Pure-Play Foundries led with 84.0% of 2025 value because TSMC makes most of the FinFET wafers bought by fabless designers. Pure-Play Foundries also grow fastest, at 3.9% a year, since integrated device manufacturers are moving their own leading products off FinFET. Intel launched Core Ultra Series 3 processors on its 18A gate-all-around process in January 2026, SiliconANGLE reported, and Samsung builds its Exynos 2600 phone chip on a 2 nm gate-all-around process. Their remaining FinFET lines serve older products and a smaller pool of outside customers.
| Segment Group | Leading Sub-segment | Share, 2025 | Fastest-growing Sub-segment | CAGR, 2026–2035 |
|---|---|---|---|---|
| By Technology Node | 5 nm and 4 nm | 43.0% | 3 nm | 6.6% |
| By Application | Data Center and AI Computing | 42.0% | Automotive | 6.4% |
| By Business Model | Pure-Play Foundries | 84.0% | Pure-Play Foundries | 3.9% |
FinFET wafer prices rise with each node and keep climbing
Foundries charge per processed wafer, and each FinFET generation has launched at a higher price than the one before. Extreme ultraviolet layers, more process steps and longer cycle times raise the cost of every start, so a 3 nm wafer costs about three times a 10 nm wafer at launch. Older FinFET nodes have not fallen in price the way planar nodes once did. Tom's Hardware reported in June 2026 that TSMC told customers all advanced nodes would cost more, with increases mostly between 5% and 10%. The quoted prices are unconfirmed by TSMC, and large contracts can settle lower. Mid-range phone and consumer chip vendors are the most exposed, while AI accelerator buyers absorb the increases.
| Node or offer | Typical price or fee | Basis |
|---|---|---|
| 3 nm wafer (300 mm) | About USD 18,000 per wafer | Press report, January 2025, unconfirmed by TSMC |
| 5 nm wafer (300 mm) | About USD 16,000 per wafer at launch | Press report, November 2022, unconfirmed by TSMC |
| 7 nm wafer (300 mm) | About USD 10,000 per wafer at launch | Press report, November 2022, unconfirmed by TSMC |
| 10 nm wafer (300 mm) | About USD 6,000 per wafer at launch | Press report, November 2022, unconfirmed by TSMC |
| 28 nm planar wafer, about 2013 | About USD 5,000 per wafer | Press report, January 2025, unconfirmed by TSMC |
| TSMC advanced-node price change, 2026 | Mostly 5% to 10% | Press report, June 2026 |
Request a Free Sample
Fill in your details and we'll send you a free sample report.
- Sample data tables & charts
- Research methodology
AI chips, pricing and car compute sustain FinFET demand
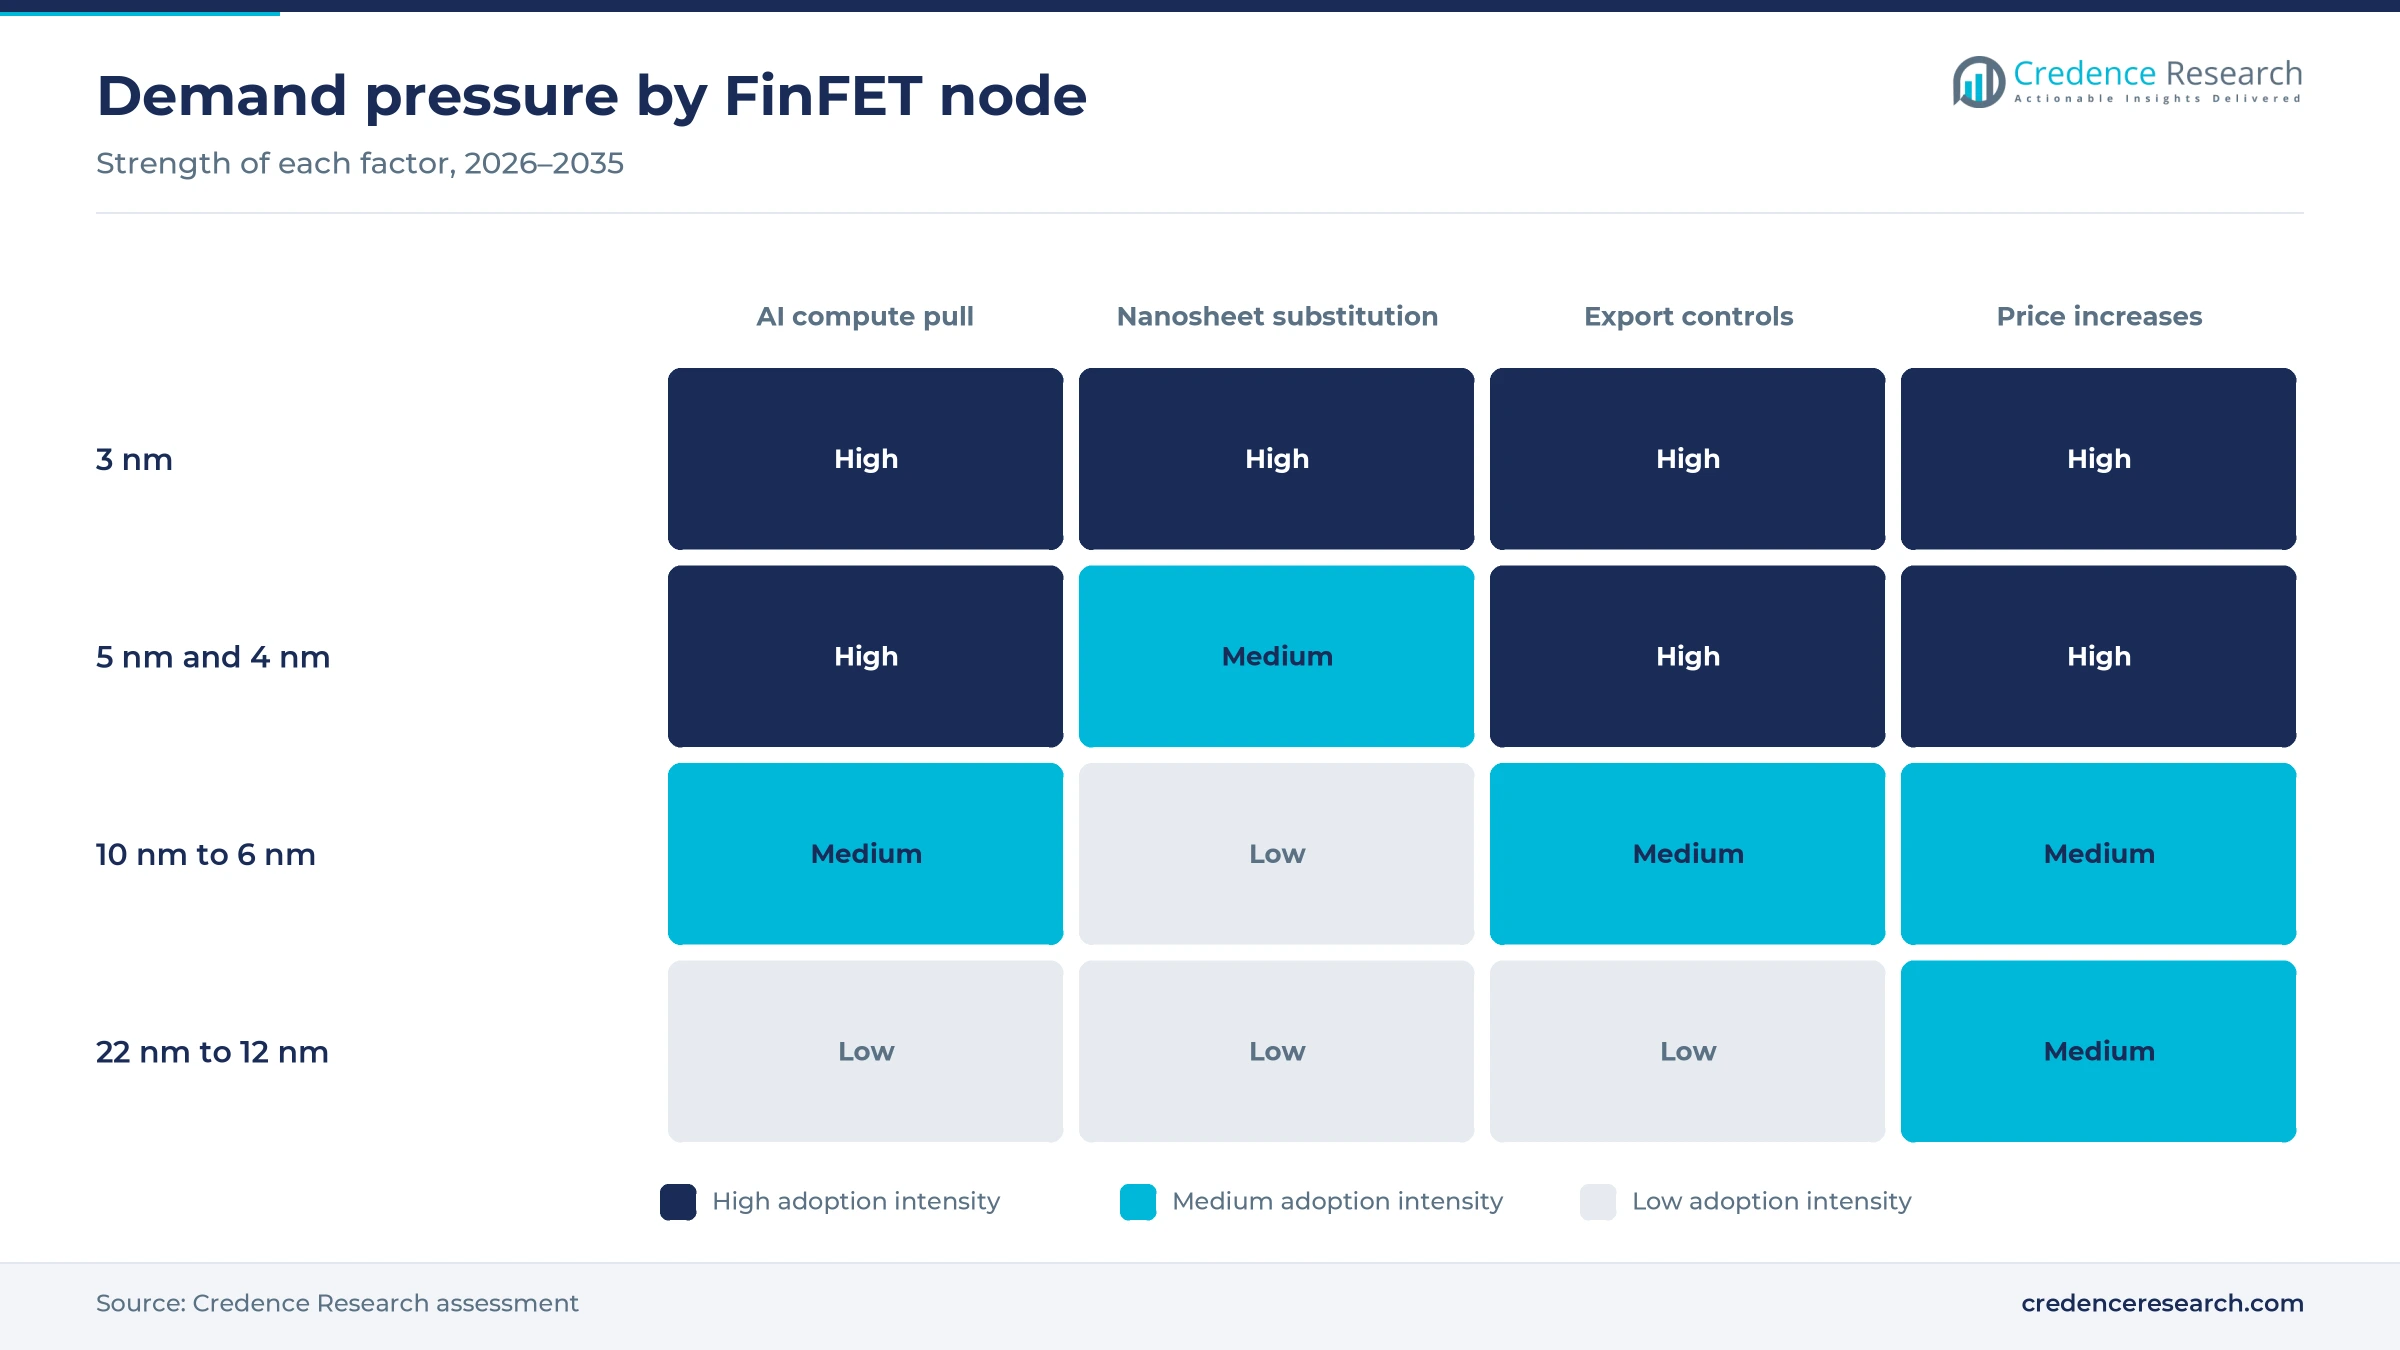
AI accelerator buildouts keep 3 nm and 5 nm lines full
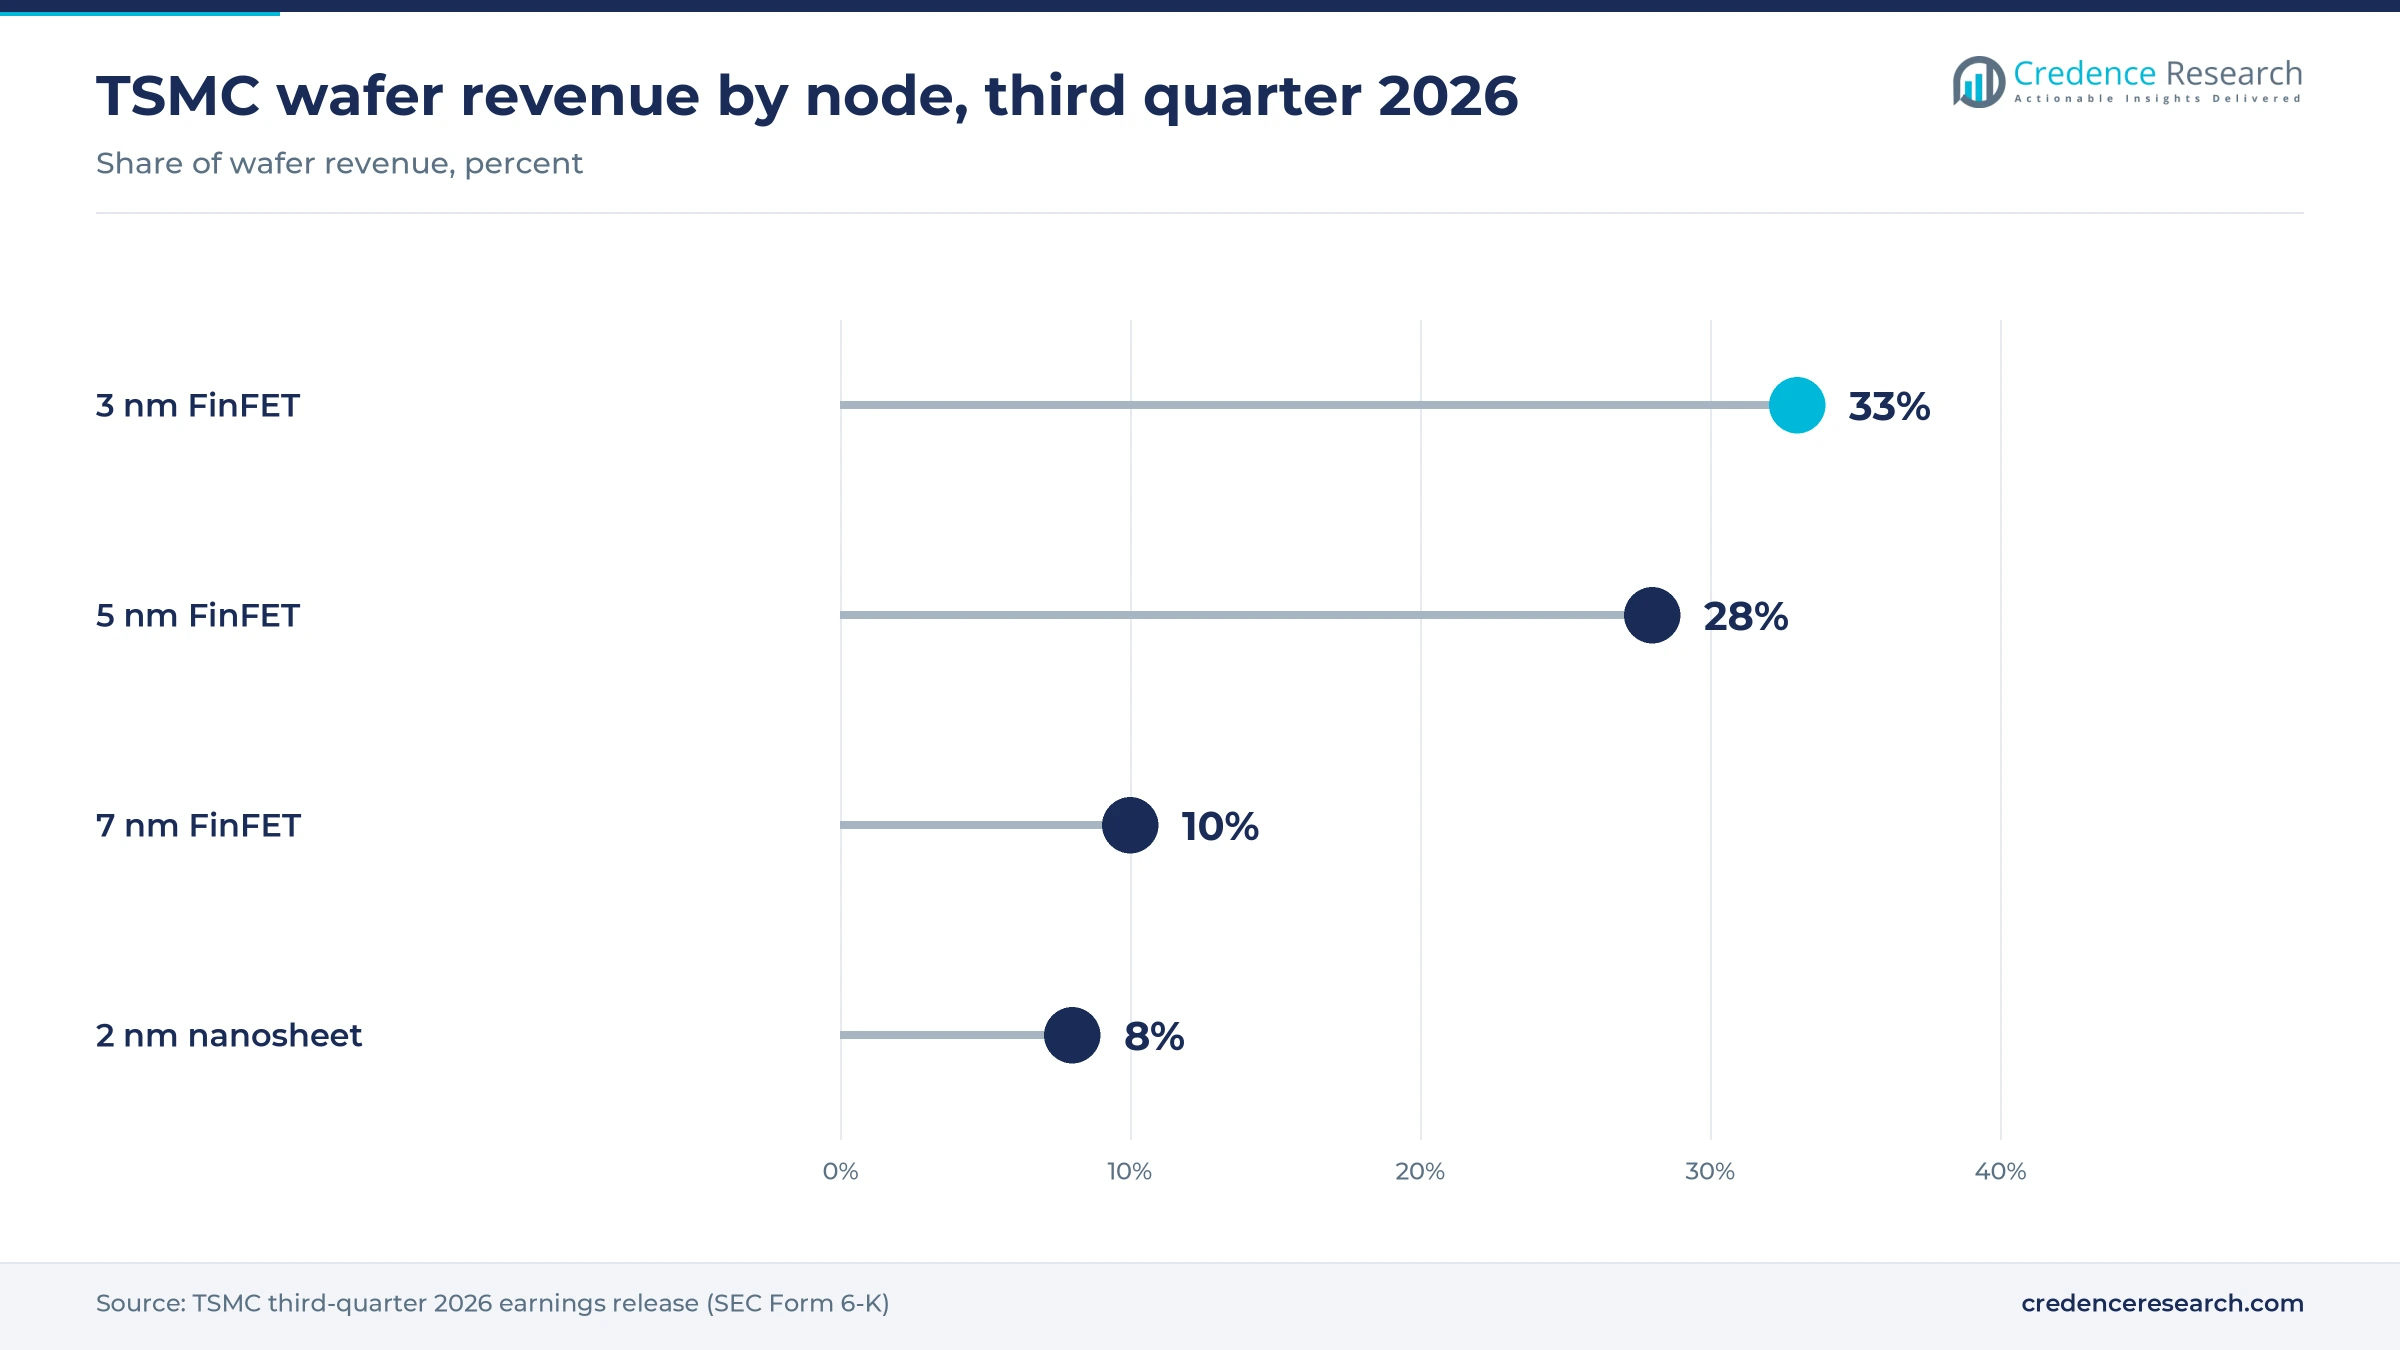
AI accelerators and the server processors around them are the largest source of new FinFET wafer demand, and most still use 4 nm and 3 nm processes. In its third-quarter 2026 earnings release, TSMC said 3 nm and 5 nm together made up 61% of its wafer revenue. NVIDIA said on Oct. 17, 2025, that the first Blackwell wafer made in the United States had come off the TSMC line in Phoenix and that Blackwell had reached volume production. When it reported fourth-quarter 2025 results in January 2026, TSMC set its 2026 capital budget at USD 52 billion to USD 56 billion. Suppliers with 3 nm and 4 nm capacity gain pricing power, while designers of custom AI accelerators must reserve capacity years ahead.
Rising wafer prices lift value per FinFET start
Market value is rising faster than wafer volume because each FinFET node carries a higher price than the one before, and older nodes now hold their prices. Tom's Hardware reported in December 2025 that TSMC's average wafer selling price rose 15.9% a year from 2019 to 2025, after staying nearly flat from 2005 to 2019. TSMC said in its January 2026 earnings release that 7 nm and more advanced nodes made up 77% of its fourth-quarter 2025 wafer revenue. That mix shift toward costlier starts supports 5 nm and 4 nm, which held 43.0% of 2025 value. Chip designers face higher bills even when unit volume is flat, while foundries with node leadership widen their margins.
Vehicle compute moves onto automotive-grade FinFET processes
Automakers are merging driver assistance, cockpit and gateway functions into central computers, and those chips need FinFET density to stay within power budgets. TSMC states on its automotive platform page that N7A products entered volume production for carmakers in 2023 and N5A products in 2025, while its N3A design kit reached version 1.0 in 2025 and N4A is due by the end of 2026. Automotive is the fastest-growing application at 6.4% a year, because each new vehicle platform needs several FinFET processors for vision, cockpit and zone control. Each qualified automotive node extends the commercial life of a FinFET process, and designers of autonomous-driving processors gain a ready migration path.
Government programs add FinFET capacity outside Taiwan
Industrial policy in the United States, Japan and Europe is paying for FinFET capacity close to chip buyers, which lowers supply risk for automakers and cloud operators. TSMC has committed USD 165 billion to Arizona and expects high-volume output at its second fab there in the second half of 2027, Manufacturing Dive reported in January 2026. JASM, the TSMC joint venture in Japan, began mass production in Kumamoto in late December 2024. In Germany, EU-approved state aid of EUR 5 billion supports ESMC, which will make 28/22 nm and 16/12 nm chips with FinFET technology and reach full capacity by 2029. Local fabs cost more to run, so buyers trade higher wafer prices for supply security.
Nanosheets and Chinese scaling reshape FinFET supply
Leading-edge designs shift to gate-all-around nanosheets at 2 nm
Foundries and integrated manufacturers are shifting their newest nodes to gate-all-around nanosheet transistors, which ends the FinFET run at the leading edge. TSMC began volume production of 2 nm in the fourth quarter of 2025, Focus Taiwan reported, and 2 nm reached 8% of TSMC wafer revenue by the third quarter of 2026. NVIDIA said the TSMC Arizona site will make 2 nm and A16 chips alongside 4 nm and 3 nm parts, so nanosheet supply will follow FinFET into new regions. The shift moves flagship demand away from 3 nm from 2026, which is the main reason the forecast CAGR sits far below the 2026 jump. Buyers comparing nanosheet-based designs with FinFET weigh higher wafer prices against better power efficiency.
China is rising on FinFET scaling without extreme ultraviolet tools
Chinese foundries are extending FinFET scaling with deep ultraviolet multi-patterning because they cannot buy extreme ultraviolet scanners. Huawei's Kirin 9030 for Mate 80 phones is built on the SMIC N+3 process, which sits between 7 nm and 5 nm and relies on DUV patterning, a December 2025 teardown showed. SMIC reportedly runs about 20,000 wafers a month of 7 nm class capacity, mostly for Huawei. Chinese demand now forms a closed loop inside Asia Pacific, a region that held 40.0% of 2025 value. Foundries outside China lose those designs, while SMIC gains a captive customer base at a higher cost per good die.
Opportunity in freed 3 nm capacity for second-wave AI chips
As flagship designs move to 2 nm, 3 nm capacity opens for inference accelerators, networking chips and mid-range processors that could not secure it during the AI build-out. 3 nm is the fastest-growing node at 6.6% a year, and it already made up 33% of TSMC wafer revenue in the third quarter of 2026. The second Arizona fab noted above adds 3 nm-generation supply for U.S. buyers once it ramps. A depreciating node lowers cost per wafer while list prices hold, which widens foundry margins and gives buyers room to negotiate volume terms. Second-tier AI chip developers and networking vendors gain the most from this earlier access.
Opportunity in 12 nm and 16 nm for networking and industrial chips
Designers of networking, industrial and Wi-Fi chips still on planar 28 nm form the largest pool of designs that can move to FinFET over the next decade. Mature FinFET lines are largely depreciated, so foundries can price them for volume rather than node leadership. Intel and UMC announced on Jan. 25, 2024, a jointly developed 12 nm FinFET platform for production at Intel's Arizona fabs from 2027, aimed at mobile, communication infrastructure and networking. Mature FinFET wafers cost a fraction of a 5 nm start, as the pricing table shows, which lets designers leave planar 28 nm without leading-edge budgets. Europe, where automotive and industrial designers lead this migration, grows at 3.8% a year. Fabless firms that need Western supply at moderate cost gain the most.
Substitution, export rules and fab costs limit growth
Nanosheet nodes pull flagship orders away from FinFET
Substitution is the main restraint, because the largest buyers are committing their next designs to gate-all-around nodes. Samsung announced a USD 16.5 billion contract with Tesla on July 28, 2025, running to Dec. 31, 2033, for AI chips from its Taylor, Texas fab. Each such award removes future flagship volume from 3 nm and 5 nm. Integrated manufacturers with FinFET-heavy fabs are the most exposed, since they must convert lines or fill them with lower-priced mature work.
Export controls narrow the customer base for advanced FinFET
U.S. export controls limit which customers can buy advanced FinFET wafers and add compliance costs for every foundry. The foundry due diligence rule issued on Jan. 15, 2025, requires foundries and packaging houses to confirm approved designers or verify transistor counts before releasing certain advanced chips. Foundries outside China lose some Chinese designers, while those designers move to SMIC at lower yields. Smaller fabless firms carry the heaviest compliance burden relative to the size of their orders.
Overseas fab delays raise the cost of local FinFET supply
Building FinFET capacity outside Taiwan costs more and takes longer, which raises wafer prices for buyers that want local supply. TSMC said on Feb. 5, 2026, that its second Kumamoto plant, still under construction, will make 3 nm chips instead of the 7 nm and 6 nm class output first planned, Focus Taiwan reported, which raises the cost of the plant and leaves its start date unconfirmed. Japanese automakers and industrial firms counting on that supply are the most exposed, and the foundry carries construction and labor costs before any revenue arrives.
Rising wafer costs squeeze consumer chip designers
Wafer cost inflation is a restraint for designers that sell into price-sensitive devices. A 3 nm wafer cost about USD 18,000 in early 2025 against about USD 5,000 for a 28 nm wafer roughly a decade earlier, as the pricing table shows. Mid-range phone, tablet and consumer chip vendors cannot pass such costs on as easily as AI accelerator buyers can. Many of them keep designs on 6 nm or 12 nm for longer, which slows migration to the newest FinFET nodes.
Data center regions lead while Gulf AI demand grows
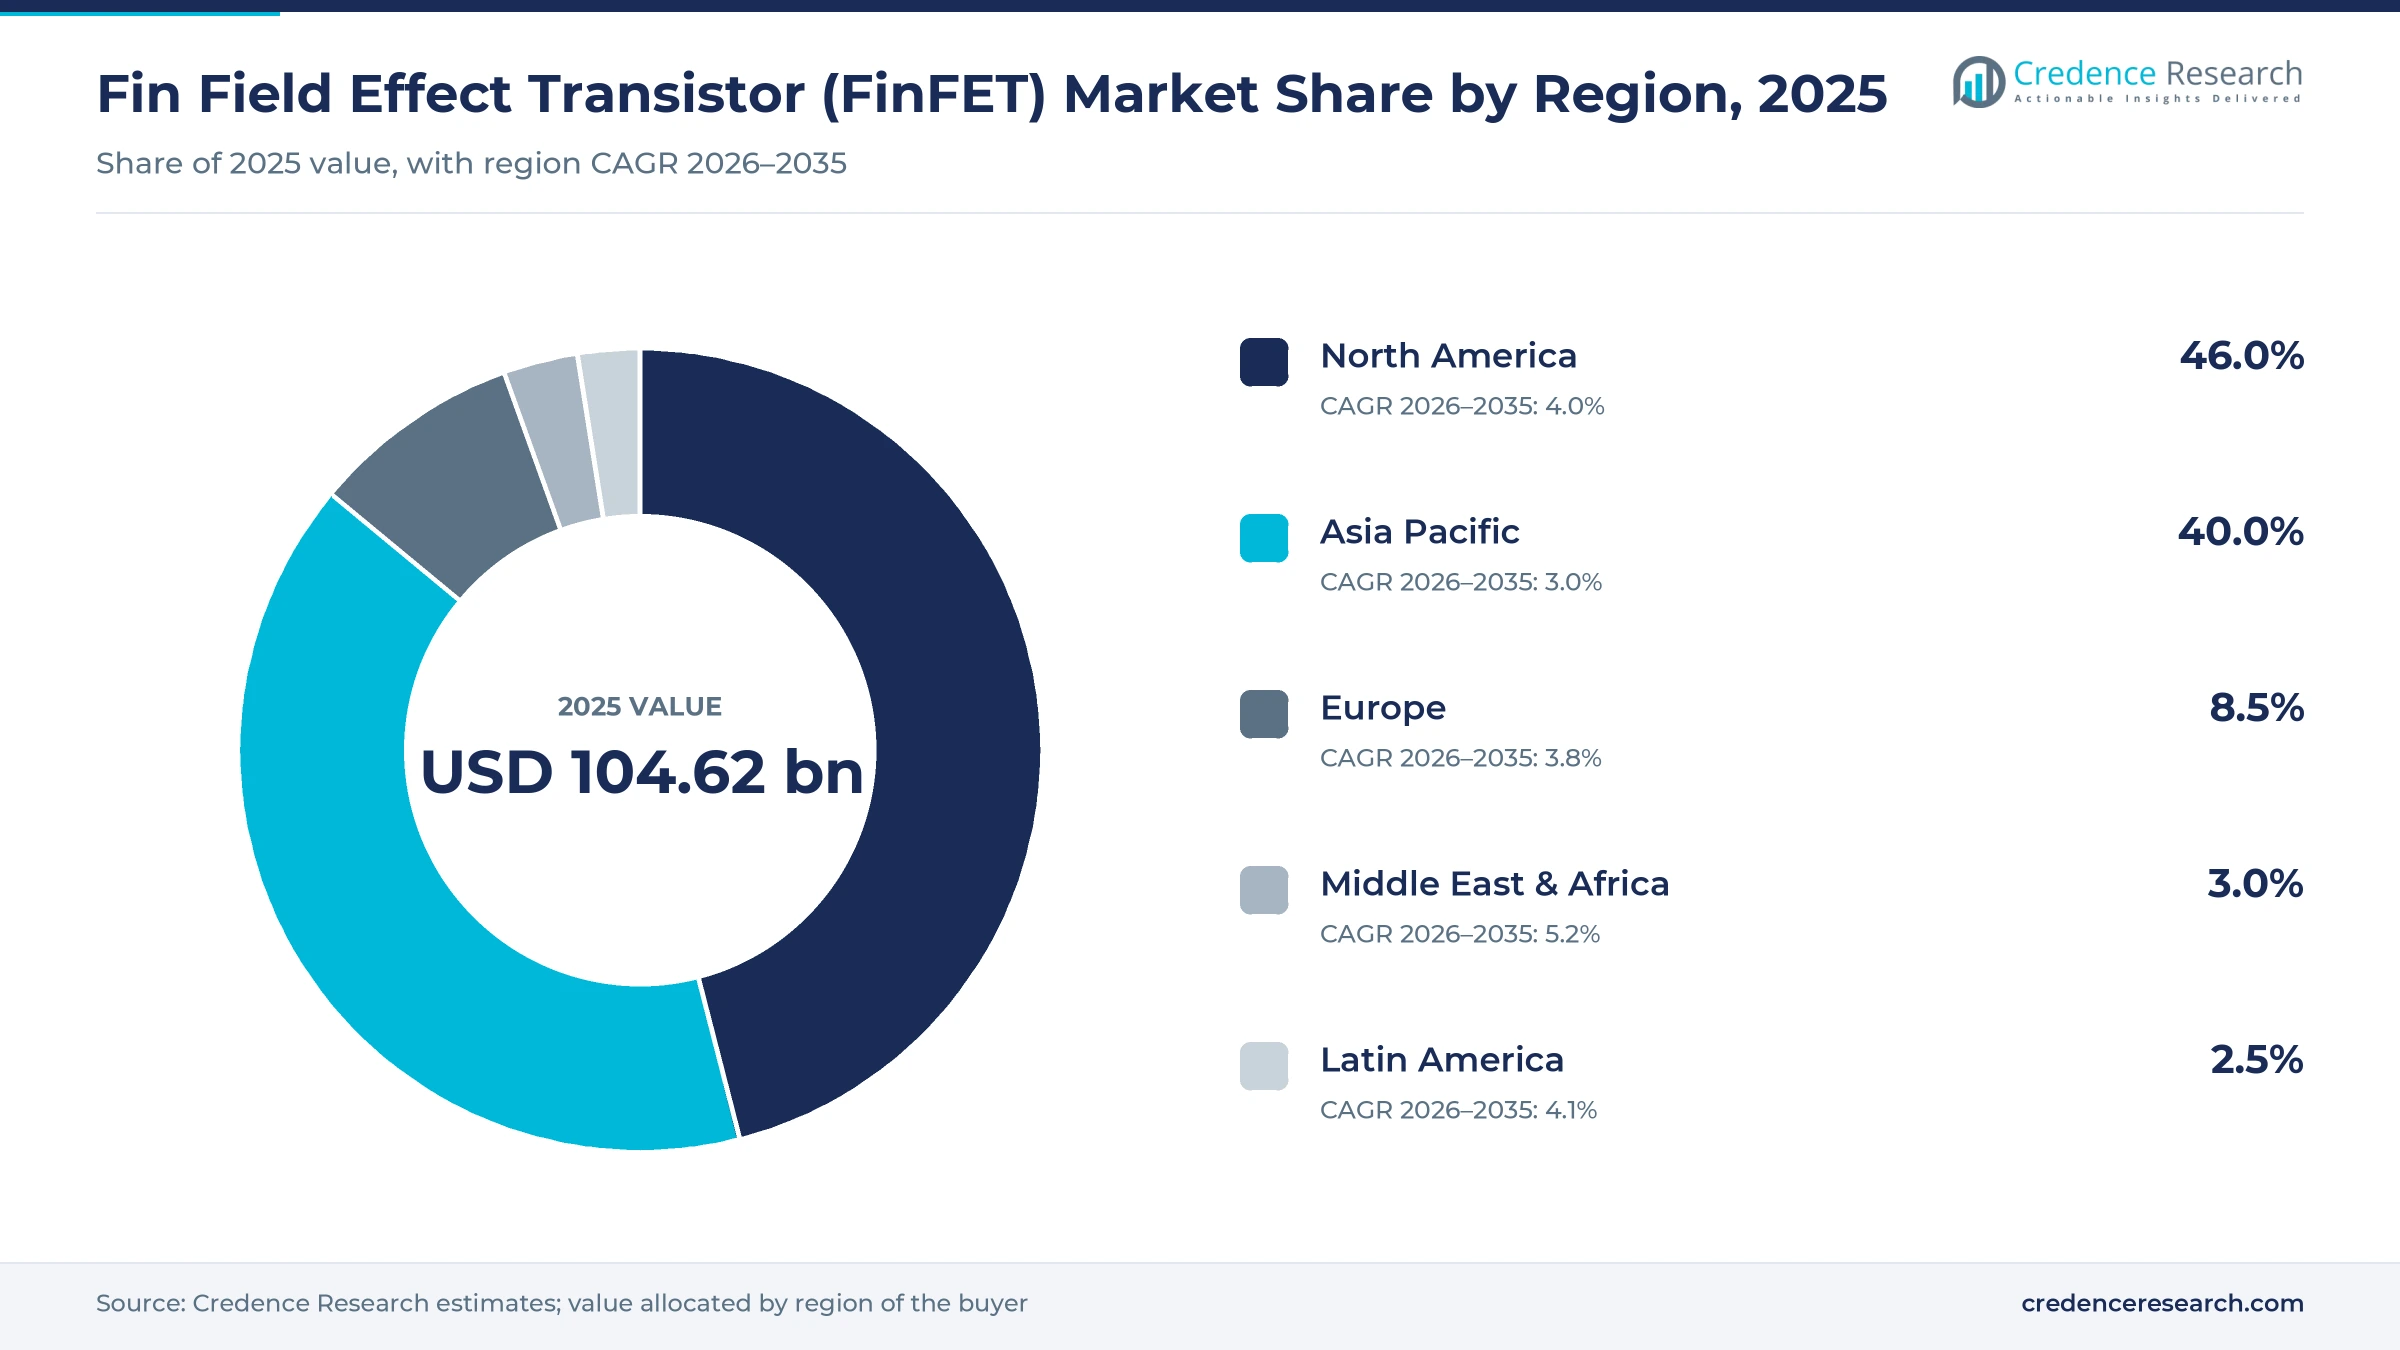
Regional shares are Credence Research estimates that assign wafer value to the region where FinFET-made chips are deployed in data centers, devices and vehicles. Growth is fastest where new AI data center capacity is being built from a small base.
| Region | Value, 2025 (USD billion) | Share, 2025 | CAGR, 2026–2035 |
|---|---|---|---|
| North America | 48.13 | 46.0% | 4.0% |
| Asia Pacific | 41.85 | 40.0% | 3.0% |
| Europe | 8.89 | 8.5% | 3.8% |
| Middle East & Africa | 3.14 | 3.0% | 5.2% |
| Latin America | 2.62 | 2.5% | 4.1% |
North America leads on AI data center deployments
North America held 46.0% of 2025 value and grows at 4.0% a year, because U.S. cloud operators deploy most of the accelerators and server processors made on 4 nm and 3 nm FinFET nodes. The largest buyers of those wafers, including NVIDIA, Apple, Qualcomm, AMD and Broadcom, are also based in the United States. Intel said in June 2024 that its Intel 3 process had entered high-volume production in Oregon and Ireland for Xeon 6 server processors. Domestic supply from Intel and the Arizona fabs noted above shortens lead times for U.S. buyers.
Asia Pacific relies on device assembly and Chinese self-supply
Asia Pacific held 40.0% of 2025 value and grows at 3.0% a year. Asia Pacific buyers deploy the largest pool of FinFET-made phone processors, led by China and India, while Taiwan, South Korea and Japan host most FinFET fabs. Chinese demand is splitting into a separate supply chain, as the Huawei move to SMIC N+3 shows. Japan is adding capacity through JASM, whose second Kumamoto fab is now planned for 3 nm output, TSMC said in February 2026. Slower growth reflects export limits on Chinese buyers and the early move of flagship phone chips to 2 nm.
Europe gains from automotive and industrial migration
Europe held 8.5% of 2025 value and grows at 3.8% a year. Demand comes from automotive and industrial chipmakers such as Bosch, Infineon and NXP, the three partners in the ESMC joint venture with TSMC in Dresden. The ESMC 16/12 nm line, backed by the German aid noted above, gives these buyers a local FinFET source before the end of the decade. Intel's Ireland fab, one of its two Intel 3 production sites, gives the region a FinFET fab of its own. European designers buy few leading-edge wafers, so the region gains most from the 22 nm to 12 nm migration.
Middle East & Africa grows fastest on Gulf AI factories
Middle East & Africa held 3.0% of 2025 value and grows fastest at 5.2% a year from a small base. Gulf states are buying AI accelerators at national scale for sovereign data centers. HUMAIN agreed with NVIDIA in May 2025 to build AI factories in Saudi Arabia of up to 500 megawatts, starting with an 18,000-chip GB300 system, according to NVIDIA. The region has no FinFET fab, so its growth depends on U.S. export approvals and on the pace of data center construction.
Latin America depends on imported processors and cloud regions
Latin America held 2.5% of 2025 value and grows at 4.1% a year. The region has no FinFET fab and relies on imported processors. Regional value follows phones, PCs and cloud servers bought by Latin American consumers and data center operators, so growth tracks device upgrades and new cloud regions rather than local chipmaking.
Production milestones and orders defined 2025 and 2026
| Development | Status and market relevance |
|---|---|
| In October 2025, NVIDIA and TSMC marked the first NVIDIA Blackwell wafer produced at the TSMC fab in Phoenix, Arizona. | Production milestone; 4 nm class FinFET output for AI accelerators now runs in the United States |
| In July 2025, Samsung Electronics signed a USD 16.5 billion foundry contract with Tesla running to Dec. 31, 2033, to be served from its Taylor, Texas fab. | Order; a large buyer commits future AI chip volume to gate-all-around-era capacity |
| In December 2025, a teardown showed that the Kirin 9030 in Huawei Mate 80 phones is made on the SMIC N+3 process, which sits between 7 nm and 5 nm. | Commercial product, teardown finding; confirms Chinese FinFET scaling without extreme ultraviolet tools |
| In December 2025, TSMC confirmed that volume production of its 2 nm process began in the fourth quarter of 2025. | Operational launch; starts the move of flagship designs from FinFET to nanosheets |
| In January 2026, Intel launched Core Ultra Series 3 processors, its first products on the 18A process with RibbonFET and PowerVia. | Launch; moves the Intel leading edge off FinFET onto gate-all-around transistors |
Fin geometry, patterning and car-grade flows set limits
- Three-sided gate control wraps the gate around a vertical silicon fin, which cuts leakage at short gate lengths and allowed FinFET to replace planar designs at 22 nm to 16 nm.
- Extreme ultraviolet patterning sets the cost and density of 7 nm to 3 nm FinFET nodes, because each EUV layer replaces several deep ultraviolet exposures.
- Deep ultraviolet multi-patterning lets SMIC push FinFET density toward 5 nm without EUV, at the price of more process steps and harder yield learning.
- Automotive-grade process variants add AEC-Q100 validation and long supply commitments to nodes such as N7A and N5A, which extends the commercial life of each FinFET node.
Need a Custom Version of This Report?
Tailor the scope, geography, or segments to your exact requirements.
- Custom geography or segment scope
- Direct access to our analyst team
One foundry supplies most FinFET wafers at every node
Competition in FinFET manufacturing turns on access to extreme ultraviolet tools, yield learning at each node and the design ecosystems that keep customers in place. TSMC supplies most FinFET wafers at 7 nm, 5 nm and 3 nm, and its lead widened in 2025 as rivals grew more slowly. Samsung Electronics competes through Samsung Foundry with 4 nm to 14 nm FinFET lines but has moved its newest work to gate-all-around nodes. Intel Corporation makes its own processors on Intel 7 and Intel 3 while Intel Foundry courts outside customers. SMIC is the only Chinese supplier at 7 nm class FinFET scale, serving Huawei and other domestic designers without EUV. GlobalFoundries and UMC compete at 12 nm and 14 nm, where long-life specialty designs value supply security and price over density. Capacity commitments, price and node roadmaps decide most contract awards.
Why does one foundry hold most FinFET output?
FinFET supply is concentrated because each new node needs extreme ultraviolet scanners, billions of dollars of fab capacity and years of yield learning. TSMC is the main source of 3 nm and 5 nm FinFET wafers for outside customers, which shows how demand in contract chipmaking gathers at the node leader. Samsung and Intel hold the second tier, SMIC serves China behind export controls, and GlobalFoundries and UMC stop at 12 nm and 14 nm. Margins sit with the leader at 3 nm and 5 nm, where buyers have few alternatives, while mature FinFET nodes are more contestable and priced on utilization.
Companies profiled and their roles in this market
| Company | Type | Role in the market |
|---|---|---|
| Taiwan Semiconductor Manufacturing Company (TSMC) | Pure-play foundry | Largest FinFET wafer supplier from 16 nm through 3 nm, including automotive-grade processes |
| Samsung Electronics (Samsung Foundry) | Integrated device maker and foundry | Makes 4 nm to 14 nm FinFET wafers for Exynos chips and outside customers |
| Intel Corporation (Intel Foundry) | Integrated device maker and foundry | Produces Xeon and Core processors on its Intel 7 and Intel 3 processes |
| Semiconductor Manufacturing International Corporation (SMIC) | Pure-play foundry | Supplies 14 nm and 7 nm class FinFET wafers to Chinese designers, including Huawei |
| GlobalFoundries | Specialty pure-play foundry | Runs 12 nm and 14 nm FinFET processes for AI, networking and consumer chips |
| United Microelectronics Corporation (UMC) | Pure-play foundry | Offers 14 nm FinFET and co-develops a 12 nm platform with Intel |
FinFET is turning into a long-lived workhorse node
Credence Research's view is that the fin field effect transistor (FinFET) market is moving from a growth technology to a long-lived workhorse. The 2026 peak reflects AI accelerators and flagship phones still built on 3 nm and 5 nm, but nanosheet nodes now take every new flagship design. Value after 2027 depends on how many second-wave designs move from planar 28 nm to 16 nm and 12 nm, and on whether 3 nm pricing holds as capacity frees up. Buyers should expect firm 3 nm prices until 2 nm yields mature, with more room to negotiate at 7 nm and 6 nm.
Wafer values built from node mix and wafer pricing
The report uses 2025 as the base year and forecasts 2026 to 2035. Market values come from the Credence Research model, which combines FinFET wafer output by node with prevailing wafer prices, using foundry node-mix disclosures, and values captive output at equivalent wafer prices. Node, application, business model and regional splits are Credence Research estimates, and regional shares follow where FinFET-made chips are deployed. Sources include company filings and releases, U.S. and European government documents and trade press. No interviews or surveys were conducted in preparing the estimates in this report.
FinFET demand plateaus as 3 nm matures after 2027
Growth in the fin field effect transistor (FinFET) market is expected to peak in 2026, after which the market expands slowly to USD 184.10 billion by 2035. Three nanometer becomes the main long-life node as flagship chips leave for nanosheet processes, while 16 nm and 12 nm gain designs from planar nodes. Automotive and Gulf data center demand add growth from small bases. The forecast assumes no major disruption to Taiwanese supply and gate-all-around yields that mature on current schedules. Faster nanosheet adoption would cut FinFET value sooner than the base case.
Nanosheet yields decide how long FinFET value holds
The range of outcomes depends mostly on how quickly nanosheet nodes absorb designs that now use 3 nm and 5 nm. Fast yield gains and falling 2 nm prices would move second-wave AI and phone chips off FinFET sooner. Slow gate-all-around yields, tight 2 nm capacity or export limits on new nodes would keep more designs on FinFET for longer. Migration from planar 28 nm puts a floor under demand in every case.
| Scenario | CAGR, 2026–2035 | Value, 2035 | What has to hold |
|---|---|---|---|
| Downside | 1.6% | USD 154.47 billion | Nanosheet yields mature fast and 2 nm prices fall, moving second-wave designs off 3 nm by 2029 |
| Base | 3.60% | USD 184.10 billion | 3 nm stays a high-volume node into the early 2030s while 12 nm gains planar designs |
| Upside | 6.1% | USD 228.17 billion | Gate-all-around capacity stays tight and automotive and edge AI chips adopt FinFET faster than planned |
Frequently Asked Questions
How big is the fin field effect transistor (FinFET) market?
Why does FinFET growth slow after 2026?
Which FinFET node holds the largest share?
How do 7 nm and 5 nm FinFET nodes compare in production economics?
Which region leads FinFET demand?
Which companies make FinFET wafers?
Is FinFET being replaced by gate-all-around transistors?
How does this market relate to the wider field effect transistor market?
Table of Content
Chapter 1 Market Segmentation
- 1.1 Segmentation Framework
- 1.1.1 Product and Service Classification
- 1.1.2 Application and End-Use Classification
- 1.1.3 Technology and Solution Classification
- 1.1.4 Customer and Distribution Channel Classification
- 1.1.5 Geographic Segmentation
- 1.1.6 Market Segment Definitions and Boundaries
- 1.2 By Technology Node
- 1.2.1 3 nm
- 1.2.2 5 nm and 4 nm
- 1.2.3 10 nm to 6 nm
- 1.2.4 22 nm to 12 nm
- 1.3 By Application
- 1.3.1 Data Center and AI Computing
- 1.3.2 Smartphones
- 1.3.3 Computers and Tablets
- 1.3.4 Automotive
- 1.3.5 Wearables, IoT and Other Products
- 1.4 By Business Model
- 1.4.1 Pure-Play Foundries
- 1.4.2 Integrated Device Manufacturers
Chapter 2 Introduction
- 2.1 Report Objectives and Scope
- 2.2 Product Definition and Industry Terminology
- 2.3 Market Inclusions and Exclusions
- 2.4 Research Process
- 2.4.1 Primary Research and Expert Interviews
- 2.4.2 Secondary Research and Source Review
- 2.4.3 Top-Down and Bottom-Up Estimation
- 2.4.4 Data Triangulation and Verification
- 2.5 Market Size Measurement Basis
- 2.5.1 2025: USD 104.62 billion → 2035: USD 184.10 billion
- 2.6 Historical and Forecast Reference Periods
- 2.6.1 Historical Period: 2018-2025
- 2.6.2 Base Year: 2025
- 2.6.3 Forecast Period: 2025-2035
- 2.7 Research Assumptions and Limitations
Chapter 3 Executive Summary
- 3.1 Market Snapshot and Key Findings
- 3.2 Base-Year Market Size, 2025
- 3.3 Forecast Market Size, 2035
- 3.4 Revenue and Volume Growth Outlook
- 3.5 Key Demand and Supply Indicators
- 3.6 Leading Market Segments
- 3.7 Fastest-Growing Market Opportunities
- 3.8 Regional Performance Highlights
- 3.9 Technology and Industry Transformation
- 3.10 Competitive Landscape Summary
- 3.11 Analyst View and Strategic Implications
Chapter 4 Global Fin Field Effect Transistor (FinFET) Market Trends and Developments
- 4.1 Historical Industry Development, 2018-2025
- 4.2 Recent Market Trends and Developments
- 4.3 Demand and Customer Behavior Trends
- 4.4 Technology and Product Innovation
- 4.5 Artificial Intelligence, Automation and Digitalization
- 4.6 Local Manufacturing and Supply Chain Realignment
- 4.7 Industry Partnerships, Mergers and Acquisitions
- 4.8 Sustainability and Circular Economy Developments
- 4.9 Government and Private Sector Investment Trends
- 4.10 Emerging Business Models and Commercialization
- 4.11 Industry Developments and Announcements
Chapter 5 Global Fin Field Effect Transistor (FinFET) Market Production, Supply and Demand Analysis
- 5.1 Demand Trend and Consumption Analysis, 2018-2025
- 5.2 Demand Forecast, 2025-2035
- 5.3 Production and Output Trend, 2018-2025
- 5.4 Production and Output Forecast, 2025-2035
- 5.5 Installed Capacity and Capacity Utilization
- 5.6 Company-Wise Production Plants and Statistics
- 5.6.1 Installed Production Capacity
- 5.6.2 Actual Production
- 5.6.3 Planned Capacity and Expansion Targets
- 5.7 Supply Chain Structure and Procurement Trends
- 5.8 Supply-Demand Gap and Bottlenecks
- 5.9 Import Dependence and Sourcing Structure
- 5.10 Contract Manufacturing and Outsourcing
- 5.11 Regional Supply and Demand Concentration
Chapter 6 Global Fin Field Effect Transistor (FinFET) Market Pricing Analysis
- 6.1 Pricing Structure and Measurement
- 6.2 Historical Pricing Trends, 2018-2025
- 6.3 Pricing Outlook, 2025-2035
- 6.4 Average Selling Price and Unit Economics
- 6.5 Pricing by Product and Market Segment
- 6.6 Geographic Pricing Differences
- 6.7 Key Input, Energy, Labor and Logistics Costs
- 6.8 Contract Pricing and Purchasing Models
- 6.9 Pricing Sensitivity and Competitive Positioning
- 6.10 Price, Margin and Profitability Implications
Chapter 7 Global Fin Field Effect Transistor (FinFET) Market Dynamics
- 7.1 Market Growth Drivers
- 7.1.1 Demand-Side Drivers
- 7.1.2 Technology and Innovation Drivers
- 7.1.3 Infrastructure and Investment Drivers
- 7.1.4 Regulatory and Policy Drivers
- 7.2 Market Restraints
- 7.2.1 Cost and Affordability Constraints
- 7.2.2 Technology and Adoption Barriers
- 7.2.3 Supply Chain and Operational Constraints
- 7.3 Market Challenges
- 7.3.1 Competitive Pressure and Margin Erosion
- 7.3.2 Skills, Infrastructure and Implementation Gaps
- 7.4 Emerging Market Opportunities
- 7.5 Market Dynamics Impact and Time-Horizon Assessment
Chapter 8 Global Fin Field Effect Transistor (FinFET) Value Chain Analysis
- 8.1 Industry Value Chain Overview
- 8.2 Upstream Suppliers and Critical Inputs
- 8.3 Technology and Component Providers
- 8.4 Manufacturing or Service Delivery
- 8.5 Distribution, Channel Partners and Integrators
- 8.6 Downstream Applications and End Users
- 8.7 Value Addition and Profit Pools
- 8.8 Vertical Integration and Outsourcing
- 8.9 Supplier Concentration and Risk
- 8.10 Supply Chain Localization and Resilience
Chapter 9 Global Fin Field Effect Transistor (FinFET) Market Regulations and Policies
- 9.1 Relevant Laws, Standards and Compliance Frameworks
- 9.2 Product, Service, Safety and Quality Requirements
- 9.3 Government Policies, Incentives and Subsidies
- 9.4 Imports, Exports and Trade Barriers
- 9.5 Public Procurement and Local Content Requirements
- 9.6 Environmental and Sustainability Compliance
- 9.7 Upcoming Policy Changes and Market Implications
Chapter 10 Global Fin Field Effect Transistor (FinFET) Market Hotspots and Opportunities
- 10.1 Market Opportunity Mapping and Growth Hotspots
- 10.2 High-Growth Applications and Customer Groups
- 10.3 Underserved Markets and White-Space Opportunities
- 10.4 Emerging Technology and Product Opportunities
- 10.5 New Capacity and Investment Hotspots
- 10.6 Market Entry and Expansion Opportunities
- 10.7 Distribution and Partnership Opportunities
- 10.8 Near-Term and Long-Term Commercial Potential
- 10.9 Opportunity Attractiveness and Execution Risks
Chapter 11 Global Fin Field Effect Transistor (FinFET) Market Outlook, 2025-2035
- 11.1 Market Size and Analysis
- 11.1.1 Revenue (Market Measurement: 2025: USD 104.62 billion → 2035: USD 184.10 billion)
- 11.1.2 Market Volume and Quantity Sold
- 11.1.3 Historical Market Size, 2018-2025
- 11.1.4 Base-Year Market Size, 2025
- 11.2 Market Forecast, 2025-2035
- 11.2.1 Revenue Forecast to 2035
- 11.2.2 Volume Forecast to 2035
- 11.2.3 CAGR and Year-on-Year Growth
- 11.2.4 Incremental Revenue Opportunity
- 11.3 Forecast Assumptions and Scenario Analysis
- 11.3.1 Base-Case Forecast
- 11.3.2 Optimistic and Conservative Scenarios
- 11.3.3 Technology, Pricing and Policy Sensitivities
- 11.4 Market Attractiveness and Growth Outlook
Chapter 12 Global Fin Field Effect Transistor (FinFET) Market Segmentation and Outlook
- 12.1 Segmentation Summary and Market Shares, 2025
- 12.2 Largest and Fastest-Growing Segments
- 12.3 By Technology Node - Market Size and Forecast, 2025-2035
- 12.3.1 Segment Definition and Scope
- 12.3.2 Historical Market Size, 2018-2025
- 12.3.3 Revenue Forecast, 2025-2035
- 12.3.4 Volume Forecast, 2025-2035
- 12.3.5 Base-Year Market Share, 2025
- 12.3.6 Segment CAGR and Growth Drivers
- 12.3.7 Subsegment Market Size and Forecast
- 12.3.7.1 3 nm
- 12.3.7.2 5 nm and 4 nm
- 12.3.7.3 10 nm to 6 nm
- 12.3.7.4 22 nm to 12 nm
- 12.3.8 Subsegment Pricing and Adoption Trends
- 12.3.9 Leading Suppliers and Competition
- 12.3.10 Regional Demand and Opportunities
- 12.4 By Application - Market Size and Forecast, 2025-2035
- 12.4.1 Segment Definition and Scope
- 12.4.2 Historical Market Size, 2018-2025
- 12.4.3 Revenue Forecast, 2025-2035
- 12.4.4 Volume Forecast, 2025-2035
- 12.4.5 Base-Year Market Share, 2025
- 12.4.6 Segment CAGR and Growth Drivers
- 12.4.7 Subsegment Market Size and Forecast
- 12.4.7.1 Data Center and AI Computing
- 12.4.7.2 Smartphones
- 12.4.7.3 Computers and Tablets
- 12.4.7.4 Automotive
- 12.4.7.5 Wearables, IoT and Other Products
- 12.4.8 Subsegment Pricing and Adoption Trends
- 12.4.9 Leading Suppliers and Competition
- 12.4.10 Regional Demand and Opportunities
- 12.5 By Business Model - Market Size and Forecast, 2025-2035
- 12.5.1 Segment Definition and Scope
- 12.5.2 Historical Market Size, 2018-2025
- 12.5.3 Revenue Forecast, 2025-2035
- 12.5.4 Volume Forecast, 2025-2035
- 12.5.5 Base-Year Market Share, 2025
- 12.5.6 Segment CAGR and Growth Drivers
- 12.5.7 Subsegment Market Size and Forecast
- 12.5.7.1 Pure-Play Foundries
- 12.5.7.2 Integrated Device Manufacturers
- 12.5.8 Subsegment Pricing and Adoption Trends
- 12.5.9 Leading Suppliers and Competition
- 12.5.10 Regional Demand and Opportunities
- 12.6 Segment Growth Comparison
- 12.7 Segment Attractiveness and Priority Matrix
Chapter 13 Global Fin Field Effect Transistor (FinFET) End-Use and Application Market Outlook
- 13.1 End-Use Industry and Customer Demand Structure
- 13.2 Leading Applications and Customer Groups
- 13.3 End-Use Market Size, Share and Forecast
- 13.4 Major End-Use Industry Deep Dives
- 13.4.1 Customer Requirements and Use Cases
- 13.4.2 Demand and Replacement Cycles
- 13.4.3 Technical and Regulatory Considerations
- 13.4.4 Purchasing and Procurement Models
- 13.4.5 Leading Vendors and Distribution Channels
- 13.4.6 Forecast and Commercial Opportunities
- 13.5 Emerging Applications and Cross-Segment Demand
- 13.6 End-Use Industry Investment Priorities
Chapter 14 Global Fin Field Effect Transistor (FinFET) Geographic Market Outlook, 2025-2035
- 14.1 Regional Market Size and Share, 2025
- 14.2 Regional Market Forecast, 2025-2035
- 14.3 Regional Pricing, Production and Demand Differences
- 14.4 North America
- 14.4.1 United States
- 14.4.2 Canada
- 14.4.3 Mexico
- 14.5 Europe
- 14.5.1 Germany
- 14.5.2 France
- 14.5.3 Italy
- 14.5.4 United Kingdom
- 14.5.5 Spain
- 14.5.6 Poland
- 14.5.7 Russia
- 14.5.8 Netherlands
- 14.5.9 Belgium
- 14.5.10 Sweden
- 14.5.11 Denmark
- 14.5.12 Norway
- 14.5.13 Rest of Europe
- 14.6 Asia Pacific
- 14.6.1 China
- 14.6.2 India
- 14.6.3 Japan
- 14.6.4 South Korea
- 14.6.5 Thailand
- 14.6.6 Indonesia
- 14.6.7 Vietnam
- 14.6.8 Malaysia
- 14.6.9 Australia
- 14.6.10 Rest of Asia Pacific
- 14.7 Latin America
- 14.7.1 Brazil
- 14.7.2 Argentina
- 14.7.3 Colombia
- 14.7.4 Chile
- 14.7.5 Rest of Latin America
- 14.8 Middle East
- 14.8.1 Saudi Arabia
- 14.8.2 United Arab Emirates
- 14.8.3 Turkey
- 14.8.4 Israel
- 14.8.5 Iran
- 14.8.6 Rest of the Middle East
- 14.9 Africa
- 14.9.1 South Africa
- 14.9.2 Egypt
- 14.9.3 Nigeria
- 14.9.4 Morocco
- 14.9.5 Rest of Africa
- 14.10 Regional Investment, Policy and Supply Chain Differences
- 14.11 Regional Competitive Landscape
- 14.12 Geographic Growth Hotspots
Chapter 15 Global Fin Field Effect Transistor (FinFET) Technology, Innovation and Sustainability Outlook
- 15.1 Technology Landscape and Maturity
- 15.2 Product, Process and Service Innovation
- 15.3 AI, Automation and Digital Tools in the Industry
- 15.4 Technology Adoption and Performance Benchmarking
- 15.5 Innovation Pipeline and R&D Investment
- 15.6 Patent and Intellectual Property Trends
- 15.7 Energy Efficiency and Resource Management
- 15.8 Sustainability, Recycling and Circularity
- 15.9 Technology Roadmap, 2025-2035
- 15.10 Risks of Obsolescence and Technology Substitution
Chapter 16 Global Fin Field Effect Transistor (FinFET) Market Key Strategic Imperatives
- 16.1 Growth and Market Entry Priorities
- 16.2 High-Return Products and Segments
- 16.3 Pricing, Profitability and Cost Optimization
- 16.4 Technology Investment and Product Differentiation
- 16.5 Supply Chain Localization and Resilience
- 16.6 Distribution and Customer Acquisition
- 16.7 Partnership, Acquisition and Capacity Strategy
- 16.8 Regional Expansion Priorities
- 16.9 Short-, Medium- and Long-Term Actions
Chapter 17 Competition Outlook
- 17.1 Industry Competition Characteristics
- 17.2 Market Structure and Concentration
- 17.3 Market Share and Competitive Positioning, 2025
- 17.4 Company-Wise Revenue and Product Benchmarking
- 17.5 Production and Service Capacity Benchmarking
- 17.6 Technology, Pricing and Differentiation
- 17.7 Regional Footprint and Distribution Strength
- 17.8 Mergers, Acquisitions and Strategic Alliances
- 17.9 New Entrants and Competitive Threats
- 17.10 Porter's Five Forces and Industry Attractiveness
- 17.11 Competitive Outlook, 2025-2035
Chapter 18 Company Profiles
- 18.1 Company Coverage and Selection Criteria
- 18.2 Taiwan Semiconductor Manufacturing Company (TSMC)
- 18.2.1 Business Description
- 18.2.2 Company Ownership and Geographic Presence
- 18.2.3 Product and Service Portfolio
- 18.2.4 Manufacturing and Operating Footprint
- 18.2.5 Production Capacity and Expansion Plans
- 18.2.6 Financial Performance and Investment
- 18.2.7 Market Share and Competitive Position
- 18.2.8 Technology and Innovation Capabilities
- 18.2.9 Strategic Alliances or Partnerships
- 18.2.10 Recent Developments
- 18.2.11 Growth Strategy and Outlook
- 18.3 Samsung Electronics (Samsung Foundry)
- 18.4 Intel Corporation (Intel Foundry)
- 18.5 Semiconductor Manufacturing International Corporation (SMIC)
- 18.6 GlobalFoundries
- 18.7 United Microelectronics Corporation (UMC)
- 18.8 Other Relevant Market Participants
Note: Every listed company is profiled on the structure shown under the first company. The company list is preliminary and may change based on research findings, market developments, data availability and client requirements.
Chapter 19 Disclaimer
- 19.1 Research and Forecast Disclaimer
- 19.2 Data Source and Estimation Limitations
Note: The depth of individual sections depends on data availability for this market. Volume, capacity, trade and other unit-based metrics are included where applicable.

