Market Overview:
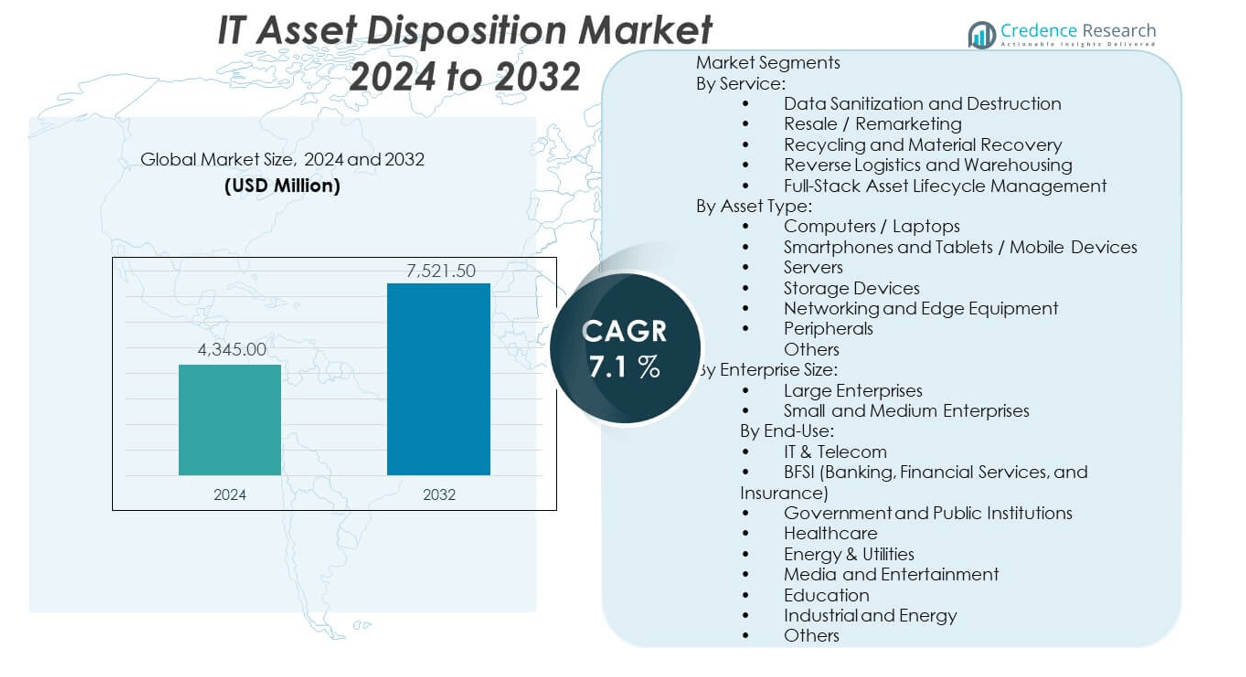
The IT asset disposition market is projected to grow from USD 4,345 million in 2024 to an estimated USD 7,521.5 million by 2032, with a compound annual growth rate (CAGR) of 7.1% from 2024 to 2032.
| REPORT ATTRIBUTE |
DETAILS |
| Historical Period |
2020-2023 |
| Base Year |
2024 |
| Forecast Period |
2025-2032 |
| IT Asset Disposition Market Size 2024 |
USD 4,345 million |
| IT Asset Disposition Market, CAGR |
7.1% |
| IT Asset Disposition Market Size 2032 |
UUSD 7,521.5 million |
The growth of the IT asset disposition (ITAD) market is driven by the rising demand for secure and environmentally responsible disposal of outdated or obsolete IT equipment. As enterprises increasingly adopt cloud computing and digital transformation initiatives, the frequency of hardware upgrades has surged. Companies seek compliant and sustainable solutions to manage retired devices, protect sensitive data, and adhere to regulations such as e-waste directives and data privacy laws. These factors encourage outsourcing ITAD services to specialized providers offering certified and eco-friendly recycling, data wiping, and resale options.
North America leads the IT asset disposition market due to stringent environmental regulations, strong corporate sustainability goals, and widespread adoption of IT infrastructure in sectors like finance, healthcare, and government. Europe closely follows, propelled by its strict compliance requirements and growing awareness of circular economy principles. Meanwhile, the Asia-Pacific region is emerging rapidly, driven by increasing digitization, expanding data center networks, and rising awareness of secure disposal practices in countries like China, India, and Japan. The market in these regions benefits from growing investments in ITAD facilities and evolving regulatory frameworks.
Market Insights:
- The IT asset disposition market is projected to grow from USD 4,345 million in 2024 to USD 7,521.5 million by 2032, registering a CAGR of 7.1% during the forecast period.
- Increasing demand for secure disposal of outdated IT assets and rising compliance with data protection regulations drive strong market momentum.
- Enterprises seek environmentally responsible recycling and resale services, aligning ITAD strategies with sustainability and ESG goals.
- High service costs and limited awareness among small and medium enterprises restrain full-scale adoption across all regions.
- North America dominates the market due to strict environmental laws, mature IT infrastructure, and enterprise focus on certified ITAD programs.
- Europe follows with strong growth, backed by GDPR compliance and initiatives promoting circular economy practices.
- Asia-Pacific emerges as the fastest-growing region, driven by expanding digital infrastructure, growing IT investments, and evolving e-waste regulations.
Access crucial information at unmatched prices!
Request your sample report today & start making informed decisions powered by Credence Research Inc.!
Download Sample
Market Drivers:
Growing Emphasis on Data Security and Regulatory Compliance in IT Lifecycle Management:
Organizations continue to elevate data security and privacy as strategic priorities across the IT landscape. Strict global regulations such as GDPR, HIPAA, and industry-specific standards require secure handling and disposal of sensitive data. Enterprises must ensure full data sanitization when retiring IT assets to avoid data breaches and regulatory penalties. The IT asset disposition market benefits directly from these requirements, offering certified and auditable disposal methods. Data centers, financial institutions, and healthcare providers seek third-party ITAD partners to verify compliance. Businesses that manage sensitive consumer or operational data now treat ITAD as part of their risk management strategy. Companies can no longer afford to store decommissioned assets indefinitely. They prefer traceable and policy-driven disposal routes, enhancing demand for structured ITAD services.
- For instance, Blancco Technology Group has securely erased over 83 million devices globally through its certified data erasure solutions, supporting organizations in regulatory compliance and providing audit trails that meet stringent legal requirements.
Accelerated Technology Refresh Cycles Drive Higher Equipment Turnover:
Enterprises are modernizing infrastructure to support cloud migration, automation, and AI implementation. This shift results in shorter hardware refresh cycles, increasing the volume of retired IT equipment. The IT asset disposition market sees greater activity across sectors transitioning to hybrid or cloud-based environments. Companies need structured processes to remove outdated servers, storage systems, and endpoints. Frequent upgrades increase inventory turnover, requiring professional handling to ensure secure and efficient disposal. Businesses also aim to recover asset value through resale or parts harvesting. ITAD providers support this by offering refurbishment and resale channels. The trend toward agility in IT operations ensures continuous demand for disposal solutions that align with evolving business needs.
- For instance, Iron Mountain processed more than 1 million IT assets for clients in 2024 alone, reflecting enterprise-scale equipment refresh driven by modernization and digital transformation initiatives.
Environmental Sustainability Pressures Accelerate Demand for Eco-Compliant IT Disposal:
Environmental responsibility is now integral to corporate strategy and public image. Enterprises focus on reducing e-waste and improving recycling outcomes. The IT asset disposition market responds by expanding services for responsible recycling, component recovery, and zero-landfill goals. Governments enforce environmental laws that mandate proper disposal of electronic waste. Stakeholders demand supply chain accountability, including asset end-of-life practices. ITAD providers meet this need by offering certified recycling, sustainability reporting, and emission reduction tracking. Companies also use ITAD to support ESG initiatives and green certifications. Awareness around the environmental impact of electronics disposal increases, driving preference for eco-compliant ITAD partners. This factor significantly shapes vendor selection and long-term service agreements.
Increased Outsourcing of ITAD Due to Complexity and Cost of In-House Processes:
Managing IT asset disposition internally requires compliance knowledge, secure logistics, and recycling infrastructure. Few enterprises have the scale or expertise to handle these requirements effectively. The IT asset disposition market grows as more companies outsource this critical function. Third-party providers deliver end-to-end solutions from de-installation to destruction or resale. Outsourcing lowers liability, streamlines compliance, and improves efficiency. Businesses gain access to certifications, environmental tracking, and secure chain-of-custody documentation. IT departments focus on core functions while specialized vendors manage asset retirement. Outsourcing also improves inventory control and aligns with procurement cycles. The rising complexity of regulatory and environmental standards reinforces the outsourcing trend.
Market Trends:
Rising Integration of ITAD with Enterprise IT Asset Management Platforms:
Enterprises are increasingly linking IT asset disposition processes with broader IT asset management (ITAM) systems. This integration improves visibility, traceability, and compliance across the asset lifecycle. It enables organizations to track decommissioned devices and generate audit-ready reports. The IT asset disposition market adapts by embedding digital tools into service offerings. Cloud-based portals and APIs support real-time updates, chain-of-custody records, and compliance workflows. Businesses benefit from centralized dashboards for asset retrieval, certification tracking, and logistics management. This trend reduces manual reporting and human error. Organizations treat ITAD as a strategic extension of IT operations, not just an end-of-life function. Service providers invest in automation and software integration to support seamless execution.
- For instance, Cascade Asset Management’s portal allows clients to monitor the end-of-life processing of more than 800,000 assets annually, streamlining compliance and traceability for enterprise customers.
Growth in Circular Economy Models Promotes Reuse and Value Recovery:
Corporate sustainability goals now extend beyond recycling to include reuse and resource optimization. The IT asset disposition market aligns with this trend by promoting asset recovery, refurbishment, and resale. Enterprises explore secondary markets to recoup costs and minimize environmental impact. OEMs and service providers design programs that maximize asset lifespan through repair and certified resale. Growing awareness of circular economy principles encourages responsible consumption and waste reduction. ITAD firms expand remarketing capabilities, including international resale channels. Clients prefer options that generate value while remaining compliant and eco-conscious. The shift from disposal to circularity reshapes service expectations across industries.
- For instance, TES (a part of SK Ecoplant) handled over 4 million assets for refurbishment and resale globally in 2024, significantly reducing landfill waste and supporting client sustainability initiatives.
Expansion of Remote and Hybrid Work Drives Demand for Distributed ITAD Services:
Remote and hybrid work environments require asset recovery from decentralized locations. Enterprises must manage ITAD across employee homes, co-working spaces, and satellite offices. The IT asset disposition market adjusts by offering on-site pickups, secure shipping kits, and location-flexible logistics. Service providers optimize routes and offer real-time tracking to accommodate distributed workforces. Security remains critical, with firms requiring serialized audits, chain-of-custody control, and certified destruction. Remote working accelerates device turnover and complicates inventory reconciliation. ITAD solutions now cater to employee separation workflows and endpoint device retrievals. Flexibility and reach become major differentiators in vendor selection.
Greater Adoption of Blockchain and AI for Secure and Transparent ITAD Processes:
Blockchain and AI technologies are gaining traction in the IT asset disposition market. Enterprises seek immutable records, smart contracts, and automated compliance tracking. Blockchain enhances security by creating tamper-proof disposal logs and traceable asset histories. AI supports anomaly detection, route optimization, and automated certification generation. Service providers invest in these technologies to build client trust and operational efficiency. Digital transformation mandates across industries push ITAD vendors to modernize infrastructure. Enterprises view tech-enabled ITAD partners as more reliable and future-ready. Transparency and intelligence elevate client confidence and compliance assurance, boosting market credibility.
Market Challenges Analysis:
Lack of Standardization Across Jurisdictions Complicates Global ITAD Operations:
The IT asset disposition market faces difficulties from inconsistent regulations across regions. Companies operating globally must navigate varying environmental laws, data protection requirements, and recycling standards. This regulatory fragmentation limits operational scalability and increases compliance risk. Service providers must customize workflows for each location, raising costs and complexity. It also creates confusion for multinational clients seeking unified disposal frameworks. The absence of harmonized e-waste legislation impedes cross-border logistics. Providers require local expertise and partnerships, which may not always align with service quality expectations. Managing varying certification schemes and reporting formats remains a persistent operational burden. Without global regulatory convergence, ITAD vendors must maintain region-specific infrastructures.
Limited Awareness and Budget Allocation Among SMEs Restrict Market Reach:
Small and mid-sized enterprises often deprioritize structured IT asset disposition due to cost constraints and low awareness. They either store outdated equipment or dispose of it informally, creating data security and environmental risks. The IT asset disposition market struggles to penetrate this segment, where price sensitivity and education gaps persist. SMEs may lack internal policies or technical knowledge for secure ITAD execution. They underestimate liability from improper disposal or untracked inventory. Service providers find it challenging to offer cost-effective, scalable solutions for this fragmented base. Without awareness campaigns or incentives, SMEs remain under-addressed despite their growing IT infrastructure needs.
Market Opportunities:
Emergence of Certified ITAD Services in Emerging Economies Expands Growth Scope:
Emerging economies present strong opportunities due to rising IT consumption and increasing environmental awareness. Enterprises in regions like Southeast Asia, Latin America, and the Middle East begin to adopt formalized ITAD frameworks. The IT asset disposition market can tap into these regions by offering scalable and compliant services. Governments promote e-waste handling legislation, creating demand for certified vendors. Local companies seek partnerships with global ITAD firms for secure and traceable processes. These markets offer potential for resale and recycling expansion, driven by economic digitization and infrastructure growth.
Demand for Secure Cloud Decommissioning Fuels New Service Categories:
With the shift toward hybrid and multi-cloud environments, companies face challenges in decommissioning legacy data center infrastructure. The IT asset disposition market responds by offering specialized services for cloud migration and hardware retirement. Enterprises require secure removal of storage units, servers, and networking gear. Providers that offer auditing, data erasure, and chain-of-custody validation gain competitive advantage. The intersection of cloud strategy and ITAD creates new service streams for data sanitization and asset monetization. This demand supports market diversification and growth into new verticals.
Market Segmentation Analysis:
By Service
The IT asset disposition market segments services into data sanitization and destruction, resale/remarketing, recycling and material recovery, reverse logistics and warehousing, and full-stack asset lifecycle management. Data sanitization and destruction dominate due to the critical need for data security and compliance with privacy laws. Resale and remarketing enable enterprises to recover value from decommissioned assets, while recycling supports environmental goals. Full-stack lifecycle management appeals to enterprises seeking centralized, end-to-end IT asset oversight.
- For instance, Sims Lifecycle Services reports that over 97% of materials processed in 2024 were successfully recycled or reused, highlighting the effectiveness of closed-loop lifecycle solutions.
By Asset Type
Asset types in the market include computers/laptops, smartphones and tablets, servers, storage devices, networking and edge equipment, peripherals, and others. Computers and laptops hold the largest share owing to high usage and frequent refresh cycles. Mobile devices are gaining attention due to increased remote workforce deployments. Servers and storage equipment are often decommissioned during cloud transitions, requiring secure disposal.
- For instance, Dell Technologies processed more than 2.3 million laptops and desktops for secure disposition worldwide in the past year, addressing both enterprise and consumer demand for ITAD services.
By Enterprise Size
The market serves both large enterprises and small and medium enterprises (SMEs). Large enterprises lead in adoption due to larger asset volumes and strict regulatory compliance needs. SMEs are increasingly adopting ITAD solutions as awareness of data security and regulatory exposure grows. They require scalable, affordable services with simplified compliance.
By End-Use / Industry Vertical
Key end-use industries include IT & telecom, BFSI, government and public institutions, healthcare, energy & utilities, media and entertainment, education, industrial and energy, and others. IT & telecom and BFSI sectors drive significant demand due to sensitive data and rigorous regulations. Government and healthcare entities prioritize certified destruction. The IT asset disposition market aligns solutions with the compliance, security, and sustainability demands of each sector.
Segmentation:
By Service:
- Data Sanitization and Destruction
- Resale / Remarketing
- Recycling and Material Recovery
- Reverse Logistics and Warehousing
- Full-Stack Asset Lifecycle Management
By Asset Type:
- Computers / Laptops
- Smartphones and Tablets / Mobile Devices
- Servers
- Storage Devices
- Networking and Edge Equipment
- Peripherals
- Others
By Enterprise Size:
- Large Enterprises
- Small and Medium Enterprises
By End-Use:
- IT & Telecom
- BFSI (Banking, Financial Services, and Insurance)
- Government and Public Institutions
- Healthcare
- Energy & Utilities
- Media and Entertainment
- Education
- Industrial and Energy
- Others
By Region:
- North America
- Europe
- Germany
- France
- U.K.
- Italy
- Spain
- Rest of Europe
- Asia Pacific
- China
- Japan
- India
- South Korea
- South-east Asia
- Rest of Asia Pacific
- Latin America
- Brazil
- Argentina
- Rest of Latin America
- Middle East & Africa
- GCC Countries
- South Africa
- Rest of the Middle East and Africa
Regional Analysis:
North America
North America holds the largest share of the IT asset disposition market, accounting for approximately 38% of the global market in 2024. Strong data privacy regulations, such as HIPAA and state-specific laws, compel enterprises to adopt certified ITAD services. The presence of key players like Iron Mountain, Dell Technologies, and IBM strengthens service availability and infrastructure across the region. High levels of IT hardware deployment across sectors including finance, government, and healthcare generate consistent asset turnover. Sustainability commitments and ESG-driven procurement also accelerate adoption of eco-compliant ITAD practices. The U.S. drives most of the regional demand, supported by a mature IT ecosystem and strong policy enforcement.
Europe
Europe contributes around 27% of the global IT asset disposition market. It benefits from rigorous environmental and data protection regulations, especially under the Waste Electrical and Electronic Equipment (WEEE) directive and GDPR. Enterprises across Germany, the UK, and France increasingly adopt formal ITAD strategies to ensure legal compliance and support circular economy goals. The region also sees growth in secure recycling, resale, and asset tracking services. Many firms integrate ITAD with sustainability reporting, reinforcing vendor accountability. It continues to witness rising demand from public institutions, BFSI, and manufacturing sectors that emphasize traceability and environmental stewardship.
Asia-Pacific
Asia-Pacific holds approximately 22% of the IT asset disposition market and represents the fastest-growing regional segment. Countries like China, India, Japan, and South Korea are driving IT infrastructure expansion, fueling greater demand for structured ITAD solutions. Governments are implementing stricter e-waste regulations and compliance frameworks to address data security and environmental concerns. Enterprises in the region seek localized, cost-effective services to manage hardware decommissioning and data sanitization. The market benefits from increasing cloud migration, rising tech investments, and growing awareness of secure disposal practices. Global ITAD providers are expanding their regional presence to capture long-term growth opportunities in emerging economies.
Other Regions (Latin America, Middle East & Africa)
Latin America and the Middle East & Africa together account for the remaining 13% of the IT asset disposition market. These regions are in early stages of ITAD adoption but show potential due to increasing digital transformation initiatives. Brazil, UAE, and South Africa lead demand with a focus on secure decommissioning and sustainable practices. Service providers entering these markets invest in local compliance expertise and education to build awareness and trust. Gradual regulatory improvements and enterprise-level IT growth are expected to drive steady adoption over the forecast period.
Shape Your Report to Specific Countries or Regions & Enjoy 30% Off!
Key Player Analysis:
- Dell Technologies Inc.
- Hewlett Packard Enterprise (HPE)
- IBM Corporation
- Iron Mountain, Inc.
- Sims Lifecycle Services (formerly Sims Recycling Solutions)
- Ingram Micro Inc. (including former CloudBlue)
- Apto Solutions Inc.
- LifeSpan International Inc.
- TES (a part of SK Ecoplant Co. Ltd.)
- CompuCom Systems Inc.
- Cascade Asset Management
- Arrow Electronics, Inc.
- ITRenew, Inc.
- TBS Industries Inc.
- GreenTekReman Pvt. Ltd.
- Maxicom Network, Inc.
- Blancco Technology Group
Competitive Analysis:
The IT asset disposition market features a competitive landscape marked by global players offering comprehensive, end-to-end solutions. Companies such as Dell Technologies, Hewlett Packard Enterprise, IBM, Iron Mountain, and Sims Lifecycle Services lead through strong infrastructure, certified services, and global reach. It sees increased investment in sustainability-driven offerings, secure data destruction, and full lifecycle asset management. Mid-sized firms like Apto Solutions, Cascade Asset Management, and ITRenew focus on agility, remarketing capabilities, and customized service models. Blancco Technology Group differentiates through its advanced data erasure software. Vendors compete on compliance strength, value recovery efficiency, and client transparency. Strategic partnerships, acquisitions, and service automation enhance competitive advantage across regions.
Recent Developments:
- In April 2025, Dell Technologiesintroduced major infrastructure innovations with advancements across its server, storage, and data protection portfolios to accelerate data center modernization and better manage both traditional and emerging workloads, reinforcing its position in scalable and efficient IT asset disposition solutions.
- In March 2023, Hewlett Packard Enterprise (HPE) partnered with Cyxtera to launch Asset Upcycling Services, enabling organizations to securely and sustainably extract value from decommissioned IT hardware. This partnership allows HPE to facilitate the acquisition of legacy hardware during customer upgrades, further supporting environmentally responsible IT asset disposition.
- In June 2025, IBM Corporation announced the acquisition of HashiCorp Inc., a leading multi-cloud infrastructure automation company, for $6.4 billion. This acquisition is aimed at strengthening IBM’s end-to-end hybrid cloud platform and enhancing its offering for secure, scalable IT asset management and disposition.
- In June 2023, Iron Mountain, Inc. highlighted its streamlined IT asset disposition (ITAD) program, focusing on secure end-of-life service for IT assets, including data destruction, remarketing, recycling, and comprehensive reporting, designed to support organizational sustainability goals and high data security standards.
- In February 2025, Sims Lifecycle Services reaffirmed its commitment to innovation and sustainability within the ITAD space by leveraging advanced robotics for processing assets, delivering customized solutions, and maintaining global reach for secure IT asset management and disposition.
Market Concentration & Characteristics:
The IT asset disposition market is moderately concentrated, with a mix of global corporations and specialized regional providers. It is characterized by high service differentiation, compliance-driven purchasing, and certification requirements. Market leaders maintain strategic facilities and partnerships across key geographies to ensure secure logistics, data sanitization, and responsible recycling. It continues evolving through digital tools, sustainability commitments, and lifecycle-oriented service models. The market favors providers with strong traceability, ESG alignment, and the ability to support distributed enterprise infrastructure.
Report Coverage:
The research report offers an in-depth analysis based on Service, Asset Type, Enterprise Size, End-Use, and Region. It details leading market players, providing an overview of their business, product offerings, investments, revenue streams, and key applications. Additionally, the report includes insights into the competitive environment, SWOT analysis, current market trends, as well as the primary drivers and constraints. Furthermore, it discusses various factors that have driven market expansion in recent years. The report also explores market dynamics, regulatory scenarios, and technological advancements that are shaping the industry. It assesses the impact of external factors and global economic changes on market growth. Lastly, it provides strategic recommendations for new entrants and established companies to navigate the complexities of the market.
Future Outlook:
- Growing adoption of circular economy principles will expand resale and refurbishment services.
- Regulatory mandates on data privacy will continue to drive demand for certified data destruction.
- Integration of AI and blockchain will enhance traceability and audit transparency.
- Expansion of ITAD services in Asia-Pacific will accelerate due to regional digitization.
- Demand for remote asset recovery solutions will rise with hybrid workforce models.
- Environmental accountability will become a key driver of vendor selection.
- SMEs will increase ITAD adoption through scalable and affordable offerings.
- Partnerships between OEMs and ITAD providers will strengthen asset recovery programs.
- Cloud migration trends will boost data center decommissioning services.
- Clients will prioritize vendors offering full-stack lifecycle management with sustainability reporting.


