
Market Overview:
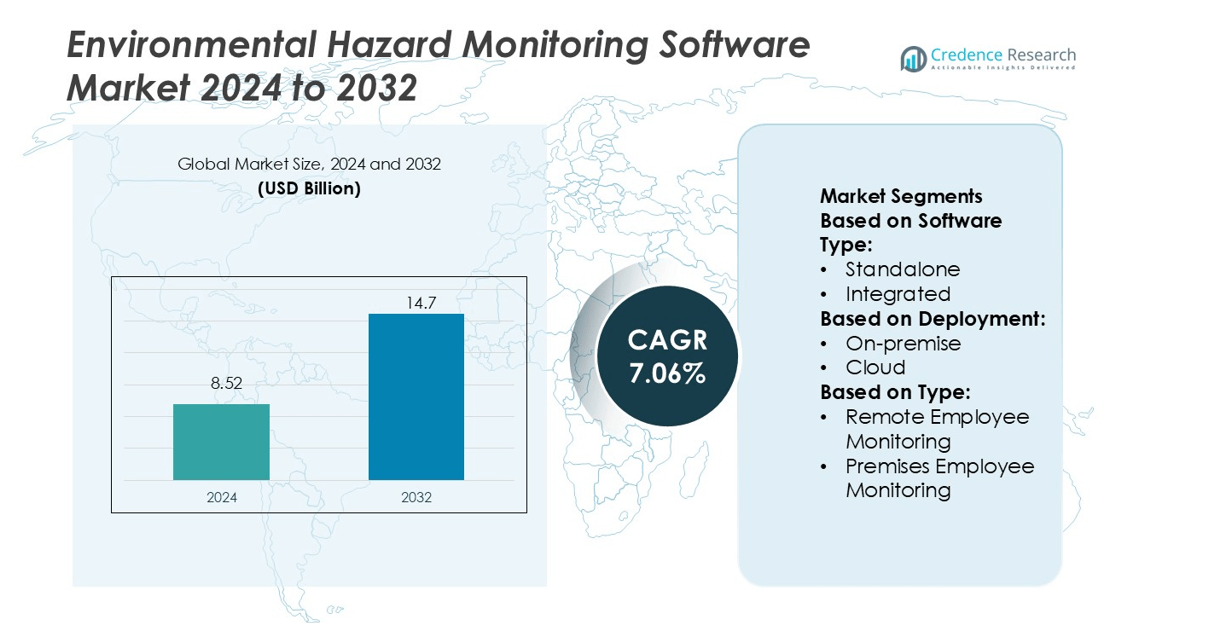
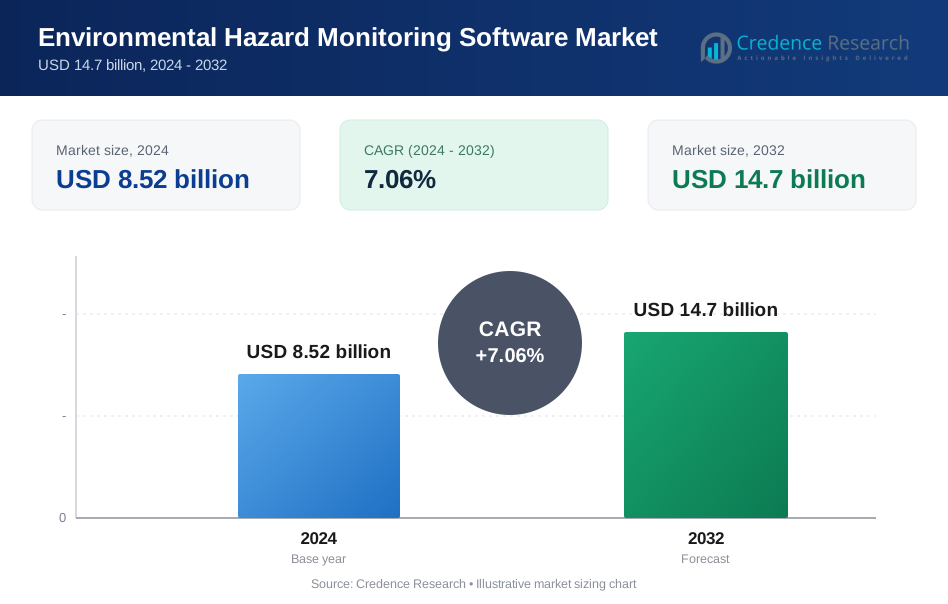
Environmental Hazard Monitoring Software Market size was valued USD 8.52 billion in 2024 and is anticipated to reach USD 14.7 billion by 2032, at a CAGR of 7.06% during the forecast period.
| REPORT ATTRIBUTE | DETAILS |
|---|---|
| Historical Period | 2020-2023 |
| Base Year | 2024 |
| Forecast Period | 2025-2032 |
| Environmental Hazard Monitoring Software Market Size 2024 | USD 8.52 billion |
| Environmental Hazard Monitoring Software Market, CAGR | 7.06% |
| Environmental Hazard Monitoring Software Market Size 2032 | USD 14.7 billion |
The Environmental Hazard Monitoring Software Market is led by key players such as Dynatrace, Cisco Systems, Riverbed Technology, Amazon Web Services, Splunk, New Relic, Microsoft, IBM Corporation, NETSCOUT Systems, and Google. These companies focus on advanced analytics, cloud computing, and AI integration to enhance real-time hazard detection and compliance management. Strategic developments such as IoT sensor connectivity, predictive modeling, and ESG-aligned monitoring platforms strengthen their global presence. Partnerships with industrial and governmental organizations support continuous innovation and large-scale deployments. North America dominates the market with a 37% share, driven by stringent environmental regulations, high cloud adoption, and well-established technological infrastructure supporting enterprise-level hazard management systems.
Market Insights
- The Environmental Hazard Monitoring Software Market was valued at USD 8.52 billion in 2024 and is projected to reach USD 14.7 billion by 2032, growing at a CAGR of 7.06% during the forecast period.
- Rising regulatory enforcement on pollution control and occupational safety drives the demand for real-time hazard detection and compliance automation.
- The market trend centers on integrating AI, IoT sensors, and predictive analytics to enhance early detection accuracy and automate risk mitigation processes.
- Competitive strategies focus on innovation and partnerships, with key players emphasizing ESG-aligned monitoring, multi-hazard detection, and scalable cloud-based platforms.
- North America leads with a 37% share due to strong technological infrastructure and strict compliance policies, while the integrated software segment dominates globally with a 58% share, reflecting the need for centralized, data-driven environmental monitoring across industries.
Market Segmentation Analysis:
By Software Type
The integrated software segment dominates the Environmental Hazard Monitoring Software Market with a 58% share. Its growth is driven by rising demand for unified systems that combine air quality, water contamination, and radiation monitoring within a single platform. Integrated solutions provide centralized data visualization, predictive analytics, and real-time alerts that improve decision-making during emergencies. Organizations favor these systems for operational efficiency and compliance management. The standalone segment remains relevant for small-scale operations, but large industries and municipalities increasingly deploy integrated systems to streamline hazard detection and regulatory reporting.
- For instance, Riverbed launched its xx90 appliance series capable of sustained packet capture at over 50 Gbps and modular storage exceeding 2.4 PB.
By Deployment
The cloud segment leads the market with a 63% share, reflecting the shift toward flexible, scalable, and cost-efficient monitoring systems. Cloud-based platforms enable remote data access, continuous updates, and integration with IoT sensors for real-time environmental assessment. Industries prefer cloud deployment for its data redundancy, rapid scalability, and minimal hardware maintenance. On-premise systems continue to serve government facilities and sectors requiring strict data control. However, the rising use of smart sensors and predictive analytics tools has accelerated the transition to cloud-based environmental hazard management solutions worldwide.
- For instance, New Relic added over 20 new capabilities to its Intelligent Observability Platform. The platform now supports 780+ integrations and offers “unlimited scale” in telemetry ingest.
By Type
The premises employee monitoring segment accounts for a 56% share, driven by the growing need for workplace safety and compliance with occupational health standards. These systems track air quality, radiation, and chemical exposure within industrial and laboratory environments, ensuring immediate alerts during potential hazards. Remote employee monitoring is gaining traction as more organizations adopt hybrid work structures requiring off-site safety supervision. The increasing integration of AI-driven analytics and real-time sensor data supports proactive risk mitigation, reinforcing the dominance of premises-based systems in critical operational zones.
Key Growth Drivers
Rising Environmental Compliance Regulations
Stringent global environmental standards are a major driver for the Environmental Hazard Monitoring Software Market. Governments and agencies are enforcing strict policies on pollution control, waste management, and workplace safety. Organizations are adopting advanced software platforms to automate compliance, generate regulatory reports, and monitor emissions in real time. The increasing frequency of audits and the requirement for transparent data reporting further boost software adoption, especially in industries such as oil and gas, manufacturing, and chemicals that face high environmental and safety liabilities.
- For instance, Microsoft’s 2025 Environmental Sustainability Report highlights how its platform manages high volumes of sustainability data records daily through Microsoft Sustainability Manager, which automates Scope 1, 2, and 3 emission calculations aligned with GHG Protocol standards.
Expansion of Industrial IoT and Sensor Integration
The growing integration of IoT-enabled sensors enhances the accuracy and responsiveness of hazard detection systems. These sensors continuously collect environmental data, including temperature, radiation, air quality, and water contamination levels. Software platforms process this data in real time to identify irregularities and trigger alerts before hazards escalate. The expansion of industrial IoT infrastructure allows remote monitoring of multiple sites simultaneously, improving operational efficiency. This connectivity-driven ecosystem strengthens predictive analytics and data-based risk management in industrial and municipal applications.
- For instance, Mack Trucks has surpassed a milestone of 200,000 Class 8 trucks built with its proprietary telematics gateway since 2014. This confirms the active truck figure cited.
Growing Focus on Workplace Safety and Risk Mitigation
Rising awareness of employee health and occupational safety has significantly increased the use of environmental monitoring solutions. Organizations are investing in software that provides real-time alerts for toxic gas leaks, chemical exposure, and hazardous air conditions. These systems ensure compliance with global safety standards such as OSHA and ISO. The focus on minimizing workplace incidents and legal liabilities encourages continuous adoption across sectors like mining, pharmaceuticals, and energy, where exposure risks are particularly high.
Key Trends & Opportunities
AI and Predictive Analytics in Hazard Monitoring
Artificial intelligence is transforming environmental hazard monitoring through advanced data modeling and predictive analytics. AI-driven platforms detect anomalies faster and forecast potential hazard zones based on historical and sensor data patterns. Companies are integrating machine learning to enhance early warning systems and reduce false alerts. Predictive monitoring not only improves decision-making but also optimizes resource allocation, making it a critical innovation opportunity for vendors seeking to deliver next-generation environmental safety solutions.
- For instance, Amrep's marketing materials and product descriptions (including those in video descriptions) for their automated side loader refuse trucks state that their models "can service up to 1,200 homes per route".
Cloud-Based and Remote Monitoring Expansion
Cloud-based deployment models are reshaping how organizations manage environmental data. The ability to access monitoring dashboards remotely and integrate IoT sensors across dispersed locations drives scalability and cost efficiency. These platforms allow real-time tracking and centralized management of hazardous sites from any location. This trend benefits industries with geographically distributed operations, such as utilities, manufacturing, and transportation, and creates opportunities for service providers offering SaaS-based monitoring solutions with advanced data visualization capabilities.
- For instance, Peterbilt’s Model 520EV delivers a peak power of 670 hp and has a Gross Combined Weight Rating (GCWR) of 66,000 lbs (which is also its Gross Vehicle Weight Rating or GVWR). It is estimated to handle up to 1,100 bin pickups or approximately 80–120 miles on a single charge.
Integration with ESG Reporting Frameworks
The alignment of hazard monitoring software with Environmental, Social, and Governance (ESG) reporting standards is emerging as a strong opportunity. Companies increasingly require tools that track environmental performance metrics and generate compliance-ready ESG reports. Integration of monitoring data with sustainability dashboards enables accurate disclosure of emissions and environmental risks. Vendors offering ESG-compatible software gain an advantage as corporations prioritize transparency and green compliance in their sustainability strategies.
Key Challenges
High Implementation and Maintenance Costs
The deployment of comprehensive environmental monitoring systems involves significant investment in infrastructure, sensors, and software customization. Small and medium enterprises often face financial constraints when adopting these advanced solutions. Additionally, the need for skilled professionals to maintain and interpret large volumes of environmental data further increases operational expenses. These high costs can delay adoption in price-sensitive regions, limiting the overall market penetration despite growing regulatory and environmental pressures.
Data Security and Integration Complexity
Integrating multiple monitoring systems and sensors across facilities poses challenges related to data security and interoperability. Cloud-based platforms, while efficient, raise concerns about unauthorized access to sensitive environmental data. The absence of standardized communication protocols among different sensor networks can lead to fragmented data flows and inconsistent reporting. Ensuring secure transmission, data encryption, and seamless integration with legacy systems remains a critical challenge that vendors must address to build trust and achieve wider adoption.
Regional Analysis
North America
North America leads the Environmental Hazard Monitoring Software Market with a 37% share, supported by advanced industrial automation and strict environmental regulations. The U.S. Environmental Protection Agency (EPA) enforces continuous emissions and waste monitoring standards, encouraging wide adoption of software platforms for real-time compliance reporting. Companies in sectors such as oil and gas, mining, and manufacturing are deploying AI-driven hazard monitoring tools to minimize risk and improve sustainability metrics. Strong investments in IoT infrastructure and cloud-based analytics further enhance the region’s technological edge, ensuring consistent dominance in global environmental monitoring initiatives.
Europe
Europe holds a 30% share of the Environmental Hazard Monitoring Software Market, driven by strict EU environmental directives and carbon-neutral policies. Countries such as Germany, the U.K., and France are leading adopters due to robust industrial safety regulations. European industries increasingly use integrated hazard monitoring platforms for emissions tracking, water quality management, and waste monitoring to comply with the European Green Deal objectives. Strong demand for predictive analytics and IoT-enabled systems enhances the region’s focus on sustainability and workplace safety, fostering continued growth in both private and public sector deployments.
Asia-Pacific
Asia-Pacific accounts for a 24% share and is the fastest-growing region in the Environmental Hazard Monitoring Software Market. Rapid industrialization in China, India, and Japan, along with rising pollution control measures, fuels software adoption. Governments are deploying large-scale monitoring networks for air, water, and radiation management under national safety programs. Industries increasingly rely on cloud-based platforms to manage multi-site data and ensure compliance with evolving environmental laws. The rise of smart manufacturing and city-level monitoring initiatives strengthens Asia-Pacific’s position as a high-potential market for integrated hazard monitoring technologies.
Latin America
Latin America holds a 6% share of the Environmental Hazard Monitoring Software Market, supported by growing awareness of industrial safety and resource conservation. Brazil and Mexico lead regional adoption due to stricter environmental compliance policies and investments in digital infrastructure. The mining, oil, and chemical sectors are key users of these systems, emphasizing real-time hazard detection and data reporting. Government initiatives to monitor deforestation, air pollution, and waste disposal are accelerating demand for advanced monitoring software, although high implementation costs still limit adoption among small enterprises in rural zones.
Middle East & Africa
The Middle East & Africa account for a 3% share of the Environmental Hazard Monitoring Software Market, driven by sustainability initiatives and industrial modernization. GCC countries are investing in advanced hazard monitoring solutions to address air quality and occupational safety issues in oil and gas operations. The region’s smart city projects, such as Saudi Arabia’s NEOM, integrate real-time environmental analytics into urban management systems. In Africa, South Africa and Nigeria are focusing on pollution control and water monitoring. However, infrastructure limitations and data integration challenges restrict large-scale implementation across the continent.
Market Segmentations:
By Software Type:
- Standalone
- Integrated
By Deployment:
- On-premise
- Cloud
By Type:
- Remote Employee Monitoring
- Premises Employee Monitoring
By Geograph
- North America
- U.S.
- Canada
- Mexico
- Europe
- Germany
- France
- U.K.
- Italy
- Spain
- Rest of Europe
- Asia Pacific
- China
- Japan
- India
- South Korea
- South-east Asia
- Rest of Asia Pacific
- Latin America
- Brazil
- Argentina
- Rest of Latin America
- Middle East & Africa
- GCC Countries
- South Africa
- Rest of the Middle East and Africa
Competitive Landscape
The Environmental Hazard Monitoring Software Market features leading players such as Dynatrace, Inc., Cisco Systems, Inc., Riverbed Technology LLC, Amazon Web Services, Inc., Splunk Inc., New Relic, Inc., Microsoft, IBM Corporation, NETSCOUT Systems, Inc., and Google LLC. The Environmental Hazard Monitoring Software Market is characterized by intense competition driven by technological innovation and regulatory compliance demands. Companies are focusing on developing advanced platforms that integrate real-time monitoring, predictive analytics, and AI-based automation to detect and mitigate risks efficiently. The growing adoption of IoT-enabled sensors and cloud-based systems enhances data accuracy and operational scalability across industries. Vendors are investing in research and strategic partnerships to strengthen product interoperability and support compliance with environmental standards. Emphasis on sustainability, data visualization, and integration with enterprise systems is shaping the competitive dynamics and fostering continuous product evolution in this market.
Key Player Analysis
- Dynatrace, Inc.
- Cisco Systems, Inc.
- Riverbed Technology LLC
- Amazon Web Services, Inc.
- Splunk Inc.
- New Relic, Inc.
- Microsoft
- IBM Corporation
- NETSCOUT Systems, Inc.
- Google LLC
Recent Developments
- In August 2024, Honeywell released its Emissions Management Suite for offshore oil and gas platforms, providing near-real-time oversight of emissions performance.
- In June 2024, Datadog, Inc., the security and monitoring platform for cloud applications, announced enhancements to its security product portfolio, including the introduction of Agentless Scanning, Code Security, and Data Security. These new features are designed to facilitate DevOps and security teams in effectively securing their code, cloud environments, and production applications.
- In June 2023, New Relic, APM 360 empowers all engineers to make APM a daily practice with insights from every development stage and every part of the application. This latest advancement in application performance monitoring (APM) represents a significant evolution, extending beyond traditional incident troubleshooting insights aimed at specialized experts to offer daily performance, security, and development insights accessible to all engineers.
Report Coverage
The research report offers an in-depth analysis based on Software Type, Deployment, Type and Geography. It details leading market players, providing an overview of their business, product offerings, investments, revenue streams, and key applications. Additionally, the report includes insights into the competitive environment, SWOT analysis, current market trends, as well as the primary drivers and constraints. Furthermore, it discusses various factors that have driven market expansion in recent years. The report also explores market dynamics, regulatory scenarios, and technological advancements that are shaping the industry. It assesses the impact of external factors and global economic changes on market growth. Lastly, it provides strategic recommendations for new entrants and established companies to navigate the complexities of the market.
Future Outlook
- The market will expand with the increasing adoption of AI and machine learning for predictive environmental risk management.
- Cloud-based monitoring solutions will gain wider use as organizations prioritize scalability and real-time data access.
- Integration of IoT sensors will continue to improve hazard detection accuracy and operational efficiency.
- Governments will enhance environmental regulations, driving higher software adoption across industrial sectors.
- Advanced analytics will enable faster decision-making and improve compliance reporting capabilities.
- Companies will invest in unified platforms offering multi-hazard monitoring and automated alerts.
- The rise of smart cities will boost demand for real-time environmental data integration systems.
- Collaboration between technology firms and regulatory agencies will create standardized monitoring frameworks.
- The focus on ESG compliance will push enterprises to adopt sustainability-driven monitoring tools.
- Continuous innovations in data security and interoperability will strengthen global software deployment confidence.
Request a Free Sample
Fill in your details and we'll send you a free sample report.
- Sample data tables & charts
- Research methodology
Need a Custom Version of This Report?
Tailor the scope, geography, or segments to your exact requirements.
- Custom geography or segment scope
- Direct access to our analyst team
Frequently Asked Questions
What is the current market size for Environmental Hazard Monitoring EHM Software, and what is its projected size in 2032?
At what Compound Annual Growth Rate is the Environmental Hazard Monitoring EHM Software market projected to grow between 2024 and 2032?
Which Environmental Hazard Monitoring EHM Software market segment held the largest share in 2024?
What are the primary factors fueling the growth of the Environmental Hazard Monitoring EHM Software market?
Who are the leading companies in the Environmental Hazard Monitoring Software Market?
Table of Content
Chapter 1. Report Introduction
- 1.1 Report Description & Purpose
- 1.1.1 Report Title & Market Definition
- 1.1.2 Unique Selling Propositions (USP) & Key Differentiators
- 1.1.3 Value Proposition for Stakeholders
- 1.2 Research Objectives
- 1.2.1 Market Sizing Objectives (Volume & Revenue)
- 1.2.2 Segmentation Objectives
- 1.2.3 Competitive Intelligence Objectives
- 1.2.4 Forecast & Scenario Objectives
- 1.3 Report Scope
- 1.3.1 Environmental Hazard Monitoring Software Scope – Types & Subtypes Covered
- 1.3.2 Geographic Scope – Regions & Countries Covered
- 1.3.3 Historical Period, Base Year & Forecast Period (2024; forecast to 2032)
- 1.3.4 Inclusions & Exclusions
- 1.4 HS Code & Classification Framework
- 1.5 Currency, Units & Pricing Basis
- 1.6 Target Stakeholders
- 1.7 Limitations & Assumptions
Chapter 2. Executive Summary
- 2.1 Global Environmental Hazard Monitoring Software Market Snapshot
- 2.1.1 Market Size – Historical (2024) & Forecast (2024-2032) (2024: USD 8.52 billion → 2032: USD 14.7 billion)
- 2.1.2 Volume & Revenue – Global Totals
- 2.1.3 Key Market Highlights – Top Five Facts
- 2.2 Environmental Hazard Monitoring Software Market Segmentation Snapshot
- 2.2.1 Market Split by Region – 2024 vs. 2032
- 2.3 Competitive Snapshot
- 2.3.1 Top 10 Players by Revenue Share – 2024
- 2.3.2 Top 10 Players by Volume Share – 2024
- 2.3.3 Recent Strategic Developments (18-Month Summary)
- 2.4 Key Investment Highlights & Strategic Conclusions
Chapter 3. Environmental Hazard Monitoring Software Market Dynamics & Industry Analysis
- 3.1 Market Overview & Context
- 3.1.1 Environmental Hazard Monitoring Software Market Position in the Broader Automotive Value Chain
- 3.1.2 OEM vs. Replacement Market Dynamics
- 3.1.3 Market Maturity & Development Stage by Region
- 3.2 Environmental Hazard Monitoring Software Market Drivers
- 3.3 Environmental Hazard Monitoring Software Market Restraints & Challenges
- 3.4 Environmental Hazard Monitoring Software Market Opportunities
- 3.5 Porter's Five Forces Analysis
- 3.5.1 Threat of New Entrants
- 3.5.2 Bargaining Power of Suppliers
- 3.5.3 Bargaining Power of Buyers
- 3.5.4 Threat of Substitutes
- 3.5.5 Competitive Rivalry – Intensity Assessment
- 3.6 Environmental Hazard Monitoring Software Value Chain Analysis
- 3.6.1 Upstream – Raw Material/Input Suppliers
- 3.6.1.1 Raw Material/Input 1
- 3.6.1.2 Raw Material/Input 2
- 3.6.1.3 Raw Material/Input 3
- 3.6.2 Midstream – Production/Manufacturing/Service Delivery
- 3.6.2.1 Production/Process Overview
- 3.6.2.2 Key Facility Locations & Capacity by Manufacturer
- 3.6.3 Downstream – Distribution & End Consumer
- 3.6.3.1 Primary Channel – B2B/OEM
- 3.6.3.2 Secondary Channels – Dealer, Retail, Online, Direct
- 3.6.4 Value Chain Profitability Analysis
- 3.6.1 Upstream – Raw Material/Input Suppliers
- 3.7 PESTEL Analysis
- 3.7.1 Political Factors
- 3.7.2 Economic Factors
- 3.7.3 Social Factors
- 3.7.4 Technological Factors
- 3.7.5 Environmental Factors
- 3.7.6 Legal Factors
- 3.8 Environmental Hazard Monitoring Software Supply Chain Analysis
- 3.8.1 Raw Material/Input Supply Risk Assessment
- 3.8.2 Manufacturing Concentration Risk (Geographic Exposure)
- 3.8.3 Trade Disruption Impact Analysis
- 3.9 Regulatory & Policy Landscape
Note: The regulatory and policy landscape section covers regulations based on their applicability to the market, Environmental Hazard Monitoring Software category, geography, and scope of the study. Only regulatory frameworks with a material impact on operations, compliance, trade, sustainability, or market access are analyzed in detail.
Chapter 4. Key Investment Pockets & Opportunity Analysis
- 4.1 Environmental Hazard Monitoring Software Market Attractiveness Analysis
- 4.1.1 By Region – Investment Attractiveness Matrix (Volume × CAGR)
- 4.2 Absolute Revenue Growth Opportunity
- 4.2.1 By Region – Absolute USD Growth Through 2032
- 4.3 Incremental Volume Opportunity
- 4.3.1 By Region – Incremental Volume Through 2032
- 4.3.2 Segment – Incremental Volume
- 4.4 Emerging Submarket Opportunity Deep Dive (Subject to Applicability)
- 4.5 Emerging Market Opportunity Scorecards
- 4.5.1 United States
- 4.5.2 Europe
- 4.5.3 Asia
- 4.5.4 Middle East & Africa
Note: Emerging Market Opportunity Scorecards will be included based on relevance and strategic importance. Regions listed are indicative and may vary depending on data availability and market dynamics.
Chapter 5. Environmental Hazard Monitoring Software Import-Export Analysis & Trade Flows
- 5.1 Global Trade Overview
- 5.1.1 Global Export Value by Country (2024)
- 5.1.2 Global Export Volume by Country (2024)
- 5.1.3 Global Import Value by Country (2024)
- 5.1.4 Global Import Volume by Country (2024)
- 5.1.5 Net Trade Balance by Country (2024)
- 5.2 Export Analysis – Segment
- 5.2.1 Type 1 (HS Code)
- 5.2.2 Type 2 (HS Code)
- 5.2.3 Type 3 (HS Code)
- 5.2.4 Type 4 (HS Code)
- 5.2.5 Type 5 (HS Code)
- 5.3 Import Analysis – Segment
- 5.3.1 Type 1 (HS Code)
- 5.3.2 Type 2 (HS Code)
- 5.3.3 Type 3 (HS Code)
- 5.3.4 Type 4 (HS Code)
- 5.3.5 Type 5 (HS Code)
- 5.4 Average Unit Trade Prices
- 5.4.1 Average Export Price – Segment & Country
- 5.4.2 Average Import Price – Segment & Source Country
- 5.4.3 Price Trends (2024)
- 5.5 Key Trade Route Analysis
- 5.5.1 Trade Route 1
- 5.5.2 Trade Route 2
- 5.5.3 Trade Route 3
- 5.5.4 Trade Route 4
- 5.5.5 Trade Route 5
- 5.6 Trade Policy Impact Assessment
- 5.6.1 US Anti-Dumping & Section 301 Tariffs
- 5.6.2 EU Customs Union Impact
- 5.6.3 Major Free Trade Agreements
- 5.6.4 USMCA Rules of Origin
Note: Trade policy analysis will be included only where relevant to the Environmental Hazard Monitoring Software market.
Chapter 6. Competitive Landscape & Company Benchmarking
- 6.1 Environmental Hazard Monitoring Software Market Concentration & Structure
- 6.1.1 Herfindahl-Hirschman Index (HHI) – vs. 2024
- 6.1.2 Tier 1, Tier 2 & Tier 3 Market Structure
- 6.1.3 Global, Regional & Local Player Dynamics
- 6.2 Environmental Hazard Monitoring Software Market Share Analysis – 2024
- 6.2.1 Global Revenue Share by Company
- 6.2.2 Global Volume Share by Company
- 6.2.3 Regional Revenue Share
- 6.2.4 Market Share Evolution ( vs. 2024)
- 6.2.5 OEM Segment Share by Company
- 6.2.6 Replacement Segment Share by Company
- 6.3 Production/Delivery Capacity & Facility Analysis
- 6.3.1 Global Installed Capacity
- 6.3.2 Capacity Utilization Rates
- 6.3.3 Production/Output Volume
- 6.3.4 Facility Locations & Capacity Map
- 6.3.5 Planned Capacity Additions
- 6.4 Environmental Hazard Monitoring Software Competitive Benchmarking Matrix
- 6.4.1 Revenue, Volume, CAGR & Profitability Comparison
- 6.4.2 Channel Revenue Mix
- 6.4.3 Geographic Revenue Exposure
- 6.4.4 R&D Intensity
- 6.4.5 Sustainability Maturity
- 6.5 Strategic Developments in Environmental Hazard Monitoring Software (Last 24 Months)
- 6.5.1 Mergers, Acquisitions & Divestments
- 6.5.2 New Environmental Hazard Monitoring Software Launches
- 6.5.3 Facility Expansions
- 6.5.4 Strategic Alliances, Joint Ventures & Partnerships
- 6.5.5 Distribution Expansion & Market Entry
- 6.5.6 Sustainability & ESG Initiatives
- 6.6 Competitive Strategy Mapping
- 6.6.1 Leader, Challenger, Follower & Niche Classification
- 6.6.2 Pricing Strategy Comparison
- 6.6.3 Channel Strategy Matrix
Note: Strategic developments are included based on their materiality and the availability of reliable information.
Chapter 7. Global Environmental Hazard Monitoring Software Market – By Distribution Channel
- 7.1 Segment Overview
- 7.1.1 Volume & Revenue Split by Channel (2024 & 2032)
- 7.1.2 Channel Mix Evolution (2024-2032)
Chapter 8. Regional Market Analysis – Global Overview
- 8.1 Global Regional Overview
- 8.1.1 Regional Volume Share
- 8.1.2 Regional Revenue Share
- 8.1.3 Regional Volume by Region
- 8.1.4 Regional Revenue by Region
- 8.1.5 Regional Forecast Through 2032
- 8.2 Cross-Regional Segment Analysis
- 8.2.1 By Distribution Channel
- 8.2.2 By Brand/Price Tier
Chapter 9. North America Environmental Hazard Monitoring Software Market
- 9.1 United States
- 9.2 Canada
- 9.3 Mexico
Chapter 10. Europe Environmental Hazard Monitoring Software Market
- 10.1 Germany
- 10.2 France
- 10.3 Italy
- 10.4 United Kingdom
- 10.5 Spain
- 10.6 Poland
- 10.7 Russia
- 10.8 Netherlands
- 10.9 Belgium
- 10.10 Sweden
- 10.11 Denmark
- 10.12 Norway
- 10.13 Rest of Europe
Chapter 11. Asia Pacific Environmental Hazard Monitoring Software Market
- 11.1 China
- 11.2 India
- 11.3 Japan
- 11.4 South Korea
- 11.5 Thailand
- 11.6 Indonesia
- 11.7 Vietnam
- 11.8 Malaysia
- 11.9 Australia
- 11.10 Rest of Asia Pacific
Chapter 12. Latin America Environmental Hazard Monitoring Software Market
- 12.1 Brazil
- 12.2 Argentina
- 12.3 Colombia
- 12.4 Chile
- 12.5 Rest of Latin America
Chapter 13. Middle East Environmental Hazard Monitoring Software Market
- 13.1 Saudi Arabia
- 13.2 United Arab Emirates
- 13.3 Turkey
- 13.4 Israel
- 13.5 Iran
- 13.6 Rest of the Middle East
Chapter 14. Africa Environmental Hazard Monitoring Software Market
- 14.1 South Africa
- 14.2 Egypt
- 14.3 Nigeria
- 14.4 Morocco
- 14.5 Rest of Africa
Chapter 15. Environmental Hazard Monitoring Software Company Profiles
- 15.1 [Company 01]
- 15.1.1 Company Overview
- 15.1.2 Key Management Personnel
- 15.1.3 Products & Services Portfolio
- 15.1.4 Financial Performance
- 15.1.5 Key Market Focus & Geographic Presence
- 15.1.6 Recent Developments & Strategic Initiatives
Note: The company profile list is preliminary and may change based on research findings, market developments, data availability, and client requirements.
Chapter 16. Appendices
- Appendix A – List of Abbreviations & Acronyms
- Appendix B – Industry Classification Code Reference – Full Series
- Appendix C – Production & Capacity Data Tables
- Appendix D – End-Use & Demand Base Tables
- Appendix E – Consumption & Replacement Rate Assumptions
- Appendix F – ASP Reference Tables
- Appendix G – Manufacturing & Facility Database
- Appendix H – Import-Export Data Tables
- Appendix I – Regulatory Summary Tables
- Appendix J – Primary Research Participant List (Anonymized)
- Appendix K – Primary Research Questionnaire Framework
- Appendix L – Data Sources & Bibliography
- Appendix M – Market Size Divergence & Source Comparison
Chapter 17. Research Methodology
- 17.1 Research Framework & Philosophy
- 17.2 Secondary Research – Sources, Hierarchy & Data Extraction
- 17.3 Data Modeling – Bottom-Up & Top-Down Market Sizing
- 17.4 Primary Research – Stakeholder Framework, LOI & Sample Sizes
- 17.5 Forecast Methodology – Regression, Scenario & Sensitivity Analysis
- 17.6 Quality Control – Four-Layer Validation Framework
- 17.7 Limitations & Standard Assumptions
- 17.8 Disclaimer
