
Marine Active Ingredients Market Overview:
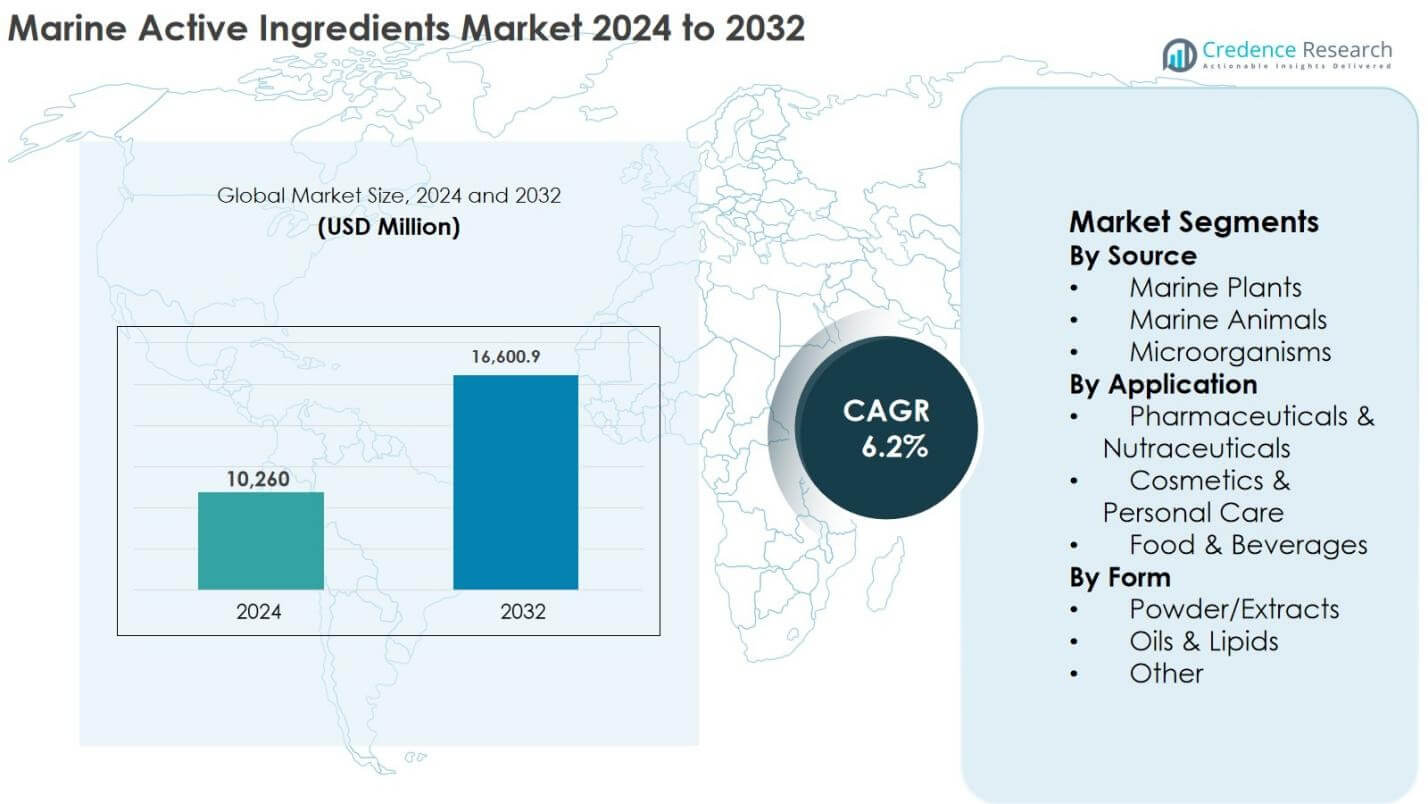
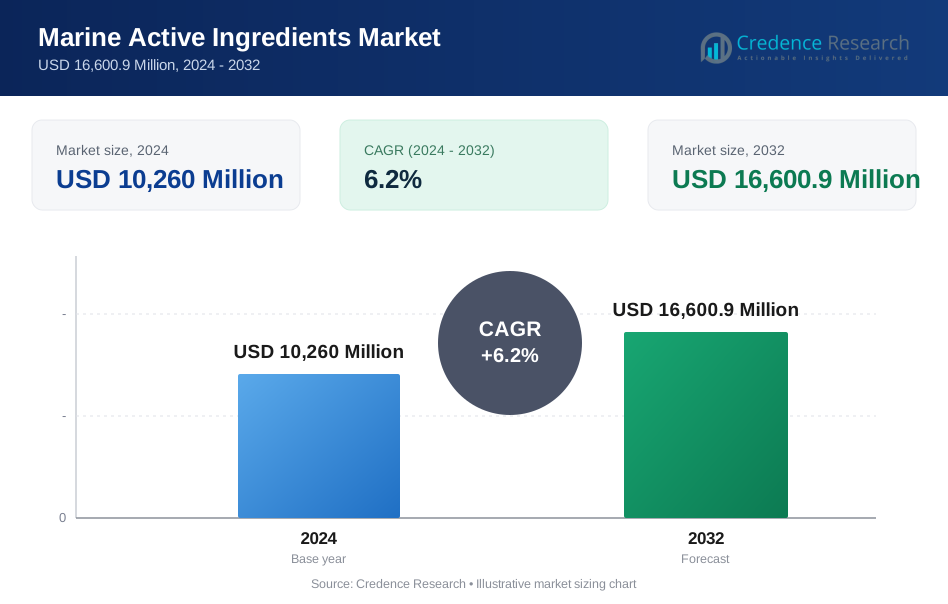
The Marine Active Ingredients Market size was valued at USD 10,260 Million in 2024 and is anticipated to reach USD 16,600.9 Million by 2032, growing at a CAGR of 6.2% during the forecast period.
| REPORT ATTRIBUTE | DETAILS |
|---|---|
| Historical Period | 2020-2023 |
| Base Year | 2024 |
| Forecast Period | 2025-2032 |
| Marine Active Ingredients Market Size 2024 | USD 10,260 million |
| Marine Active Ingredients Market, CAGR | 6.2% |
| Marine Active Ingredients Market Size 2032 | USD 16,600.9 million |
Marine Active Ingredients Market Insights
- Growth is driven by rising demand for nutraceuticals, functional foods, and dietary supplements enriched with marine bioactives such as omega-3 fatty acids, peptides, and antioxidants.
- Key trends include increasing incorporation of marine ingredients in cosmetics and personal care for anti-aging, hydration, and skin-repair benefits, along with the shift toward clean-label and sustainably sourced ingredients.
- Leading players such as Aker BioMarine AS, Cargill, Incorporated, Symrise AG, TripleNine Group A/S, and Bio‑marine Ingredients Ireland Ltd. focus on product innovation, strategic partnerships, and expanding regional presence to strengthen market positioning.
- North America holds 32.4% share in 2024, Europe 28.7%, Asia-Pacific 23.5%, Latin America 9.1%, and Middle East & Africa 6.3%, while Marine Plants dominate by source with 45.6% share, Pharmaceuticals & Nutraceuticals lead by application at 48.3%, and Powder/Extracts hold 42.5% share by form.
Marine Active Ingredients Market Segmentation Analysis:
By Source
The Marine Plants segment dominates the Marine Active Ingredients Market, holding 45.6% share in 2024, driven by the increasing use of algae and seaweed extracts in nutraceuticals, functional foods, and cosmetics. Algal polysaccharides, carotenoids, and antioxidants are highly sought after for their health benefits, including immune support and anti-inflammatory properties. The Marine Animals segment contributes 35.2% share, primarily fueled by fish oil and krill oil demand for cardiovascular and cognitive health. Microorganisms account for 19.2% share, supported by rising applications of marine bacteria and fungi-derived bioactives in pharmaceutical research and functional ingredients development.
- For instance, Neptune Krill Oil at 300 mg daily doses reduced C-reactive protein levels by 31% in a study on chronic inflammation and arthritis symptoms within 7-14 days.
By Application
Pharmaceuticals & Nutraceuticals hold the largest share at 48.3% in 2024, driven by growing demand for omega-3 fatty acids, marine peptides, and bioactive compounds in supplements and therapeutic formulations. Cosmetics & Personal Care contribute 28.7% share, fueled by the rising incorporation of marine extracts in anti-aging, hydration, and skin repair products. Food & Beverages account for 23.0% share, supported by the increasing use of marine-derived proteins, pigments, and functional ingredients in fortified foods, beverages, and dietary products, aligned with health-conscious consumer trends globally.
- For instance, Epax offers ultra-concentrated marine omega-3 fish oil in triglyceride form, providing 800 mg EPA and 600 mg DHA per daily dose of four capsules for cardiovascular and brain health support.
By Form
Powder/Extracts are the dominant form, representing 42.5% share in 2024, due to their ease of incorporation into nutraceuticals, functional foods, and cosmetic formulations. Oils & Lipids hold 38.4% share, primarily driven by high demand for omega-3-rich fish and krill oils in supplements and functional foods. The Other category, accounting for 19.1% share, includes marine peptides, enzymes, and specialized bioactive compounds, with growth supported by advanced pharmaceutical applications and research-focused development of novel marine ingredients.
Key Growth Drivers
Rising Demand for Nutraceuticals and Functional Foods
The Marine Active Ingredients Market is propelled by increasing consumer preference for nutraceuticals and functional foods enriched with marine-derived bioactives. Growing awareness of the health benefits of omega-3 fatty acids, marine peptides, and antioxidants is driving demand in cardiovascular, cognitive, and immune health applications. Manufacturers are focusing on integrating marine ingredients into dietary supplements, functional beverages, and fortified foods to meet consumer expectations. The expansion of health-conscious populations in North America, Europe, and Asia-Pacific, combined with rising disposable incomes and modern retail penetration, further supports market growth by creating sustained demand for high-quality, sustainable, and traceable marine active ingredients.
- For instance, Wellnex produces marine collagen peptides from fish sources for functional foods and beverages, enhancing applications in beauty supplements and sports nutrition products.
Expansion of Personal Care and Cosmetic Applications
Marine Active Ingredients are increasingly incorporated in cosmetics and personal care products due to their anti-aging, hydration, and skin-repairing properties. Rising consumer inclination toward natural, clean-label, and bioactive-based skincare fuels demand for marine-derived compounds such as algal extracts, collagen, and bioactive peptides. Companies are innovating with multifunctional formulations that combine efficacy and sustainability to appeal to premium and mass-market segments. Growth in e-commerce platforms and digital marketing enables brands to reach health- and beauty-conscious consumers efficiently. This expansion into personal care strengthens adoption of marine ingredients, providing a steady revenue stream alongside pharmaceutical and nutraceutical applications.
- For instance, BASF’s Seanactiv™, extracted from Fucus vesiculosus algae, is formulated to reduce under-eye dark circles and improve radiance, appealing to the growing demand for marine-based actives in premium skincare.
Advancements in Sustainable Sourcing and Extraction Technologies
The market benefits from technological advancements in sustainable marine harvesting and extraction processes, ensuring high-quality bioactive ingredients while minimizing environmental impact. Innovations such as supercritical CO₂ extraction, enzymatic processing, and controlled aquaculture of algae and marine animals enhance yield and bioavailability. Regulatory compliance and sustainability certifications are increasingly prioritized by manufacturers, influencing purchasing decisions of global nutraceutical, pharmaceutical, and cosmetic companies. These technological improvements reduce production costs, improve scalability, and enable development of diverse formulations, driving adoption across multiple applications. The focus on eco-friendly, traceable, and high-potency marine ingredients positions the market for long-term growth.
Key Trends & Opportunities
Trend of Clean-Label and Natural Ingredient Adoption
A key trend in the Marine Active Ingredients Market is the growing consumer preference for clean-label, natural, and sustainably sourced ingredients. Demand for chemical-free, bioactive-rich marine extracts in nutraceuticals, functional foods, and skincare products is increasing globally. Brands are leveraging this trend to differentiate products, emphasizing transparency in sourcing, processing, and formulation. Rising health consciousness and regulatory support for natural ingredient labeling further accelerate adoption. Companies are expanding portfolios to include algae-based antioxidants, marine peptides, and omega-3 oils, creating new market opportunities and encouraging innovation in product formats, dosage forms, and multifunctional applications across health, nutrition, and cosmetic sectors.
- For instance, Thala Ingredients produces ThalaCol marine collagen peptides from wild-caught deep-sea tuna skin via enzymatic hydrolysis, offering high-purity, soluble options for supplements with full traceability.
Opportunities in Emerging Markets Emerging economies in Asia-Pacific, Latin America, and the Middle East & Africa offer significant growth opportunities for marine active ingredients due to rising disposable incomes, urbanization, and increasing awareness of health and wellness. Expanding retail infrastructure, e-commerce penetration, and government initiatives promoting dietary supplementation and functional food consumption further boost demand. Companies can capitalize on abundant marine biodiversity and cost-effective production in these regions to develop locally sourced ingredients and affordable formulations. Collaborations with local distributors, nutraceutical brands, and cosmetic manufacturers allow market players to establish a strong presence, driving revenue growth while catering to evolving consumer preferences for sustainable and natural marine-based products.
- For instance, Hofseth BioCare ASA expanded distribution of its OmeGo omega-3 and ProGo protein ingredients into Latin America via Ecuador listings and Asia through exclusive DKSH agreements covering China and India, leveraging local networks for nutraceutical and functional food applications.
Key Challenges
Supply Chain and Sustainability Challenges
Despite growth, the Marine Active Ingredients Market faces supply chain and sustainability challenges. Overfishing, limited marine resources, and regulatory restrictions on harvesting can disrupt ingredient availability and increase costs. Ensuring consistent quality and bioactive concentration across batches is challenging due to seasonal and regional variations in marine sources. Companies must adopt sustainable sourcing practices, such as controlled aquaculture and traceability measures, to meet regulatory and consumer expectations. Failure to maintain sustainability can result in reputational risks and reduced market acceptance. Addressing these challenges is critical for long-term growth and maintaining a stable supply of high-quality marine active ingredients.
Regulatory and Quality Compliance Challenges
Strict regulations and complex quality compliance requirements across different regions pose significant challenges for marine active ingredient manufacturers. Varying standards for dietary supplements, functional foods, pharmaceuticals, and cosmetics demand rigorous testing, documentation, and certifications. Compliance with safety, bioactive potency, and environmental sustainability regulations increases operational costs and limits market entry for smaller players. Additionally, evolving labeling standards and claims restrictions require continuous monitoring and adaptation. Companies must invest in advanced analytical testing, traceability systems, and regulatory expertise to navigate these complexities. Effective compliance ensures product safety, credibility, and market acceptance, but remains a persistent challenge across global marine active ingredient markets.
Regional Analysis
North America
North America leads the Marine Active Ingredients Market with a market share of 32.4% in 2024, driven by high consumer awareness of health and wellness, strong demand for omega-3 fatty acids, and expanding nutraceutical and pharmaceutical sectors. The United States and Canada are major contributors, supported by well-established dietary supplement markets and growing incorporation of marine bioactives in functional foods and personal care products. Increasing R&D investments, government support for sustainable marine sourcing, and rising demand for natural cosmetic ingredients further reinforce regional growth, positioning North America as a dominant market for marine active ingredient adoption.
Europe
Europe holds a market share of 28.7% in 2024, propelled by increasing use of marine-derived bioactives in nutraceuticals, pharmaceuticals, and cosmetic applications. Germany, France, and the UK are key markets, driven by consumer preference for clean-label, sustainable, and functional ingredients. Strong regulatory frameworks, combined with investments in marine biotechnology and sustainable harvesting practices, support product innovation. Rising health-conscious behavior, aging populations seeking dietary supplements, and the expansion of marine extract applications in skin care and functional foods are the primary factors contributing to Europe’s substantial share in the Marine Active Ingredients Market.
Asia-Pacific
Asia-Pacific accounts for a market share of 23.5% in 2024, driven by rapid economic growth, increasing disposable incomes, and expanding health and wellness awareness. Countries such as China, Japan, and India are witnessing significant demand for marine bioactives in functional foods, dietary supplements, and cosmetics. The region benefits from abundant marine biodiversity, cost-effective production, and growing adoption of nutraceuticals and personal care products. Government initiatives promoting marine biotechnology, rising e-commerce penetration, and increasing investments by key players in research and development strengthen Asia-Pacific’s position as a high-growth region in the Marine Active Ingredients Market.
Latin America
Latin America holds a market share of 9.1% in 2024, fueled by increasing consumer focus on health and wellness, rising nutraceutical consumption, and growing functional food and beverage markets. Brazil and Mexico are leading contributors, supported by expanding pharmaceutical and personal care sectors that incorporate marine-derived ingredients. Government support for sustainable marine resources and investments in R&D further stimulate market growth. Increasing awareness of natural and functional ingredients in daily diets, combined with rising e-commerce and retail distribution channels, positions Latin America as an emerging region with promising opportunities for marine active ingredient adoption.
Middle East & Africa
The Middle East & Africa commands a market share of 6.3% in 2024, driven by rising awareness of dietary supplements, increasing disposable incomes, and the growth of the cosmetic and personal care industry. The UAE, Saudi Arabia, and South Africa are key contributors, with demand fueled by the preference for high-quality, natural, and sustainable marine-derived ingredients. Investments in pharmaceutical research, functional foods, and nutraceutical products support regional expansion. Additionally, government initiatives to diversify economies and promote health-oriented consumption, combined with rising urbanization and modern retail development, enhance the adoption of marine active ingredients across the region.
Marine Active Ingredients Market Segmentations:
By Source
- Marine Plants
- Marine Animals
- Microorganisms
By Application
- Pharmaceuticals & Nutraceuticals
- Cosmetics & Personal Care
- Food & Beverages
By Form
- Powder/Extracts
- Oils & Lipids
- Other
By Geography
- North America
- U.S.
- Canada
- Mexico
- Europe
- Germany
- France
- U.K.
- Italy
- Spain
- Rest of Europe
- Asia Pacific
- China
- Japan
- India
- South Korea
- South-east Asia
- Rest of Asia Pacific
- Latin America
- Brazil
- Argentina
- Rest of Latin America
- Middle East & Africa
- GCC Countries
- South Africa
- Rest of the Middle East and Africa
Competitive Landscape
Competitive landscape in the Marine Active Ingredients Market features key players such as Aker BioMarine AS, Bio‑marine Ingredients Ireland Ltd., Cargill, Incorporated, Symrise AG, TripleNine Group A/S, HofsethBioCare ASA, Scanbio Marine Group AS, Algea AS, Givaudan S.A., and Abyss Ingredients. The market is characterized by intense innovation and strategic initiatives, including product launches, partnerships, and acquisitions to strengthen portfolios and expand regional presence. Companies focus on developing high-purity marine extracts, bioactive peptides, and omega-3-rich oils for pharmaceuticals, nutraceuticals, cosmetics, and functional foods. North America and Europe remain highly competitive due to strong R&D capabilities and consumer demand for sustainable and clean-label ingredients. Asia-Pacific is emerging as a growth hotspot, with local players leveraging abundant marine resources and cost-effective production. Market leaders emphasize sustainability, quality certifications, and formulation versatility, creating differentiation and securing long-term contracts with nutraceutical, pharmaceutical, and cosmetic manufacturers globally, thereby consolidating their market positions.
Key Player Analysis
- Aker BioMarine AS
- Bio‑marine Ingredients Ireland Ltd.
- Cargill, Incorporated
- Symrise AG
- TripleNine Group A/S
- HofsethBioCare ASA
- Scanbio Marine Group AS
- Algea AS
- Givaudan S.A.
- Abyss Ingredients
Recent Developments
- In March 2025, Aker BioMarine partnered with two European distributors to introduce new marine ingredients in Europe, including Algal DHA and the high‑DHA Revervia® omega‑3 ingredient for nutraceutical and functional food applications.
- In February 2025, Symrise and Hofseth BioCare formed a strategic partnership to scale salmon‑based marine nutraceutical production and jointly develop and promote marine bioactive ingredients globally.
- In December 2025, Seppic strengthened its marine ingredient lineup by unveiling clinical data on Phlorogine CV, Aspar'Age, and Celtosome Eryngium Maritimum, highlighting their targeted efficacy for skin purity and longevity.
- In October 2025, Bio-Nest officially launched Plaite-3GS GUM, a marine-derived hydrolyzed algin cosmetic ingredient that enhances skin texture, moisturization, and formulation stability through its water-binding film-forming properties.
Report Coverage
The research report offers an in-depth analysis based on Source, Application, Form and Geography. It details leading market players, providing an overview of their business, product offerings, investments, revenue streams, and key applications. Additionally, the report includes insights into the competitive environment, SWOT analysis, current market trends, as well as the primary drivers and constraints. Furthermore, it discusses various factors that have driven market expansion in recent years. The report also explores market dynamics, regulatory scenarios, and technological advancements that are shaping the industry. It assesses the impact of external factors and global economic changes on market growth. Lastly, it provides strategic recommendations for new entrants and established companies to navigate the complexities of the market.
Future Outlook
- Increasing consumer awareness of health and wellness will continue to drive demand for marine-derived bioactives.
- Expansion of nutraceutical and functional food markets will support sustained adoption of marine active ingredients.
- Growing incorporation of marine ingredients in personal care and cosmetic formulations will create new revenue streams.
- Technological advancements in sustainable harvesting and extraction methods will enhance ingredient quality and scalability.
- Emerging markets in Asia-Pacific, Latin America, and the Middle East & Africa will offer significant growth opportunities.
- Companies will focus on clean-label and natural ingredient offerings to meet consumer preferences.
- Strategic partnerships, collaborations, and acquisitions will strengthen market presence and product portfolios.
- Regulatory compliance and certifications will drive trust and acceptance of marine bioactives globally.
- Innovation in marine peptides, antioxidants, and omega-3 formulations will expand applications across industries.
- Digital marketing and e-commerce channels will facilitate broader consumer reach and product accessibility.
Request a Free Sample
Fill in your details and we'll send you a free sample report.
- Sample data tables & charts
- Research methodology
Need a Custom Version of This Report?
Tailor the scope, geography, or segments to your exact requirements.
- Custom geography or segment scope
- Direct access to our analyst team
Frequently Asked Questions
What is the current market size for Marine Active Ingredients Market, and what is its projected size in 2032?
At what Compound Annual Growth Rate is the Marine Active Ingredients Market projected to grow between 2024 and 2032?
Which Marine Active Ingredients Market segment held the largest share in 2024?
What are the primary factors fueling the growth of the Marine Active Ingredients Market?
Who are the leading companies in the Marine Active Ingredients Market?
Which region commanded the largest share of the Marine Active Ingredients Market in 2024?
Table of Content
Chapter 1. Report Introduction
- 1.1 Report Description & Purpose
- 1.1.1 Report Title & Market Definition
- 1.1.2 Unique Selling Propositions (USP) & Key Differentiators
- 1.1.3 Value Proposition for Stakeholders
- 1.2 Research Objectives
- 1.2.1 Market Sizing Objectives (Volume & Revenue)
- 1.2.2 Segmentation Objectives
- 1.2.3 Competitive Intelligence Objectives
- 1.2.4 Forecast & Scenario Objectives
- 1.3 Report Scope
- 1.3.1 Marine Active Ingredients Scope – Types & Subtypes Covered
- 1.3.2 Geographic Scope – Regions & Countries Covered
- 1.3.3 Historical Period, Base Year & Forecast Period (2024; forecast to 2032)
- 1.3.4 Inclusions & Exclusions
- 1.4 HS Code & Classification Framework
- 1.5 Currency, Units & Pricing Basis
- 1.6 Target Stakeholders
- 1.7 Limitations & Assumptions
Chapter 2. Executive Summary
- 2.1 Global Marine Active Ingredients Market Snapshot
- 2.1.1 Market Size – Historical (2024) & Forecast (2024-2032) (2024: USD 10,260 Million → 2032: USD 16,600.9 Million)
- 2.1.2 Volume & Revenue – Global Totals
- 2.1.3 Key Market Highlights – Top Five Facts
- 2.2 Marine Active Ingredients Market Segmentation Snapshot
- 2.2.1 Market Split by Region – 2024 vs. 2032
- 2.3 Competitive Snapshot
- 2.3.1 Top 10 Players by Revenue Share – 2024
- 2.3.2 Top 10 Players by Volume Share – 2024
- 2.3.3 Recent Strategic Developments (18-Month Summary)
- 2.4 Key Investment Highlights & Strategic Conclusions
Chapter 3. Marine Active Ingredients Market Dynamics & Industry Analysis
- 3.1 Market Overview & Context
- 3.1.1 Marine Active Ingredients Market Position in the Broader Automotive Value Chain
- 3.1.2 OEM vs. Replacement Market Dynamics
- 3.1.3 Market Maturity & Development Stage by Region
- 3.2 Marine Active Ingredients Market Drivers
- 3.3 Marine Active Ingredients Market Restraints & Challenges
- 3.4 Marine Active Ingredients Market Opportunities
- 3.5 Porter's Five Forces Analysis
- 3.5.1 Threat of New Entrants
- 3.5.2 Bargaining Power of Suppliers
- 3.5.3 Bargaining Power of Buyers
- 3.5.4 Threat of Substitutes
- 3.5.5 Competitive Rivalry – Intensity Assessment
- 3.6 Marine Active Ingredients Value Chain Analysis
- 3.6.1 Upstream – Raw Material/Input Suppliers
- 3.6.1.1 Raw Material/Input 1
- 3.6.1.2 Raw Material/Input 2
- 3.6.1.3 Raw Material/Input 3
- 3.6.2 Midstream – Production/Manufacturing/Service Delivery
- 3.6.2.1 Production/Process Overview
- 3.6.2.2 Key Facility Locations & Capacity by Manufacturer
- 3.6.3 Downstream – Distribution & End Consumer
- 3.6.3.1 Primary Channel – B2B/OEM
- 3.6.3.2 Secondary Channels – Dealer, Retail, Online, Direct
- 3.6.4 Value Chain Profitability Analysis
- 3.6.1 Upstream – Raw Material/Input Suppliers
- 3.7 PESTEL Analysis
- 3.7.1 Political Factors
- 3.7.2 Economic Factors
- 3.7.3 Social Factors
- 3.7.4 Technological Factors
- 3.7.5 Environmental Factors
- 3.7.6 Legal Factors
- 3.8 Marine Active Ingredients Supply Chain Analysis
- 3.8.1 Raw Material/Input Supply Risk Assessment
- 3.8.2 Manufacturing Concentration Risk (Geographic Exposure)
- 3.8.3 Trade Disruption Impact Analysis
- 3.9 Regulatory & Policy Landscape
Note: The regulatory and policy landscape section covers regulations based on their applicability to the market, Marine Active Ingredients category, geography, and scope of the study. Only regulatory frameworks with a material impact on operations, compliance, trade, sustainability, or market access are analyzed in detail.
Chapter 4. Key Investment Pockets & Opportunity Analysis
- 4.1 Marine Active Ingredients Market Attractiveness Analysis
- 4.1.1 By Region – Investment Attractiveness Matrix (Volume × CAGR)
- 4.2 Absolute Revenue Growth Opportunity
- 4.2.1 By Region – Absolute USD Growth Through 2032
- 4.3 Incremental Volume Opportunity
- 4.3.1 By Region – Incremental Volume Through 2032
- 4.3.2 Segment – Incremental Volume
- 4.4 Emerging Submarket Opportunity Deep Dive (Subject to Applicability)
- 4.5 Emerging Market Opportunity Scorecards
- 4.5.1 United States
- 4.5.2 Europe
- 4.5.3 Asia
- 4.5.4 Middle East & Africa
Note: Emerging Market Opportunity Scorecards will be included based on relevance and strategic importance. Regions listed are indicative and may vary depending on data availability and market dynamics.
Chapter 5. Marine Active Ingredients Import-Export Analysis & Trade Flows
- 5.1 Global Trade Overview
- 5.1.1 Global Export Value by Country (2024)
- 5.1.2 Global Export Volume by Country (2024)
- 5.1.3 Global Import Value by Country (2024)
- 5.1.4 Global Import Volume by Country (2024)
- 5.1.5 Net Trade Balance by Country (2024)
- 5.2 Export Analysis – Segment
- 5.2.1 Type 1 (HS Code)
- 5.2.2 Type 2 (HS Code)
- 5.2.3 Type 3 (HS Code)
- 5.2.4 Type 4 (HS Code)
- 5.2.5 Type 5 (HS Code)
- 5.3 Import Analysis – Segment
- 5.3.1 Type 1 (HS Code)
- 5.3.2 Type 2 (HS Code)
- 5.3.3 Type 3 (HS Code)
- 5.3.4 Type 4 (HS Code)
- 5.3.5 Type 5 (HS Code)
- 5.4 Average Unit Trade Prices
- 5.4.1 Average Export Price – Segment & Country
- 5.4.2 Average Import Price – Segment & Source Country
- 5.4.3 Price Trends (2024)
- 5.5 Key Trade Route Analysis
- 5.5.1 Trade Route 1
- 5.5.2 Trade Route 2
- 5.5.3 Trade Route 3
- 5.5.4 Trade Route 4
- 5.5.5 Trade Route 5
- 5.6 Trade Policy Impact Assessment
- 5.6.1 US Anti-Dumping & Section 301 Tariffs
- 5.6.2 EU Customs Union Impact
- 5.6.3 Major Free Trade Agreements
- 5.6.4 USMCA Rules of Origin
Note: Trade policy analysis will be included only where relevant to the Marine Active Ingredients market.
Chapter 6. Competitive Landscape & Company Benchmarking
- 6.1 Marine Active Ingredients Market Concentration & Structure
- 6.1.1 Herfindahl-Hirschman Index (HHI) – vs. 2024
- 6.1.2 Tier 1, Tier 2 & Tier 3 Market Structure
- 6.1.3 Global, Regional & Local Player Dynamics
- 6.2 Marine Active Ingredients Market Share Analysis – 2024
- 6.2.1 Global Revenue Share by Company
- 6.2.2 Global Volume Share by Company
- 6.2.3 Regional Revenue Share
- 6.2.4 Market Share Evolution ( vs. 2024)
- 6.2.5 OEM Segment Share by Company
- 6.2.6 Replacement Segment Share by Company
- 6.3 Production/Delivery Capacity & Facility Analysis
- 6.3.1 Global Installed Capacity
- 6.3.2 Capacity Utilization Rates
- 6.3.3 Production/Output Volume
- 6.3.4 Facility Locations & Capacity Map
- 6.3.5 Planned Capacity Additions
- 6.4 Marine Active Ingredients Competitive Benchmarking Matrix
- 6.4.1 Revenue, Volume, CAGR & Profitability Comparison
- 6.4.2 Channel Revenue Mix
- 6.4.3 Geographic Revenue Exposure
- 6.4.4 R&D Intensity
- 6.4.5 Sustainability Maturity
- 6.5 Strategic Developments in Marine Active Ingredients (Last 24 Months)
- 6.5.1 Mergers, Acquisitions & Divestments
- 6.5.2 New Marine Active Ingredients Launches
- 6.5.3 Facility Expansions
- 6.5.4 Strategic Alliances, Joint Ventures & Partnerships
- 6.5.5 Distribution Expansion & Market Entry
- 6.5.6 Sustainability & ESG Initiatives
- 6.6 Competitive Strategy Mapping
- 6.6.1 Leader, Challenger, Follower & Niche Classification
- 6.6.2 Pricing Strategy Comparison
- 6.6.3 Channel Strategy Matrix
Note: Strategic developments are included based on their materiality and the availability of reliable information.
Chapter 7. Global Marine Active Ingredients Market – By Distribution Channel
- 7.1 Segment Overview
- 7.1.1 Volume & Revenue Split by Channel (2024 & 2032)
- 7.1.2 Channel Mix Evolution (2024-2032)
Chapter 8. Regional Market Analysis – Global Overview
- 8.1 Global Regional Overview
- 8.1.1 Regional Volume Share
- 8.1.2 Regional Revenue Share
- 8.1.3 Regional Volume by Region
- 8.1.4 Regional Revenue by Region
- 8.1.5 Regional Forecast Through 2032
- 8.2 Cross-Regional Segment Analysis
- 8.2.1 By Distribution Channel
- 8.2.2 By Brand/Price Tier
Chapter 9. North America Marine Active Ingredients Market
- 9.1 United States
- 9.2 Canada
- 9.3 Mexico
Chapter 10. Europe Marine Active Ingredients Market
- 10.1 Germany
- 10.2 France
- 10.3 Italy
- 10.4 United Kingdom
- 10.5 Spain
- 10.6 Poland
- 10.7 Russia
- 10.8 Netherlands
- 10.9 Belgium
- 10.10 Sweden
- 10.11 Denmark
- 10.12 Norway
- 10.13 Rest of Europe
Chapter 11. Asia Pacific Marine Active Ingredients Market
- 11.1 China
- 11.2 India
- 11.3 Japan
- 11.4 South Korea
- 11.5 Thailand
- 11.6 Indonesia
- 11.7 Vietnam
- 11.8 Malaysia
- 11.9 Australia
- 11.10 Rest of Asia Pacific
Chapter 12. Latin America Marine Active Ingredients Market
- 12.1 Brazil
- 12.2 Argentina
- 12.3 Colombia
- 12.4 Chile
- 12.5 Rest of Latin America
Chapter 13. Middle East Marine Active Ingredients Market
- 13.1 Saudi Arabia
- 13.2 United Arab Emirates
- 13.3 Turkey
- 13.4 Israel
- 13.5 Iran
- 13.6 Rest of the Middle East
Chapter 14. Africa Marine Active Ingredients Market
- 14.1 South Africa
- 14.2 Egypt
- 14.3 Nigeria
- 14.4 Morocco
- 14.5 Rest of Africa
Chapter 15. Marine Active Ingredients Company Profiles
- 15.1 [Company 01]
- 15.1.1 Company Overview
- 15.1.2 Key Management Personnel
- 15.1.3 Products & Services Portfolio
- 15.1.4 Financial Performance
- 15.1.5 Key Market Focus & Geographic Presence
- 15.1.6 Recent Developments & Strategic Initiatives
Note: The company profile list is preliminary and may change based on research findings, market developments, data availability, and client requirements.
Chapter 16. Appendices
- Appendix A – List of Abbreviations & Acronyms
- Appendix B – Industry Classification Code Reference – Full Series
- Appendix C – Production & Capacity Data Tables
- Appendix D – End-Use & Demand Base Tables
- Appendix E – Consumption & Replacement Rate Assumptions
- Appendix F – ASP Reference Tables
- Appendix G – Manufacturing & Facility Database
- Appendix H – Import-Export Data Tables
- Appendix I – Regulatory Summary Tables
- Appendix J – Primary Research Participant List (Anonymized)
- Appendix K – Primary Research Questionnaire Framework
- Appendix L – Data Sources & Bibliography
- Appendix M – Market Size Divergence & Source Comparison
Chapter 17. Research Methodology
- 17.1 Research Framework & Philosophy
- 17.2 Secondary Research – Sources, Hierarchy & Data Extraction
- 17.3 Data Modeling – Bottom-Up & Top-Down Market Sizing
- 17.4 Primary Research – Stakeholder Framework, LOI & Sample Sizes
- 17.5 Forecast Methodology – Regression, Scenario & Sensitivity Analysis
- 17.6 Quality Control – Four-Layer Validation Framework
- 17.7 Limitations & Standard Assumptions
- 17.8 Disclaimer
