
| REPORT ATTRIBUTE | DETAILS |
|---|---|
| Historical Period | 2020-2023 |
| Base Year | 2024 |
| Forecast Period | 2025-2032 |
| Marine Electric Vehicles Market Size 2024 | USD 8,673.2 million |
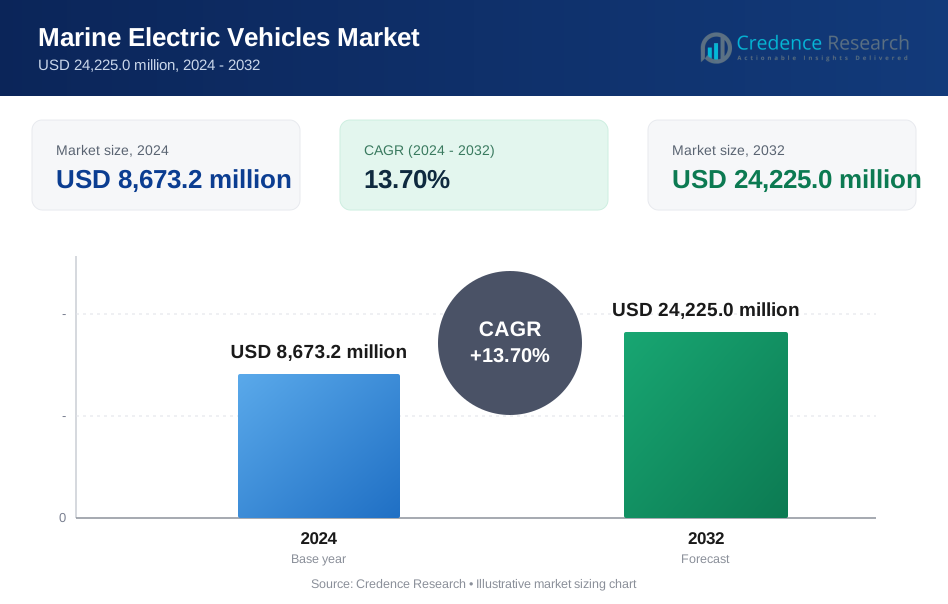
| Marine Electric Vehicles Market, CAGR | 13.70% |
| Marine Electric Vehicles Market Size 2032 | USD 24,225.0 million |
Market Overview:
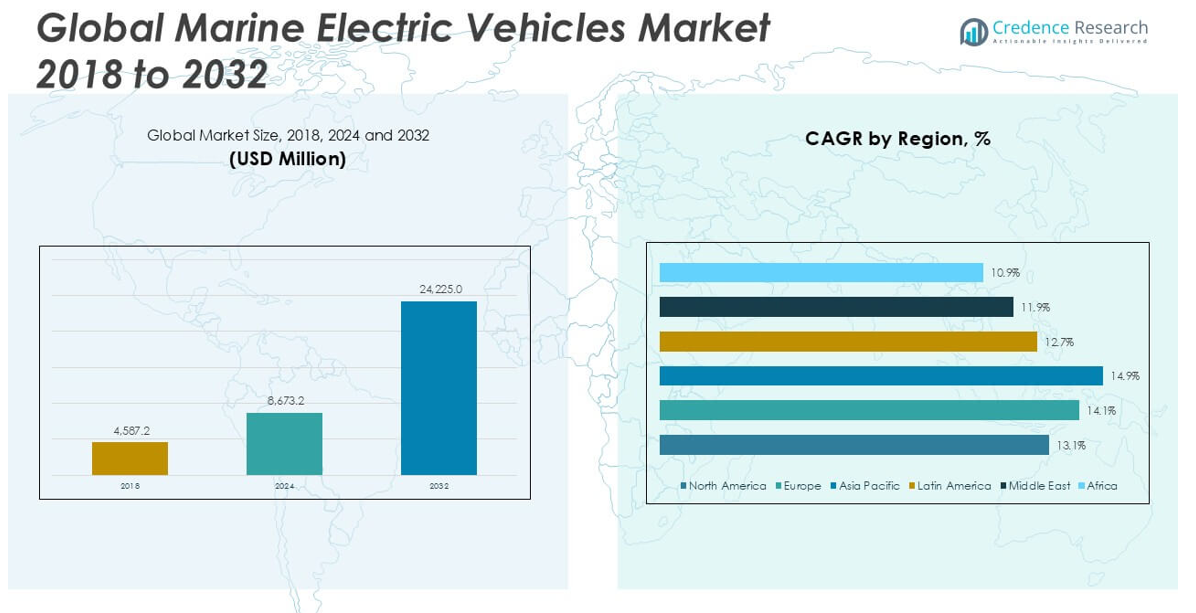
The Marine Electric Vehicles market size was valued at USD 4,587.2 million in 2018, reached USD 8,673.2 million in 2024, and is anticipated to reach USD 24,225.0 million by 2032, at a CAGR of 13.70% during the forecast period.
The Marine Electric Vehicles market is driven by prominent players such as ABB, Siemens AG, Wartsila, Kongsberg Gruppen, General Dynamics, Rolls-Royce, MAN Energy Solutions, Torqeedo (Deutz AG), Volvo Penta, Candela, BAE Systems, Groupe Beneteau, and Oceanvolt. These companies focus on expanding their electric propulsion portfolios, enhancing battery technologies, and forming strategic partnerships to strengthen their global presence. Europe leads the market with a 32.0% share in 2024, supported by strong regulatory frameworks and significant investments in green marine transportation. North America follows, holding 28.5% of the market, driven by technological innovation and increasing adoption of electric leisure and commercial vessels.
Market Insights
- The Marine Electric Vehicles market was valued at USD 4,587.2 million in 2018, reached USD 8,673.2 million in 2024, and is projected to reach USD 24,225.0 million by 2032, growing at a CAGR of 13.70% during the forecast period.
- The market is driven by rising environmental regulations and increasing demand for zero-emission vessels, encouraging rapid adoption of electric propulsion across military, commercial, and leisure applications.
- Growing marine electrification trends include the integration of smart technologies, expansion of charging infrastructure, and advancements in high-energy battery systems to support long-range operations.
- Leading players such as ABB, Siemens AG, Wartsila, and Rolls-Royce dominate the market through continuous innovation, strategic partnerships, and diversified electric propulsion offerings, while high initial costs and limited battery range remain key restraints.
- Europe holds the largest regional share at 32.0%, followed by North America at 28.5%, with the Battery Electric Vehicle segment leading the market by vehicle type.
Market Segmentation Analysis:
By Vehicle Type:
The Battery Electric Vehicle (BEV) segment dominates the Marine Electric Vehicles market, accounting for the largest market share in 2024. The rising demand for zero-emission vessels and the global push for reducing marine pollution drive the growth of this segment. BEVs offer lower operational costs, minimal maintenance, and complete elimination of fossil fuel dependency, making them highly attractive for commercial and leisure applications. Advancements in battery technologies, such as improved energy density and faster charging capabilities, further strengthen the position of BEVs over Plug-in Hybrid Electric Vehicles (PHEV) and Hybrid Electric Vehicles (HEV) in the market.
- For instance, Torqeedo’s Deep Blue electric drive system delivers up to 100 kW continuous power with a battery capacity of 40 kWh, providing robust performance for electric boats.
By Application:
The Leisure and Tourist Surface Boat segment holds the largest market share in the Marine Electric Vehicles market. Increasing consumer interest in sustainable recreational activities and the growing popularity of electric boats in tourism-centric coastal regions drive this segment's dominance. Operators prefer electric vessels for their quieter operation and environmental benefits, which enhance the passenger experience. Government initiatives promoting green tourism and the expansion of rental and charter services for electric boats further support the growth of this application segment, surpassing the military, autonomous underwater, and submarine categories in market contribution.
- For instance, Candela’s C-8 electric hydrofoil leisure boat offers a top speed of 30 knots and a range of 50 nautical miles on a single charge, providing a fully electric, high-performance experience for recreational users.
By Platform:
On-Water Platforms lead the Marine Electric Vehicles market with the highest market share, driven by their wide adoption in passenger ferries, leisure boats, and military workboats. These platforms benefit from the rising demand for low-noise, emission-free vessels suitable for both commercial and recreational use. The increasing focus on electrification across ports and coastal regions enhances the feasibility of on-water electric transportation. Unlike underwater platforms, which cater to niche applications such as autonomous and personal submarines, on-water platforms continue to expand rapidly due to regulatory support, technological advancements, and growing consumer preference for sustainable marine transport solutions.
Market Overview
Rising Environmental Regulations and Emission Standards
Stringent environmental regulations and growing pressure to reduce carbon emissions significantly drive the Marine Electric Vehicles market. Governments and international bodies, including the International Maritime Organization (IMO), are enforcing emission limits that compel the marine industry to shift towards electric propulsion. These regulations are accelerating the adoption of electric and hybrid vessels as shipowners seek compliance to avoid penalties and benefit from operational incentives. This regulatory push is not only promoting sustainable marine practices but also creating substantial growth opportunities for electric marine vehicle manufacturers.
- For instance, ABB delivered a fully electric ferry, Ellen, which operates between Danish islands and reduces annual carbon dioxide emissions by approximately 2,000 tonnes, achieving zero-emission transportation.
Technological Advancements in Battery and Propulsion Systems
Rapid advancements in battery technologies and electric propulsion systems are fueling the growth of the Marine Electric Vehicles market. Modern lithium-ion batteries offer higher energy density, faster charging, and extended operational ranges, making electric vessels more practical and competitive with traditional fuel-powered ships. Additionally, innovations in electric drivetrains and lightweight materials contribute to improved vessel efficiency and performance. These technological breakthroughs are reducing the limitations of early marine electric vehicles, enabling broader adoption across commercial, leisure, and military applications.
- For instance, Siemens provided an electric propulsion system for the eFerry Ellen with a battery capacity of 4.3 MWh, enabling a range of up to 22 nautical miles per charge, showcasing significant advancements in maritime battery technology.
Increasing Demand for Sustainable Marine Tourism
The growing popularity of eco-friendly marine tourism is a major growth driver in the Marine Electric Vehicles market. Tour operators and consumers increasingly prefer electric boats for sightseeing and recreational activities due to their silent operation and zero-emission benefits. Coastal cities and island destinations are promoting electric marine transport to preserve natural ecosystems and enhance visitor experiences. This trend is stimulating demand for electric ferries, leisure boats, and passenger vessels, encouraging manufacturers to develop solutions that cater to the evolving preferences of environmentally conscious tourists.
Key Trends & Opportunities
Expansion of Charging Infrastructure
The expansion of marine charging infrastructure presents a significant growth opportunity for the Marine Electric Vehicles market. Ports and marinas worldwide are investing in fast-charging stations and shore power solutions to support the rising number of electric vessels. This development enhances the practicality of using electric marine vehicles for longer routes and commercial operations. As infrastructure improves, the marine industry is likely to see a surge in electric vessel adoption across diverse regions, reducing range anxiety and increasing operational convenience.
- For instance, the Port of Oslo has implemented a fully operational shore power system capable of supplying up to 2.5 MW to electric ferries, significantly reducing in-port emissions and supporting regular charging for daily ferry operations.
Integration of Autonomous and Smart Technologies
The integration of autonomous navigation and smart energy management systems is an emerging trend shaping the Marine Electric Vehicles market. Electric vessels are increasingly equipped with automated systems that optimize energy consumption and support remote monitoring. These smart technologies improve operational efficiency, enhance safety, and lower costs by reducing manual intervention. The combination of electric propulsion with autonomous capabilities is gaining interest from defense, commercial, and research sectors, opening new avenues for innovation and specialized vessel development.
- For instance, Kongsberg developed the YARA Birkeland, the world’s first fully electric and autonomous container ship, which can carry 120 TEU and is equipped with advanced sensors and automated navigation systems.
Key Challenges
High Initial Investment Costs
One of the primary challenges facing the Marine Electric Vehicles market is the high initial cost of electric vessels compared to traditional counterparts. The expense associated with advanced batteries, specialized propulsion systems, and supporting infrastructure can deter small operators and price-sensitive customers. Although operational savings over time can offset these costs, the upfront financial burden remains a critical barrier to widespread adoption, particularly in developing regions with limited government subsidies or financing options.
Limited Range and Operational Capacity
The limited range and battery capacity of marine electric vehicles pose significant operational challenges, especially for long-distance commercial shipping. Current battery technologies still struggle to meet the energy demands of large vessels traveling extended routes. This constraint restricts electric marine vehicles to short-haul and nearshore applications, limiting their market penetration in major shipping sectors. Ongoing research and development efforts aim to improve range and charging efficiency, but these limitations currently hinder large-scale industry transformation.
Inadequate Global Charging Infrastructure
The insufficient availability of marine charging stations, especially in remote and less-developed port areas, presents a major hurdle for the Marine Electric Vehicles market. Without reliable and widespread charging networks, operators face operational constraints that can impact scheduling and route planning. This infrastructure gap discourages investment in electric fleets and delays the transition from fossil-fuel-based vessels. Developing standardized, accessible charging solutions is essential to support the seamless operation and long-term viability of electric marine transportation.
Regional Analysis
North America
North America accounted for approximately 28.5% of the Marine Electric Vehicles market share in 2024, with a market size of USD 2,471.9 million, growing from USD 1,431.2 million in 2018. The market is projected to reach USD 6,056.2 million by 2032, expanding at a CAGR of 13.1% during the forecast period. The region’s growth is driven by stringent emission regulations, rising investments in electric marine technologies, and a strong focus on sustainable maritime solutions. The increasing adoption of electric ferries and recreational boats further strengthens North America’s position in the global market.
Europe
Europe held a significant 32.0% market share in 2024, with its Marine Electric Vehicles market valued at USD 2,775.4 million, up from USD 1,330.3 million in 2018. The region is expected to reach USD 8,115.4 million by 2032, registering the second-highest CAGR of 14.1%. Europe’s leadership in clean energy policies and its proactive electrification of public and commercial marine transport support this growth. The presence of key marine electric vehicle manufacturers and robust charging infrastructure across major ports also contribute to the region’s expanding market share.
Asia Pacific
Asia Pacific captured approximately 25.0% of the global Marine Electric Vehicles market in 2024, with a market value of USD 2,168.3 million, increasing from USD 1,091.8 million in 2018. The region is anticipated to reach USD 7,025.2 million by 2032, growing at the fastest CAGR of 14.9%. The rapid expansion is driven by the region’s large coastal economies, growing maritime trade, and supportive government initiatives for green shipping. Countries like China, Japan, and South Korea are investing heavily in electric vessel development, enhancing Asia Pacific’s competitive edge in the global market.
Latin America
Latin America represented about 4.8% of the Marine Electric Vehicles market share in 2024, with the market growing from USD 247.7 million in 2018 to USD 416.3 million in 2024. The market is forecasted to reach USD 1,259.7 million by 2032, advancing at a CAGR of 12.7%. The region is gradually adopting electric marine solutions, driven by increasing awareness of environmental sustainability and the growing use of electric boats in tourism. While Latin America is still an emerging market in this sector, ongoing infrastructure improvements are expected to support future growth.
Middle East
The Middle East held around 6.4% of the global Marine Electric Vehicles market in 2024, with a market size of USD 555.1 million, up from USD 321.1 million in 2018. It is projected to grow to USD 1,405.0 million by 2032, at a CAGR of 11.9%. The region’s growth is supported by the rising demand for electric leisure boats and port electrification initiatives, particularly in tourist hotspots. Although currently a smaller market compared to North America and Europe, the Middle East shows potential for gradual expansion as sustainability becomes a priority in marine transport.
Africa
Africa accounted for approximately 3.3% of the Marine Electric Vehicles market share in 2024, with the market growing from USD 165.1 million in 2018 to USD 286.2 million in 2024. The market is expected to reach USD 363.4 million by 2032, registering the slowest CAGR of 10.9%. The region’s adoption of marine electric vehicles remains limited due to infrastructure constraints and high upfront costs. However, increasing awareness of environmental impacts and the introduction of small-scale electric ferry projects in select areas indicate steady but modest growth potential in the coming years.
Market Segmentations:
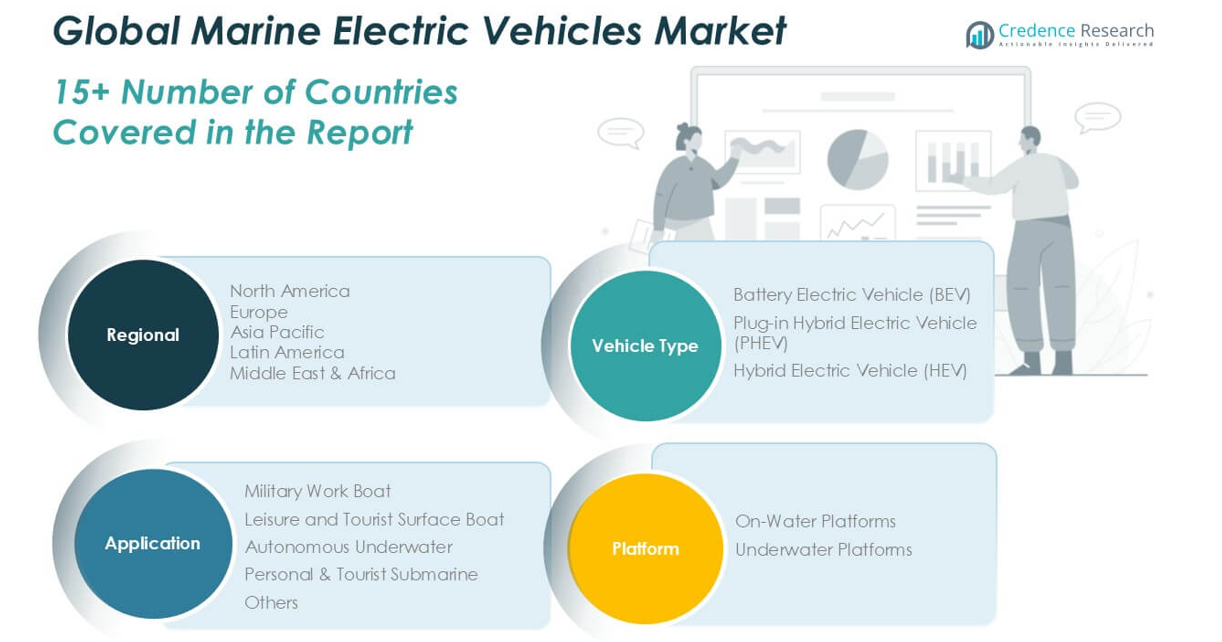
By Vehicle Type
- Battery Electric Vehicle (BEV)
- Plug-in Hybrid Electric Vehicle (PHEV)
- Hybrid Electric Vehicle (HEV)
By Application
- Military Work Boat
- Leisure and Tourist Surface Boat
- Autonomous Underwater
- Personal & Tourist Submarine
- Others
By Platform
- On-Water Platforms
- Underwater Platforms
By Geography
- North America
- U.S.
- Canada
- Mexico
- Europe
- Germany
- France
- U.K.
- Italy
- Spain
- Rest of Europe
- Asia Pacific
- China
- Japan
- India
- South Korea
- South-east Asia
- Rest of Asia Pacific
- Latin America
- Brazil
- Argentina
- Rest of Latin America
- Middle East & Africa
- GCC Countries
- South Africa
- Rest of the Middle East and Africa
Competitive Landscape
The Marine Electric Vehicles market is highly competitive, with key players focusing on technological advancements, strategic partnerships, and product innovations to strengthen their market positions. Leading companies such as ABB, Siemens AG, Wartsila, and Kongsberg Gruppen are heavily investing in electric propulsion systems, smart marine technologies, and energy-efficient solutions. These players are leveraging their global presence and engineering expertise to offer integrated electric marine platforms that address the rising demand for sustainable maritime transportation. Companies like Rolls-Royce, MAN Energy Solutions, and Torqeedo (Deutz AG) are actively expanding their electric vessel portfolios to cater to commercial, leisure, and defense applications. Additionally, emerging companies such as Candela, Oceanvolt, and Groupe Beneteau are gaining traction by developing innovative electric boats and enhancing the consumer experience in recreational segments. The competitive landscape is shaped by continuous R&D, regulatory compliance efforts, and the race to build efficient charging infrastructures, with companies striving to capture early market advantages.
Key Player Analysis
- ABB
- Siemens AG
- Wartsila
- Kongsberg Gruppen
- General Dynamics
- Rolls-Royce
- MAN Energy Solutions
- Torqeedo (Deutz AG)
- Volvo Penta
- Candela
- BAE Systems
- Groupe Beneteau
- Oceanvolt
- Eppendorf SE
Recent Developments
- In October 2024, The Indian Register of Shipping (IRS) entered into a memorandum of understanding (MoU) with Singapore-based naval architecture firm SeaTech Solutions International. This collaboration paves the way for Indian shipyards to construct electric-powered tugboats. The agreement encompasses design, engineering, and classification aspects of advanced green tugs and harbor vessels, with a focus on global deployment and manufacturing in India.
- In February 2024, Garden Reach Shipbuilders and Engineers (GRSE) in India unveiled its first fully electric ferry, named Dheu, for the Government of West Bengal. This 24-meter catamaran vessel, designed to accommodate 150 passengers, is intended for inland waterway operations. Dheu marks GRSE's debut in fully electric ferries and is the second such vessel to operate in India. The project aims to enhance passenger transport efficiency along central waterways, with the ferry expected to complete around 40 trips each day.
- In March 2023, Wärtsilä supplied the main propulsion machinery along with a range of other electrical solutions for two new 110-meter-long amphibious transport vessels that were built for the Chilean Navy.
- In February 2023, Kongsberg Maritime (KONGSBERG) announced it would provide electrical solutions to a newbuild ship named SDO-SuRS (Special and Diving Operations - Submarine Rescue Ship) to be built by the Italian shipyard T.Mariotti for Marina Militare Italiana (The Italian Navy).
- In February 2023, GE's subsidiary in India announced that it had signed a contract with Cochin Shipyard to provide a digital solutions package to increase the capabilities of the LM2500 marine gas turbines that will power the Indian Navy's first Indigenous Aircraft Carrier-1 (IAC-1) Vikrant, which was commissioned in August 2022.
Market Concentration & Characteristics
The Marine Electric Vehicles Market is moderately concentrated, with a mix of global leaders and emerging players competing to expand their market share. It is characterized by a strong focus on innovation, driven by stringent environmental regulations and the growing demand for sustainable marine transport solutions. Leading companies invest heavily in electric propulsion systems, battery advancements, and smart energy management technologies to differentiate their offerings. The market shows a growing trend towards integrated solutions, combining electric drivetrains with autonomous and energy-efficient systems. It remains capital-intensive, with high initial investment costs limiting rapid adoption across smaller operators. The market exhibits steady growth supported by expanding infrastructure and increasing regulatory support.
Report Coverage
The research report offers an in-depth analysis based on Vehicle Type, Application, Platform and Geography. It details leading market players, providing an overview of their business, product offerings, investments, revenue streams, and key applications. Additionally, the report includes insights into the competitive environment, SWOT analysis, current market trends, as well as the primary drivers and constraints. Furthermore, it discusses various factors that have driven market expansion in recent years. The report also explores market dynamics, regulatory scenarios, and technological advancements that are shaping the industry. It assesses the impact of external factors and global economic changes on market growth. Lastly, it provides strategic recommendations for new entrants and established companies to navigate the complexities of the market.
Future Outlook
- The Marine Electric Vehicles market is expected to witness steady growth driven by increasing global demand for zero-emission marine transportation.
- Rising investments in advanced battery technologies will continue to enhance vessel range and operational efficiency.
- Governments worldwide are likely to introduce stricter environmental regulations promoting the adoption of electric marine solutions.
- The expansion of marine charging infrastructure will support the growth of electric vessels in both commercial and leisure sectors.
- Technological integration of autonomous navigation and smart energy management systems will gain more traction.
- Market competition is expected to intensify as more players enter the electric marine space with innovative product offerings.
- The demand for electric leisure and tourist boats will continue to grow, particularly in coastal and island regions.
- Commercial shipping companies may increasingly adopt hybrid and fully electric vessels for short-haul routes.
- High initial investment costs and limited charging networks will remain key challenges in developing economies.
- Continuous research and development efforts will focus on improving battery capacity, reducing charging time, and lowering system costs.
Request a Free Sample
Fill in your details and we'll send you a free sample report.
- Sample data tables & charts
- Research methodology
Need a Custom Version of This Report?
Tailor the scope, geography, or segments to your exact requirements.
- Custom geography or segment scope
- Direct access to our analyst team
Frequently Asked Questions
What is the current size of the Marine Electric Vehicles Market?
What are the key segments within the Marine Electric Vehicles Market?
What are some challenges faced by the Marine Electric Vehicles Market?
Who are the major players in the Marine Electric Vehicles Market?
Table of Content
Chapter 1. Report Introduction
- 1.1 Report Description & Purpose
- 1.1.1 Report Title & Market Definition
- 1.1.2 Unique Selling Propositions (USP) & Key Differentiators
- 1.1.3 Value Proposition for Stakeholders
- 1.2 Research Objectives
- 1.2.1 Market Sizing Objectives (Volume & Revenue) (Volume Where Applicable)
- 1.2.2 Segmentation Objectives
- 1.2.3 Competitive Intelligence Objectives
- 1.2.4 Forecast & Scenario Objectives
- 1.3 Report Scope
- 1.3.1 Marine Electric Vehicles Scope – Segments & Subsegments Covered
- 1.3.2 Geographic Scope – Regions & Countries Covered
- 1.3.3 Historical Period, Base Year & Forecast Period (2024; forecast to 2032)
- 1.3.4 Inclusions & Exclusions
- 1.4 Industry Classification & Applicable Codes
- 1.5 Currency, Measurement Units & Valuation Basis
- 1.6 Target Stakeholders
- 1.7 Limitations & Assumptions
Chapter 2. Executive Summary
- 2.1 Global Marine Electric Vehicles Market Snapshot
- 2.1.1 Market Size – Historical (2024) & Forecast (2024-2032) (2024: USD 8,673.2 million → 2032: USD 24,225.0 million)
- 2.1.2 Volume & Revenue – Global Totals (Volume Where Applicable)
- 2.1.3 Key Market Highlights – Top Five Facts
- 2.2 Marine Electric Vehicles Market Segmentation Snapshot
- 2.2.1 Market Split by Region – 2024 vs. 2032
- 2.3 Competitive Snapshot
- 2.3.1 Top 10 Players by Revenue Share – 2024
- 2.3.2 Top 10 Players by Volume Share – 2024 (Volume Where Applicable)
- 2.3.3 Recent Strategic Developments (18-Month Summary)
- 2.4 Key Investment Highlights & Strategic Conclusions
Chapter 3. Marine Electric Vehicles Market Dynamics & Industry Analysis
- 3.1 Market Overview & Context
- 3.1.1 Marine Electric Vehicles Market Position in the Broader Industry Value Chain
- 3.1.2 Demand Structure & Purchasing Dynamics
- 3.1.3 Market Maturity & Development Stage by Region
- 3.2 Marine Electric Vehicles Market Drivers
- 3.3 Marine Electric Vehicles Market Restraints & Challenges
- 3.4 Marine Electric Vehicles Market Opportunities
- 3.5 Porter's Five Forces Analysis
- 3.5.1 Threat of New Entrants
- 3.5.2 Bargaining Power of Suppliers
- 3.5.3 Bargaining Power of Buyers
- 3.5.4 Threat of Substitutes
- 3.5.5 Competitive Rivalry – Intensity Assessment
- 3.6 Marine Electric Vehicles Value Chain Analysis
- 3.6.1 Upstream – Key Inputs, Resources & Suppliers
- 3.6.1.1 Key Input/Resource 1
- 3.6.1.2 Key Input/Resource 2
- 3.6.1.3 Key Input/Resource 3
- 3.6.2 Midstream – Core Operations & Value Creation
- 3.6.2.1 Operating Model & Process Overview
- 3.6.2.2 Key Operating Locations & Capabilities by Company
- 3.6.3 Downstream – Market Channels & End Users
- 3.6.3.1 Direct Sales & Customer Engagement Channels
- 3.6.3.2 Indirect Sales, Intermediaries & Partner Channels
- 3.6.4 Value Chain Profitability Analysis
- 3.6.1 Upstream – Key Inputs, Resources & Suppliers
- 3.7 PESTEL Analysis
- 3.7.1 Political Factors
- 3.7.2 Economic Factors
- 3.7.3 Social Factors
- 3.7.4 Technological Factors
- 3.7.5 Environmental Factors
- 3.7.6 Legal Factors
- 3.8 Marine Electric Vehicles Supply Chain Analysis
- 3.8.1 Critical Input & Resource Availability Risk Assessment
- 3.8.2 Supplier & Operational Concentration Risk (Geographic Exposure)
- 3.8.3 Supply & Service Disruption Impact Analysis
- 3.9 Regulatory & Policy Landscape
Note: The regulatory and policy landscape section covers regulations based on their applicability to the market, Marine Electric Vehicles category, geography, and scope of the study. Only regulatory frameworks with a material impact on operations, compliance, trade, sustainability, or market access are analyzed in detail.
Chapter 4. Key Investment Pockets & Opportunity Analysis
- 4.1 Marine Electric Vehicles Market Attractiveness Analysis
- 4.1.1 By Region – Investment Attractiveness Matrix (Market Size × CAGR)
- 4.2 Absolute Revenue Growth Opportunity
- 4.2.1 By Region – Absolute Revenue Growth Through 2032
- 4.3 Incremental Demand Opportunity
- 4.3.1 By Region – Incremental Demand Through 2032
- 4.3.2 Segment – Incremental Demand
- 4.4 Emerging Submarket Opportunity Deep Dive (Subject to Applicability)
- 4.5 Priority Market Opportunity Scorecards
- 4.5.1 United States
- 4.5.2 Europe
- 4.5.3 Asia
- 4.5.4 Middle East & Africa
Note: Priority market opportunity scorecards reflect the geographic scope and strategic relevance of the study. Listed markets are indicative and may be adapted to the industry.
Chapter 5. Marine Electric Vehicles Cross-Border Trade & Market Access Analysis
- 5.1 International Trade & Cross-Border Activity Overview
- 5.1.1 Global Export Value by Country (2024)
- 5.1.2 Global Export Volume by Country (2024) (Volume Where Applicable)
- 5.1.3 Global Import Value by Country (2024)
- 5.1.4 Global Import Volume by Country (2024) (Volume Where Applicable)
- 5.1.5 Net Trade Balance by Country (2024)
- 5.2 Export Analysis – Segment
- 5.2.1 Category 1 (Applicable Classification Code)
- 5.2.2 Category 2 (Applicable Classification Code)
- 5.2.3 Category 3 (Applicable Classification Code)
- 5.2.4 Category 4 (Applicable Classification Code)
- 5.2.5 Category 5 (Applicable Classification Code)
- 5.3 Import Analysis – Segment
- 5.3.1 Category 1 (Applicable Classification Code)
- 5.3.2 Category 2 (Applicable Classification Code)
- 5.3.3 Category 3 (Applicable Classification Code)
- 5.3.4 Category 4 (Applicable Classification Code)
- 5.3.5 Category 5 (Applicable Classification Code)
- 5.4 Cross-Border Pricing & Transaction Benchmarks
- 5.4.1 Export Pricing – Segment & Country
- 5.4.2 Import Pricing – Segment & Source Country
- 5.4.3 Price Trends (2024)
- 5.5 Key Cross-Border Trade & Delivery Routes
- 5.5.1 Cross-Border Trade/Delivery Route 1
- 5.5.2 Cross-Border Trade/Delivery Route 2
- 5.5.3 Cross-Border Trade/Delivery Route 3
- 5.5.4 Cross-Border Trade/Delivery Route 4
- 5.5.5 Cross-Border Trade/Delivery Route 5
- 5.6 Trade Policy & Market Access Impact Assessment
- 5.6.1 Tariff & Non-Tariff Barriers
- 5.6.2 Regional Trade & Economic Integration Frameworks
- 5.6.3 Bilateral & Multilateral Trade Agreements
- 5.6.4 Cross-Border Operating, Licensing & Localization Requirements
Note: This chapter applies where cross-border trade or delivery is relevant to Marine Electric Vehicles. Goods, services, and digital offerings are assessed using applicable classifications and transaction measures. Import-export volumes, trade balances, and route analyses are included only where meaningful to the market.
Chapter 6. Competitive Landscape & Company Benchmarking
- 6.1 Marine Electric Vehicles Market Concentration & Structure
- 6.1.1 Herfindahl-Hirschman Index (HHI) – vs. 2024
- 6.1.2 Leading, Mid-Sized & Emerging Player Structure
- 6.1.3 Global, Regional & Local Player Dynamics
- 6.2 Marine Electric Vehicles Market Share Analysis – 2024
- 6.2.1 Global Revenue Share by Company
- 6.2.2 Global Volume Share by Company (Volume Where Applicable)
- 6.2.3 Regional Revenue Share
- 6.2.4 Market Share Evolution ( vs. 2024)
- 6.2.5 Company Market Share by Key Segment
- 6.2.6 Company Market Share by Customer Group
- 6.3 Operating Scale, Capacity & Infrastructure Analysis
- 6.3.1 Global Operating Scale & Supply Capacity
- 6.3.2 Resource Utilization & Operating Efficiency
- 6.3.3 Output, Service Delivery & Activity Metrics
- 6.3.4 Operating Footprint & Infrastructure Map
- 6.3.5 Planned Operational & Capacity Expansion
- 6.4 Marine Electric Vehicles Competitive Benchmarking Matrix
- 6.4.1 Revenue, Growth, Profitability & Operating Metric Comparison
- 6.4.2 Channel Revenue Mix
- 6.4.3 Geographic Revenue Exposure
- 6.4.4 R&D Intensity
- 6.4.5 Sustainability Maturity
- 6.5 Strategic Developments in Marine Electric Vehicles (Last 24 Months)
- 6.5.1 Mergers, Acquisitions & Divestments
- 6.5.2 New Products, Services & Solutions in Marine Electric Vehicles
- 6.5.3 Operational & Infrastructure Expansions
- 6.5.4 Strategic Alliances, Joint Ventures & Partnerships
- 6.5.5 Distribution Expansion & Market Entry
- 6.5.6 Sustainability & ESG Initiatives
- 6.6 Competitive Strategy Mapping
- 6.6.1 Leader, Challenger, Follower & Niche Classification
- 6.6.2 Pricing Strategy Comparison
- 6.6.3 Channel Strategy Matrix
Note: Strategic developments are included based on their materiality and the availability of reliable information.
Chapter 7. Global Marine Electric Vehicles Market – By Sales & Delivery Channel
- 7.1 Segment Overview
- 7.1.1 Volume & Revenue Split by Channel (2024 & 2032) (Volume Where Applicable)
- 7.1.2 Channel Mix Evolution (2024-2032)
Chapter 8. Regional Market Analysis – Global Overview
- 8.1 Global Regional Overview
- 8.1.1 Regional Volume Share (Volume Where Applicable)
- 8.1.2 Regional Revenue Share
- 8.1.3 Regional Volume by Region (Volume Where Applicable)
- 8.1.4 Regional Revenue by Region
- 8.1.5 Regional Forecast Through 2032
- 8.2 Cross-Regional Segment Analysis
- 8.2.1 By Sales & Delivery Channel
- 8.2.2 By Competitive Positioning & Price Tier
Chapter 9. North America Marine Electric Vehicles Market
- 9.1 United States
- 9.2 Canada
- 9.3 Mexico
Chapter 10. Europe Marine Electric Vehicles Market
- 10.1 Germany
- 10.2 France
- 10.3 Italy
- 10.4 United Kingdom
- 10.5 Spain
- 10.6 Poland
- 10.7 Russia
- 10.8 Netherlands
- 10.9 Belgium
- 10.10 Sweden
- 10.11 Denmark
- 10.12 Norway
- 10.13 Rest of Europe
Chapter 11. Asia Pacific Marine Electric Vehicles Market
- 11.1 China
- 11.2 India
- 11.3 Japan
- 11.4 South Korea
- 11.5 Thailand
- 11.6 Indonesia
- 11.7 Vietnam
- 11.8 Malaysia
- 11.9 Australia
- 11.10 Rest of Asia Pacific
Chapter 12. Latin America Marine Electric Vehicles Market
- 12.1 Brazil
- 12.2 Argentina
- 12.3 Colombia
- 12.4 Chile
- 12.5 Rest of Latin America
Chapter 13. Middle East Marine Electric Vehicles Market
- 13.1 Saudi Arabia
- 13.2 United Arab Emirates
- 13.3 Turkey
- 13.4 Israel
- 13.5 Iran
- 13.6 Rest of the Middle East
Chapter 14. Africa Marine Electric Vehicles Market
- 14.1 South Africa
- 14.2 Egypt
- 14.3 Nigeria
- 14.4 Morocco
- 14.5 Rest of Africa
Chapter 15. Marine Electric Vehicles Company Profiles
- 15.1 [Company 01]
- 15.1.1 Company Overview
- 15.1.2 Key Management Personnel
- 15.1.3 Products & Services Portfolio
- 15.1.4 Financial Performance
- 15.1.5 Key Market Focus & Geographic Presence
- 15.1.6 Recent Developments & Strategic Initiatives
Note: The company profile list is preliminary and may change based on research findings, market developments, data availability, and client requirements.
Chapter 16. Appendices
- Appendix A – List of Abbreviations & Acronyms
- Appendix B – Industry Classification Code Reference – Full Series
- Appendix C – Supply, Output & Operating Capacity Data Tables
- Appendix D – End-Use & Demand Base Tables
- Appendix E – Demand, Adoption & Usage Assumptions
- Appendix F – Pricing & Revenue Metric Reference Tables
- Appendix G – Company Operations & Infrastructure Database
- Appendix H – Cross-Border Trade & Activity Data Tables (Where Applicable)
- Appendix I – Regulatory Summary Tables
- Appendix J – Primary Research Participant List (Anonymized)
- Appendix K – Primary Research Questionnaire Framework
- Appendix L – Data Sources & Bibliography
- Appendix M – Market Size Divergence & Source Comparison
Chapter 17. Research Methodology
- 17.1 Research Framework & Philosophy
- 17.2 Secondary Research – Sources, Hierarchy & Data Extraction
- 17.3 Data Modeling – Bottom-Up & Top-Down Market Sizing
- 17.4 Primary Research – Stakeholder Framework, LOI & Sample Sizes
- 17.5 Forecast Methodology – Regression, Scenario & Sensitivity Analysis
- 17.6 Quality Control – Four-Layer Validation Framework
- 17.7 Limitations & Standard Assumptions
- 17.8 Disclaimer
