
Nanoparticle Formulation Market Overview:
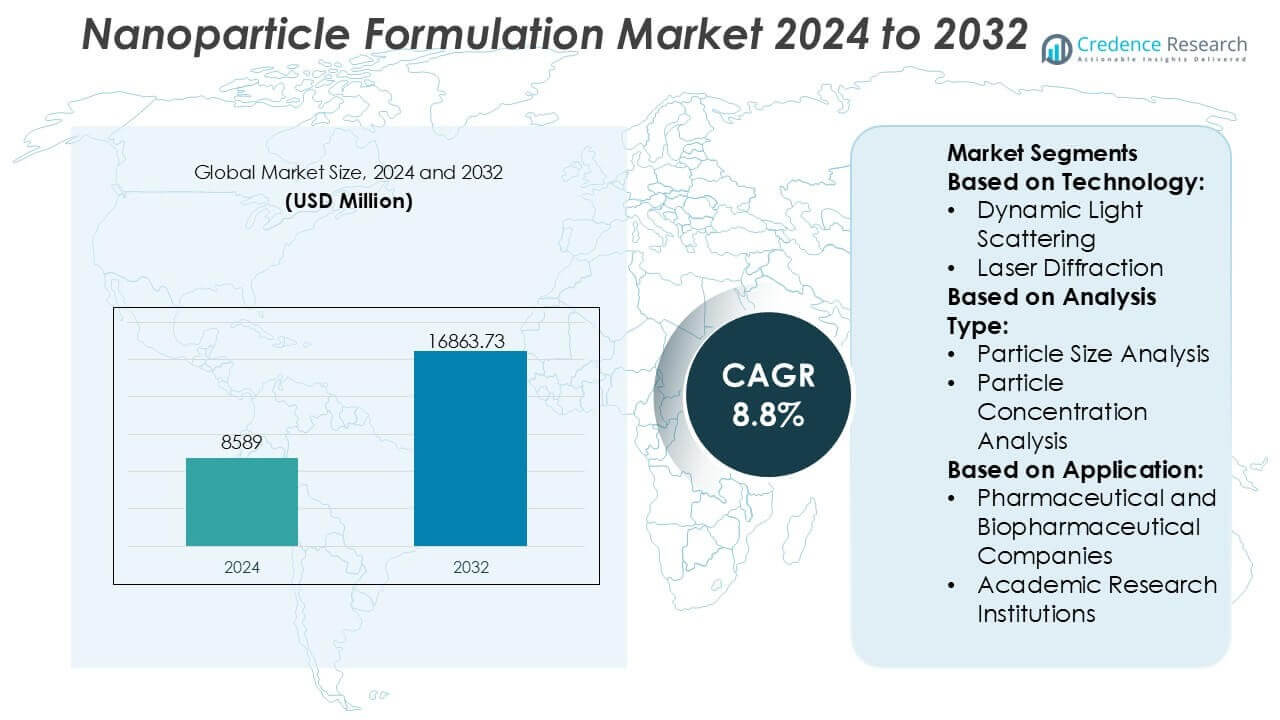
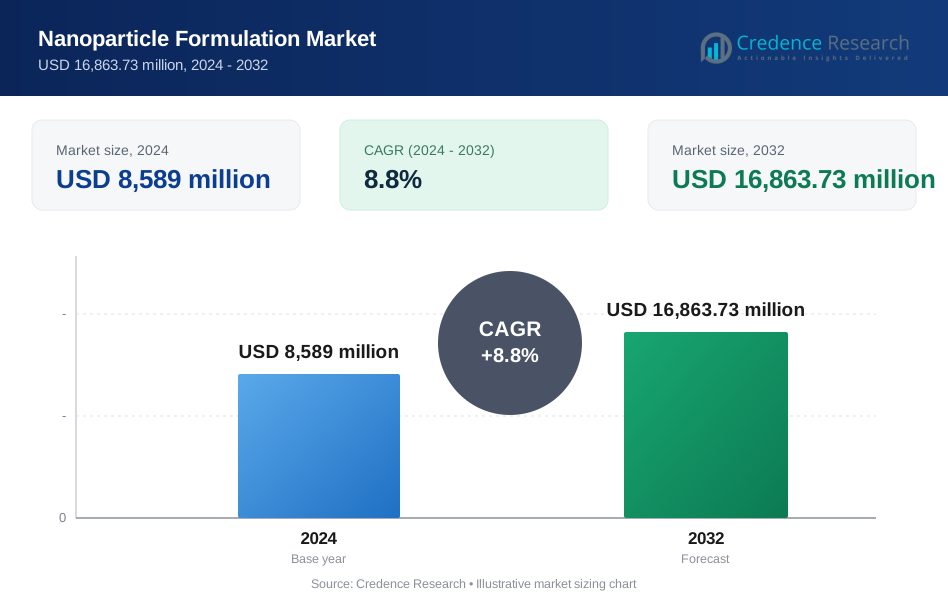
Nanoparticle Formulation Market size was valued USD 8589 million in 2024 and is anticipated to reach USD 16863.73 million by 2032, at a CAGR of 8.8% during the forecast period.
| REPORT ATTRIBUTE | DETAILS |
|---|---|
| Historical Period | 2020-2023 |
| Base Year | 2024 |
| Forecast Period | 2025-2032 |
| Nanoparticle Formulation Market Size 2024 | USD 8589 million |
| Nanoparticle Formulation Market, CAGR | 8.8% |
| Nanoparticle Formulation Market Size 2032 | USD 16863.73 million |
Nanoparticle Formulation Market Insights
- Market growth is primarily driven by rising adoption of nanoparticles in drug delivery, biopharmaceutical development, and advanced biomedical applications requiring precise particle size and stability control.
- Key market trends include increasing demand for customized formulations, integration of advanced analytical techniques, and growing use of nanoparticles beyond pharmaceuticals into medical devices and advanced materials.
- The competitive landscape is marked by specialized players focusing on high-purity materials, scalable synthesis technologies, and reproducible particle formulation supported by strong R&D investments and collaborations.
- Regionally, North America leads with an exact 38% market share, while particle size analysis remains the dominant segment due to its critical role in quality control and regulatory compliance.
Nanoparticle Formulation Market Segmentation Analysis:
By Technology
Within the technology segment of the nanoparticle formulation market, Dynamic Light Scattering (DLS) emerges as the dominant sub-segment, accounting for an estimated around 38% market share. Its leadership is driven by rapid measurement capability, high sensitivity for sub-micron particles, and widespread adoption in routine nanoparticle characterization workflows. DLS enables precise hydrodynamic diameter assessment with minimal sample preparation, making it highly suitable for pharmaceutical and biopharmaceutical formulations. Laser Diffraction and Nanoparticle Tracking Analysis follow, supported by broader size-range measurement and real-time particle tracking, while advanced techniques such as Resonant Mass Measurement, Microscopy, and X-Ray Diffraction remain essential for specialized structural and mass-based analyses.
- For instance, Nanophase Technologies Corporation applies DLS extensively to validate its proprietary Physical Vapor Synthesis (PVS) process, routinely characterizing oxide nanoparticles with mean particle sizes controlled below 50 nanometers and batch-to-batch standard deviations maintained within a few nanometers.
By Analysis Type
By analysis type, Particle Size Analysis dominates the market with an estimated approximately 42% share, reflecting its critical role in determining stability, bioavailability, and performance of nanoparticle-based formulations. Consistent particle size distribution is a key regulatory and quality requirement, particularly in drug delivery and nanomedicine applications. Complementary techniques such as Zeta Potential Analysis support surface charge and stability assessment, while Particle Concentration and Shape Analysis gain traction in advanced formulation optimization. Molecular Structure, Molecular Weight, and Flow Property Analyses serve niche but essential roles in complex nanoparticle systems requiring in-depth physicochemical profiling.
- For instance, US Research Nanomaterials, Inc. routinely characterizes engineered nanoparticles using laser-based particle size analysis to certify material grades with nominal particle sizes such as 20 nm, 50 nm, and 100 nm, while maintaining documented size distribution widths below 15 nanometers across production lots.
By Application
In terms of application, Pharmaceutical and Biopharmaceutical Companies represent the dominant sub-segment, contributing an estimated around 45% market share. This dominance is driven by the extensive use of nanoparticles in drug delivery, vaccine formulation, and targeted therapeutics, where precise characterization is mandatory for regulatory approval. These companies invest heavily in advanced analytical platforms to ensure batch consistency and clinical performance. Academic Research Institutions and Public and Private Research Institutions follow, fueled by nanotechnology research funding, while Medical Device Companies increasingly adopt nanoparticle analysis for coatings, diagnostics, and implantable materials.
Key Growth Drivers
Rising Adoption of Nanotechnology in Drug Delivery
The growing integration of nanotechnology into drug delivery systems is a primary growth driver for the nanoparticle formulation market. Nanoparticles enhance solubility, bioavailability, and targeted delivery of active pharmaceutical ingredients, addressing limitations of conventional formulations. Their ability to enable controlled release and site-specific action supports improved therapeutic efficacy and reduced side effects. Increasing development of nanoparticle-based oncology, vaccine, and gene therapy products further accelerates demand for advanced formulation and characterization solutions across pharmaceutical and biopharmaceutical pipelines.
- For instance, SkySpring Nanomaterials, Inc. supplies pharmaceutical-grade metal oxide and polymer nanoparticles with certified primary particle sizes as low as 10 nanometers and surface area specifications exceeding 200 square meters per gram, verified through BET and electron microscopy analysis.
Expansion of Biopharmaceutical and Advanced Therapeutics Pipelines
The rapid expansion of biopharmaceutical products, including biologics, biosimilars, and nucleic acid–based therapies, strongly supports market growth. These complex molecules require precise nanoparticle formulation to maintain stability, activity, and reproducibility. Regulatory emphasis on detailed physicochemical characterization further reinforces adoption of nanoparticle formulation technologies. As pipelines advance from discovery to clinical and commercial stages, demand grows for scalable, validated nanoparticle systems that ensure consistent performance and compliance with stringent quality standards.
- For instance, Cytodiagnostics Inc. actively supports academic–industry research by supplying research-grade gold and silver nanoparticles with tightly specified primary particle diameters ranging from 5 nanometers to 100 nanometers, verified by transmission electron microscopy.
Increasing Research Funding and Academic–Industry Collaboration
Rising public and private investment in nanoscience research significantly contributes to market expansion. Governments and funding agencies support nanoparticle-based innovations in healthcare, diagnostics, and materials science. At the same time, collaborations between academic institutions and industry players accelerate technology transfer and commercialization. These partnerships drive continuous innovation in formulation methods and analytical tools, expanding the application scope of nanoparticles and increasing long-term demand for formulation platforms and characterization technologies.
Key Trends & Opportunities
Shift Toward Precision Medicine and Targeted Nanotherapies
A major trend shaping the market is the shift toward precision medicine, where nanoparticle formulations enable targeted and personalized therapies. Nanocarriers can be engineered for specific tissues, receptors, or disease pathways, supporting individualized treatment approaches. This trend creates opportunities for customized nanoparticle design, surface modification, and functionalization. As precision medicine gains regulatory and clinical acceptance, demand for flexible formulation technologies capable of supporting tailored nanoparticle systems continues to rise.
- For instance, Nanoshel LLC offers research-grade silver nanoparticles with confirmed average particle sizes of 50–80 nanometers and metal purity of 99.9%, verified by scanning electron microscopy and certificate of analysis documentation, which researchers use to explore targeted antimicrobial and biofunctional applications.
Advancements in Analytical and Characterization Technologies
Continuous innovation in analytical techniques represents a significant opportunity for the nanoparticle formulation market. High-resolution particle sizing, real-time tracking, and multi-parameter analysis tools improve understanding of nanoparticle behavior and stability. Integration of automation, artificial intelligence, and data analytics enhances reproducibility and throughput in formulation development. These advancements support faster optimization cycles and regulatory readiness, encouraging broader adoption across pharmaceutical, academic, and industrial research environments.
- For instance, nanoComposix offers UltraUniform gold nanoparticle number standards with tightly monodisperse primary sizes of 30 nm, 50 nm, and 100 nm, supplied at calibrated particle concentrations of 1.0 × 10⁸ particles/mL, with characterization verified via single particle ICP-MS referenced to National Measurement Laboratory standards.
Growing Applications Beyond Pharmaceuticals
Nanoparticle formulation is expanding beyond pharmaceuticals into medical devices, diagnostics, and advanced materials. Nanoparticles are increasingly used in implant coatings, imaging agents, and biosensors, creating new revenue streams for formulation technology providers. This diversification reduces dependence on a single end-use sector and opens opportunities for cross-industry innovation. As non-pharmaceutical applications mature, demand grows for versatile formulation platforms adaptable to diverse functional and regulatory requirements.
Key Challenges
Complexity of Scale-Up and Manufacturing Consistency
One of the major challenges in the nanoparticle formulation market is maintaining consistency during scale-up from laboratory to commercial production. Small variations in process parameters can significantly impact particle size, stability, and performance. Ensuring batch-to-batch reproducibility while meeting regulatory expectations requires advanced process control and validation. These complexities increase development timelines and costs, posing barriers for smaller companies and early-stage research programs transitioning to commercialization.
Regulatory Uncertainty and Standardization Gaps
Regulatory frameworks for nanoparticle-based products continue to evolve, creating uncertainty for manufacturers and developers. Limited standardization in characterization methods, safety assessment, and long-term toxicity evaluation complicates regulatory submissions. Differences in regional regulatory expectations further add complexity for global market participants. Addressing these challenges requires clearer guidelines, harmonized standards, and stronger collaboration between industry and regulatory bodies to ensure safe, efficient, and predictable product development pathways.
Regional Analysis
North America
North America leads the nanoparticle formulation market, accounting for approximately 38% market share, supported by a strong pharmaceutical and biopharmaceutical ecosystem and high R&D intensity. The region benefits from early adoption of advanced nanotechnology platforms, robust clinical trial activity, and well-established regulatory frameworks that encourage innovation while ensuring quality compliance. Extensive presence of leading drug developers, contract research organizations, and academic research centers drives continuous demand for nanoparticle formulation and characterization solutions. Additionally, sustained funding for nanomedicine, oncology, and vaccine research further reinforces North America’s dominant position in both development and commercialization stages.
Europe
Europe holds an estimated around 27% market share in the nanoparticle formulation market, driven by strong academic research capabilities and a well-developed biopharmaceutical manufacturing base. Countries across Western Europe emphasize translational research, enabling smooth progression of nanoparticle-based therapies from laboratories to clinical applications. Harmonized regulatory standards and active participation in cross-border research programs support consistent adoption of nanoparticle formulation technologies. The region also demonstrates growing interest in nanotechnology for drug delivery, diagnostics, and medical devices, with increasing collaboration between universities, research institutes, and pharmaceutical companies sustaining steady market growth.
Asia-Pacific
Asia-Pacific represents a fast-growing region, capturing approximately 25% market share, supported by expanding pharmaceutical production, rising healthcare investment, and increasing government support for nanotechnology research. Countries such as China, Japan, South Korea, and India are strengthening capabilities in drug development, generics, and advanced therapeutics, driving demand for nanoparticle formulation solutions. Rapid expansion of academic research infrastructure and growing participation in global clinical trials further accelerate adoption. Cost-efficient manufacturing, a large patient population, and improving regulatory frameworks position Asia-Pacific as a key growth engine for the global nanoparticle formulation market.
Latin America
Latin America accounts for around 6% market share, reflecting a developing but steadily advancing nanoparticle formulation landscape. Growth is supported by gradual expansion of pharmaceutical manufacturing, increasing focus on research-based drug development, and rising collaboration with international research organizations. Countries such as Brazil and Mexico are investing in biotechnology and nanomedicine initiatives, particularly in academic and public research institutions. While adoption remains lower than in developed regions, improving healthcare infrastructure, regulatory modernization, and growing awareness of nanoparticle-based therapies are expected to support incremental market expansion across the region.
Middle East & Africa
The Middle East & Africa region holds an estimated about 4% market share, characterized by emerging adoption of nanoparticle formulation technologies. Growth is primarily driven by increasing healthcare investments, expansion of research universities, and government-led initiatives to strengthen biotechnology capabilities. Gulf countries are focusing on advanced healthcare infrastructure and localized pharmaceutical manufacturing, while parts of Africa emphasize academic and public research applications. Although market penetration remains limited, rising interest in innovative drug delivery systems and gradual regulatory development are expected to create long-term opportunities for nanoparticle formulation solutions in the region.
Nanoparticle Formulation Market Segmentations:
By Technology:
- Dynamic Light Scattering
- Laser Diffraction
By Analysis Type:
- Particle Size Analysis
- Particle Concentration Analysis
By Application:
- Pharmaceutical and Biopharmaceutical Companies
- Academic Research Institutions
By Geography
- North America
- U.S.
- Canada
- Mexico
- Europe
- Germany
- France
- U.K.
- Italy
- Spain
- Rest of Europe
- Asia Pacific
- China
- Japan
- India
- South Korea
- South-east Asia
- Rest of Asia Pacific
- Latin America
- Brazil
- Argentina
- Rest of Latin America
- Middle East & Africa
- GCC Countries
- South Africa
- Rest of the Middle East and Africa
Competitive Landscape
The competitive landscape of the nanoparticle formulation market players such as Nanophase Technologies Corporation, US Research Nanomaterials, Inc., Quantum Materials Corporation, SkySpring Nanomaterials, Inc., Cytodiagnostics Inc., Nanoshel LLC, nanoComposix, Frontier Carbon Solutions, LLC., American Elements, Strem. the nanoparticle formulation market is defined by strong emphasis on material quality, formulation precision, and application-specific customization. Market participants compete on their ability to deliver nanoparticles with tightly controlled size distribution, surface chemistry, and reproducibility to meet stringent research and industrial requirements. Continuous investment in advanced synthesis methods, purification processes, and analytical validation strengthens competitive positioning. Companies increasingly focus on scalable production while maintaining high purity standards to support pharmaceutical, biomedical, and advanced materials applications. Strategic collaborations with research institutions, expansion of tailored formulation services, and differentiation through technical support and regulatory readiness further shape competition in this market.
Key Player Analysis
- Nanophase Technologies Corporation
- US Research Nanomaterials, Inc.
- Quantum Materials Corporation
- SkySpring Nanomaterials, Inc.
- Cytodiagnostics Inc.
- Nanoshel LLC
- nanoComposix
- Frontier Carbon Solutions, LLC.
- American Elements
- Strem
Recent Developments
- In May 2025, Aptar CSP Technologies has opened a new cGMP-compliant manufacturing facility in New Jersey to produce specialized packaging solutions for pharmaceutical. Aptar CSP Technologies opened a cGMP site in New Jersey that supports clinical packaging for oral solid dose and capsule-based dry-powder inhaler products.
- In February 2025, Ardena finalized the acquisition of Catalent's drug-product facility in Somerset, New Jersey, a major strategic move to enter North America, expand its oral drug manufacturing (late-stage/small-scale), and integrate bioanalytical services, enhancing its integrated Contract Development and Manufacturing Organization (CDMO) offerings.
- In February 2025, Jabil Inc. has completed a deal for contract development and manufacturing organization (CDMO) Pharmaceutics International Inc. Jabil Inc. acquired Pharmaceutics International Inc., adding aseptic filling, lyophilization, and oral solid dose manufacturing capacity to its diversified network.
- In January 2025, Researchers at the National University of Singapore (NUS) introduced a method using DNA-barcoded gold nanoparticles to enhance cancer treatment precision. The study demonstrated the effectiveness of triangular nanoparticles in delivering nucleic acids and heating tumor cells during photothermal therapy.
Report Coverage
The research report offers an in-depth analysis based on Technology, Analysis Type, Application and Geography. It details leading market players, providing an overview of their business, product offerings, investments, revenue streams, and key applications. Additionally, the report includes insights into the competitive environment, SWOT analysis, current market trends, as well as the primary drivers and constraints. Furthermore, it discusses various factors that have driven market expansion in recent years. The report also explores market dynamics, regulatory scenarios, and technological advancements that are shaping the industry. It assesses the impact of external factors and global economic changes on market growth. Lastly, it provides strategic recommendations for new entrants and established companies to navigate the complexities of the market.
Future Outlook
- Nanoparticle formulation will see increased adoption in advanced drug delivery systems to improve targeting efficiency and therapeutic performance.
- Continuous innovation in formulation techniques will enhance control over particle size, surface properties, and stability.
- Integration of automation and digital tools will streamline formulation development and improve reproducibility across batches.
- Regulatory frameworks will gradually mature, enabling clearer pathways for approval of nanoparticle-based products.
- Collaboration between industry and academic research institutions will accelerate translational nanotechnology applications.
- Expansion of biopharmaceutical and gene-based therapies will drive demand for sophisticated nanoparticle carriers.
- Greater emphasis on personalized medicine will increase the need for customized nanoparticle formulations.
- Adoption of environmentally sustainable and biocompatible materials will gain importance in formulation strategies.
- Growth in non-pharmaceutical applications will broaden the market scope beyond traditional healthcare uses.
- Advances in analytical and characterization technologies will support faster optimization and quality assurance of nanoparticle formulations.
Request a Free Sample
Fill in your details and we'll send you a free sample report.
- Sample data tables & charts
- Research methodology
Need a Custom Version of This Report?
Tailor the scope, geography, or segments to your exact requirements.
- Custom geography or segment scope
- Direct access to our analyst team
Frequently Asked Questions
What is the current market size for the Nanoparticle Formulation Market, and what is its projected size in 2032?
At what Compound Annual Growth Rate is the Nanoparticle Formulation Market projected to grow between 2024 and 2032?
Which Nanoparticle Formulation Market segment held the largest share in 2024?
What are the primary factors fueling the growth of the Nanoparticle Formulation Market?
Who are the leading companies in the Nanoparticle Formulation Market?
Which region commanded the largest share of the Nanoparticle Formulation Market in 2024?
Table of Content
Chapter 1. Report Introduction
- 1.1 Report Description & Purpose
- 1.1.1 Report Title & Market Definition
- 1.1.2 Unique Selling Propositions (USP) & Key Differentiators
- 1.1.3 Value Proposition for Stakeholders
- 1.2 Research Objectives
- 1.2.1 Market Sizing Objectives (Volume & Revenue) (Volume Where Applicable)
- 1.2.2 Segmentation Objectives
- 1.2.3 Competitive Intelligence Objectives
- 1.2.4 Forecast & Scenario Objectives
- 1.3 Report Scope
- 1.3.1 Nanoparticle Formulation Scope – Segments & Subsegments Covered
- 1.3.2 Geographic Scope – Regions & Countries Covered
- 1.3.3 Historical Period, Base Year & Forecast Period (2024; forecast to 2032)
- 1.3.4 Inclusions & Exclusions
- 1.4 Industry Classification & Applicable Codes
- 1.5 Currency, Measurement Units & Valuation Basis
- 1.6 Target Stakeholders
- 1.7 Limitations & Assumptions
Chapter 2. Executive Summary
- 2.1 Global Nanoparticle Formulation Market Snapshot
- 2.1.1 Market Size – Historical (2024) & Forecast (2024-2032) (2024: USD 8,589 million → 2032: USD 16,863.73 million)
- 2.1.2 Volume & Revenue – Global Totals (Volume Where Applicable)
- 2.1.3 Key Market Highlights – Top Five Facts
- 2.2 Nanoparticle Formulation Market Segmentation Snapshot
- 2.2.1 Market Split by Region – 2024 vs. 2032
- 2.3 Competitive Snapshot
- 2.3.1 Top 10 Players by Revenue Share – 2024
- 2.3.2 Top 10 Players by Volume Share – 2024 (Volume Where Applicable)
- 2.3.3 Recent Strategic Developments (18-Month Summary)
- 2.4 Key Investment Highlights & Strategic Conclusions
Chapter 3. Nanoparticle Formulation Market Dynamics & Industry Analysis
- 3.1 Market Overview & Context
- 3.1.1 Nanoparticle Formulation Market Position in the Broader Industry Value Chain
- 3.1.2 Demand Structure & Purchasing Dynamics
- 3.1.3 Market Maturity & Development Stage by Region
- 3.2 Nanoparticle Formulation Market Drivers
- 3.3 Nanoparticle Formulation Market Restraints & Challenges
- 3.4 Nanoparticle Formulation Market Opportunities
- 3.5 Porter's Five Forces Analysis
- 3.5.1 Threat of New Entrants
- 3.5.2 Bargaining Power of Suppliers
- 3.5.3 Bargaining Power of Buyers
- 3.5.4 Threat of Substitutes
- 3.5.5 Competitive Rivalry – Intensity Assessment
- 3.6 Nanoparticle Formulation Value Chain Analysis
- 3.6.1 Upstream – Key Inputs, Resources & Suppliers
- 3.6.1.1 Key Input/Resource 1
- 3.6.1.2 Key Input/Resource 2
- 3.6.1.3 Key Input/Resource 3
- 3.6.2 Midstream – Core Operations & Value Creation
- 3.6.2.1 Operating Model & Process Overview
- 3.6.2.2 Key Operating Locations & Capabilities by Company
- 3.6.3 Downstream – Market Channels & End Users
- 3.6.3.1 Direct Sales & Customer Engagement Channels
- 3.6.3.2 Indirect Sales, Intermediaries & Partner Channels
- 3.6.4 Value Chain Profitability Analysis
- 3.6.1 Upstream – Key Inputs, Resources & Suppliers
- 3.7 PESTEL Analysis
- 3.7.1 Political Factors
- 3.7.2 Economic Factors
- 3.7.3 Social Factors
- 3.7.4 Technological Factors
- 3.7.5 Environmental Factors
- 3.7.6 Legal Factors
- 3.8 Nanoparticle Formulation Supply Chain Analysis
- 3.8.1 Critical Input & Resource Availability Risk Assessment
- 3.8.2 Supplier & Operational Concentration Risk (Geographic Exposure)
- 3.8.3 Supply & Service Disruption Impact Analysis
- 3.9 Regulatory & Policy Landscape
Note: The regulatory and policy landscape section covers regulations based on their applicability to the market, Nanoparticle Formulation category, geography, and scope of the study. Only regulatory frameworks with a material impact on operations, compliance, trade, sustainability, or market access are analyzed in detail.
Chapter 4. Key Investment Pockets & Opportunity Analysis
- 4.1 Nanoparticle Formulation Market Attractiveness Analysis
- 4.1.1 By Region – Investment Attractiveness Matrix (Market Size × CAGR)
- 4.2 Absolute Revenue Growth Opportunity
- 4.2.1 By Region – Absolute Revenue Growth Through 2032
- 4.3 Incremental Demand Opportunity
- 4.3.1 By Region – Incremental Demand Through 2032
- 4.3.2 Segment – Incremental Demand
- 4.4 Emerging Submarket Opportunity Deep Dive (Subject to Applicability)
- 4.5 Priority Market Opportunity Scorecards
- 4.5.1 United States
- 4.5.2 Europe
- 4.5.3 Asia
- 4.5.4 Middle East & Africa
Note: Priority market opportunity scorecards reflect the geographic scope and strategic relevance of the study. Listed markets are indicative and may be adapted to the industry.
Chapter 5. Nanoparticle Formulation Cross-Border Trade & Market Access Analysis
- 5.1 International Trade & Cross-Border Activity Overview
- 5.1.1 Global Export Value by Country (2024)
- 5.1.2 Global Export Volume by Country (2024) (Volume Where Applicable)
- 5.1.3 Global Import Value by Country (2024)
- 5.1.4 Global Import Volume by Country (2024) (Volume Where Applicable)
- 5.1.5 Net Trade Balance by Country (2024)
- 5.2 Export Analysis – Segment
- 5.2.1 Category 1 (Applicable Classification Code)
- 5.2.2 Category 2 (Applicable Classification Code)
- 5.2.3 Category 3 (Applicable Classification Code)
- 5.2.4 Category 4 (Applicable Classification Code)
- 5.2.5 Category 5 (Applicable Classification Code)
- 5.3 Import Analysis – Segment
- 5.3.1 Category 1 (Applicable Classification Code)
- 5.3.2 Category 2 (Applicable Classification Code)
- 5.3.3 Category 3 (Applicable Classification Code)
- 5.3.4 Category 4 (Applicable Classification Code)
- 5.3.5 Category 5 (Applicable Classification Code)
- 5.4 Cross-Border Pricing & Transaction Benchmarks
- 5.4.1 Export Pricing – Segment & Country
- 5.4.2 Import Pricing – Segment & Source Country
- 5.4.3 Price Trends (2024)
- 5.5 Key Cross-Border Trade & Delivery Routes
- 5.5.1 Cross-Border Trade/Delivery Route 1
- 5.5.2 Cross-Border Trade/Delivery Route 2
- 5.5.3 Cross-Border Trade/Delivery Route 3
- 5.5.4 Cross-Border Trade/Delivery Route 4
- 5.5.5 Cross-Border Trade/Delivery Route 5
- 5.6 Trade Policy & Market Access Impact Assessment
- 5.6.1 Tariff & Non-Tariff Barriers
- 5.6.2 Regional Trade & Economic Integration Frameworks
- 5.6.3 Bilateral & Multilateral Trade Agreements
- 5.6.4 Cross-Border Operating, Licensing & Localization Requirements
Note: This chapter applies where cross-border trade or delivery is relevant to Nanoparticle Formulation. Goods, services, and digital offerings are assessed using applicable classifications and transaction measures. Import-export volumes, trade balances, and route analyses are included only where meaningful to the market.
Chapter 6. Competitive Landscape & Company Benchmarking
- 6.1 Nanoparticle Formulation Market Concentration & Structure
- 6.1.1 Herfindahl-Hirschman Index (HHI) – vs. 2024
- 6.1.2 Leading, Mid-Sized & Emerging Player Structure
- 6.1.3 Global, Regional & Local Player Dynamics
- 6.2 Nanoparticle Formulation Market Share Analysis – 2024
- 6.2.1 Global Revenue Share by Company
- 6.2.2 Global Volume Share by Company (Volume Where Applicable)
- 6.2.3 Regional Revenue Share
- 6.2.4 Market Share Evolution ( vs. 2024)
- 6.2.5 Company Market Share by Key Segment
- 6.2.6 Company Market Share by Customer Group
- 6.3 Operating Scale, Capacity & Infrastructure Analysis
- 6.3.1 Global Operating Scale & Supply Capacity
- 6.3.2 Resource Utilization & Operating Efficiency
- 6.3.3 Output, Service Delivery & Activity Metrics
- 6.3.4 Operating Footprint & Infrastructure Map
- 6.3.5 Planned Operational & Capacity Expansion
- 6.4 Nanoparticle Formulation Competitive Benchmarking Matrix
- 6.4.1 Revenue, Growth, Profitability & Operating Metric Comparison
- 6.4.2 Channel Revenue Mix
- 6.4.3 Geographic Revenue Exposure
- 6.4.4 R&D Intensity
- 6.4.5 Sustainability Maturity
- 6.5 Strategic Developments in Nanoparticle Formulation (Last 24 Months)
- 6.5.1 Mergers, Acquisitions & Divestments
- 6.5.2 New Products, Services & Solutions in Nanoparticle Formulation
- 6.5.3 Operational & Infrastructure Expansions
- 6.5.4 Strategic Alliances, Joint Ventures & Partnerships
- 6.5.5 Distribution Expansion & Market Entry
- 6.5.6 Sustainability & ESG Initiatives
- 6.6 Competitive Strategy Mapping
- 6.6.1 Leader, Challenger, Follower & Niche Classification
- 6.6.2 Pricing Strategy Comparison
- 6.6.3 Channel Strategy Matrix
Note: Strategic developments are included based on their materiality and the availability of reliable information.
Chapter 7. Global Nanoparticle Formulation Market – By Sales & Delivery Channel
- 7.1 Segment Overview
- 7.1.1 Volume & Revenue Split by Channel (2024 & 2032) (Volume Where Applicable)
- 7.1.2 Channel Mix Evolution (2024-2032)
Chapter 8. Regional Market Analysis – Global Overview
- 8.1 Global Regional Overview
- 8.1.1 Regional Volume Share (Volume Where Applicable)
- 8.1.2 Regional Revenue Share
- 8.1.3 Regional Volume by Region (Volume Where Applicable)
- 8.1.4 Regional Revenue by Region
- 8.1.5 Regional Forecast Through 2032
- 8.2 Cross-Regional Segment Analysis
- 8.2.1 By Sales & Delivery Channel
- 8.2.2 By Competitive Positioning & Price Tier
Chapter 9. North America Nanoparticle Formulation Market
- 9.1 United States
- 9.2 Canada
- 9.3 Mexico
Chapter 10. Europe Nanoparticle Formulation Market
- 10.1 Germany
- 10.2 France
- 10.3 Italy
- 10.4 United Kingdom
- 10.5 Spain
- 10.6 Poland
- 10.7 Russia
- 10.8 Netherlands
- 10.9 Belgium
- 10.10 Sweden
- 10.11 Denmark
- 10.12 Norway
- 10.13 Rest of Europe
Chapter 11. Asia Pacific Nanoparticle Formulation Market
- 11.1 China
- 11.2 India
- 11.3 Japan
- 11.4 South Korea
- 11.5 Thailand
- 11.6 Indonesia
- 11.7 Vietnam
- 11.8 Malaysia
- 11.9 Australia
- 11.10 Rest of Asia Pacific
Chapter 12. Latin America Nanoparticle Formulation Market
- 12.1 Brazil
- 12.2 Argentina
- 12.3 Colombia
- 12.4 Chile
- 12.5 Rest of Latin America
Chapter 13. Middle East Nanoparticle Formulation Market
- 13.1 Saudi Arabia
- 13.2 United Arab Emirates
- 13.3 Turkey
- 13.4 Israel
- 13.5 Iran
- 13.6 Rest of the Middle East
Chapter 14. Africa Nanoparticle Formulation Market
- 14.1 South Africa
- 14.2 Egypt
- 14.3 Nigeria
- 14.4 Morocco
- 14.5 Rest of Africa
Chapter 15. Nanoparticle Formulation Company Profiles
- 15.1 [Company 01]
- 15.1.1 Company Overview
- 15.1.2 Key Management Personnel
- 15.1.3 Products & Services Portfolio
- 15.1.4 Financial Performance
- 15.1.5 Key Market Focus & Geographic Presence
- 15.1.6 Recent Developments & Strategic Initiatives
Note: The company profile list is preliminary and may change based on research findings, market developments, data availability, and client requirements.
Chapter 16. Appendices
- Appendix A – List of Abbreviations & Acronyms
- Appendix B – Industry Classification Code Reference – Full Series
- Appendix C – Supply, Output & Operating Capacity Data Tables
- Appendix D – End-Use & Demand Base Tables
- Appendix E – Demand, Adoption & Usage Assumptions
- Appendix F – Pricing & Revenue Metric Reference Tables
- Appendix G – Company Operations & Infrastructure Database
- Appendix H – Cross-Border Trade & Activity Data Tables (Where Applicable)
- Appendix I – Regulatory Summary Tables
- Appendix J – Primary Research Participant List (Anonymized)
- Appendix K – Primary Research Questionnaire Framework
- Appendix L – Data Sources & Bibliography
- Appendix M – Market Size Divergence & Source Comparison
Chapter 17. Research Methodology
- 17.1 Research Framework & Philosophy
- 17.2 Secondary Research – Sources, Hierarchy & Data Extraction
- 17.3 Data Modeling – Bottom-Up & Top-Down Market Sizing
- 17.4 Primary Research – Stakeholder Framework, LOI & Sample Sizes
- 17.5 Forecast Methodology – Regression, Scenario & Sensitivity Analysis
- 17.6 Quality Control – Four-Layer Validation Framework
- 17.7 Limitations & Standard Assumptions
- 17.8 Disclaimer
