Market Overview
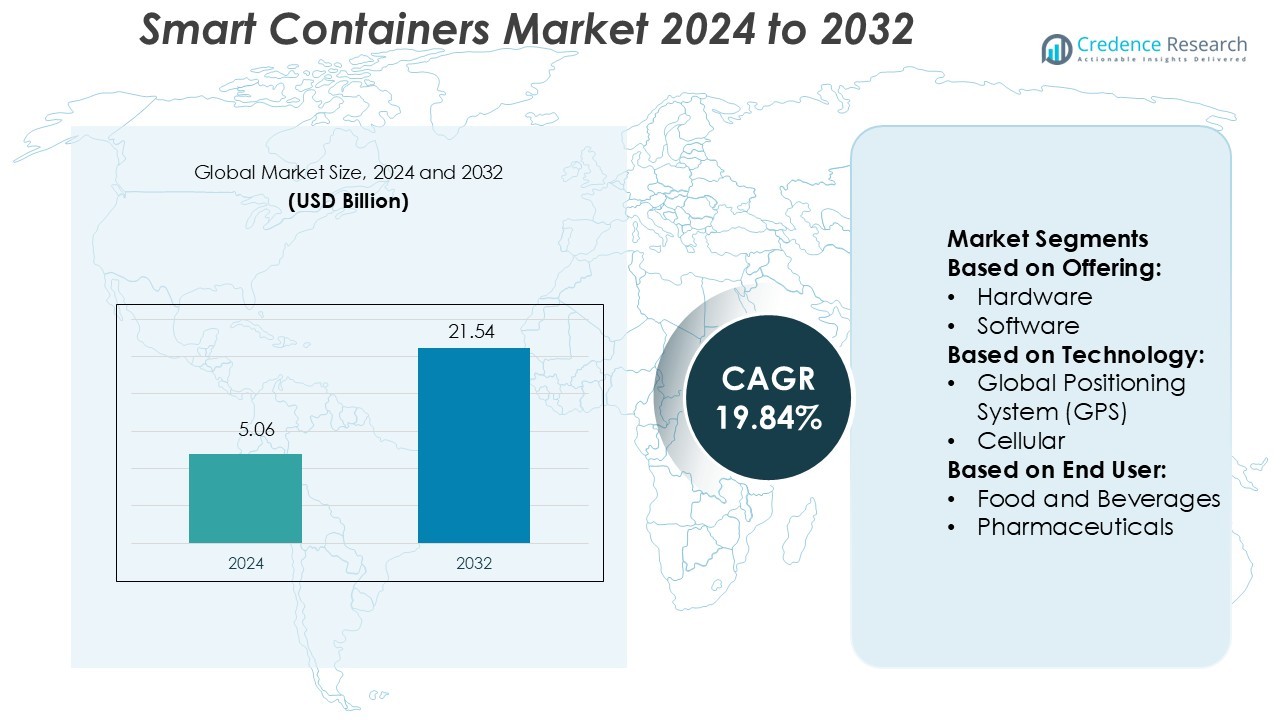
Smart Containers Market size was valued USD 5.06 billion in 2024 and is anticipated to reach USD 21.54 billion by 2032, at a CAGR of 19.84% during the forecast period.
| REPORT ATTRIBUTE | DETAILS |
|---|---|
| Historical Period | 2020-2023 |
| Base Year | 2024 |
| Forecast Period | 2025-2032 |
| Smart Containers Market Size 2024 | USD 5.06 Billion |
| Smart Containers Market, CAGR | 19.84% |
| Smart Containers Market Size 2032 | USD 21.54 Billion |
The Smart Containers Market is led by prominent players such as Robert Bosch GmbH, Traxens, Savvy Telematics, Seaco, Globe Tracker ApS, Emerson Electric Co., Phillips Connect Technologies, Hapag-Lloyd AG, Sensitech Inc., and ORBCOMM. These companies focus on IoT integration, real-time tracking, and predictive analytics to optimize global logistics operations. They continuously invest in developing energy-efficient and AI-enabled smart containers to enhance transparency and reduce losses in transit. North America leads the global Smart Containers Market with a 35% share, driven by advanced connectivity infrastructure, strong adoption of telematics, and high demand for supply chain digitization.
Market Insights
- The Smart Containers Market size was valued at USD 5.06 billion in 2024 and is expected to reach USD 21.54 billion by 2032, registering a CAGR of 19.84% during the forecast period.
- Rising demand for real-time cargo monitoring and supply chain transparency continues to drive strong adoption across logistics and transportation sectors.
- Advancements in IoT, AI, and predictive analytics are transforming container tracking, offering improved visibility and efficiency for end users.
- North America leads the market with a 35% share, while the hardware segment holds the dominant position due to high demand for sensor-based monitoring systems.
- Increasing partnerships between logistics firms and technology providers, along with sustainability-focused innovations, are shaping future market expansion and competitive differentiation.
Market Segmentation Analysis:
By Offering
The hardware segment dominates the Smart Containers Market with the largest market share. It includes sensors, gateways, and communication modules that enable real-time tracking and monitoring of container conditions. High adoption stems from demand for temperature, humidity, and shock detection systems in logistics and cold chain operations. Hardware solutions improve supply chain visibility and reduce losses during transit. Software and services segments are growing due to analytics platforms and remote diagnostics. The shift toward integrated IoT ecosystems further boosts demand for advanced sensor-based hardware systems.
- For instance, Robert Bosch GmbH manufactures the TDL110 transport data logger, a device that uses Bluetooth Low Energy (BLE) connectivity for configuration and data retrieval.
By Technology
Global Positioning System (GPS) technology holds the leading share in the Smart Containers Market. GPS-enabled containers allow precise tracking and route optimization, improving logistics efficiency and reducing fuel costs. These systems also provide real-time alerts for route deviations and delays. Cellular networks follow as a key segment, offering continuous connectivity across long distances. LoRaWAN and Bluetooth Low Energy (BLE) technologies are gaining traction for low-power, short-range monitoring solutions in warehouse and port environments. The increasing use of multi-technology systems enhances end-to-end visibility in smart logistics operations.
- For instance, SAVVY® CargoTrac-Solar device, launched in September 2023, supports real-time notifications at 1-second intervals even in hazardous Zone 1 (Gas Group IIC T6) and Zone 21 (Dust Group IIIC T85°C) environments.
By End User
The food and beverages segment dominates the Smart Containers Market, driven by strict temperature control and quality assurance requirements. Smart containers help monitor perishable goods and maintain compliance with food safety regulations. They ensure traceability and reduce spoilage during global shipments. The pharmaceutical sector follows closely, adopting IoT containers for tracking temperature-sensitive medicines and vaccines. Oil and gas, chemicals, and other sectors use these systems for hazardous material monitoring and asset protection. Growing supply chain digitization across industries supports sustained demand for smart container solutions.
Key Growth Drivers
Rising Demand for Real-Time Supply Chain Visibility
The need for end-to-end visibility is driving smart container adoption across global logistics networks. Companies rely on IoT sensors and cloud-based tracking systems to monitor temperature, location, and security status in real time. This helps reduce cargo theft, spoilage, and delivery delays. Industries such as food, pharmaceuticals, and chemicals are major users due to regulatory compliance and traceability needs. The growing focus on predictive analytics and digital logistics enhances operational efficiency and strengthens smart container deployment worldwide.
- For instance, Seaco reports it manages a refrigerated fleet of over 200,000 units worldwide and has introduced condition-monitoring “smart” sensors in selected reefers.
Expansion of Global Trade and Cold Chain Logistics
Global trade recovery and increasing cross-border movement of temperature-sensitive goods are fueling smart container use. These containers ensure optimal conditions for products such as vaccines, seafood, and frozen foods throughout transit. Advanced telemetry technologies enhance cold chain management and reduce wastage. Logistics providers are investing in smart containers to meet international safety standards and maintain product integrity. The expansion of refrigerated transport infrastructure across emerging markets continues to strengthen industry growth and adoption.
- For instance, Globe Tracker’s “GT Sense Door +” cargo sensor supports an operating temperature range from -70 °C to +65 °C, features IP67 ingress protection, switches between LoRa frequency bands globally and delivers a battery life of at least 5 years.
Integration of IoT, AI, and Blockchain Technologies
The integration of IoT sensors, artificial intelligence, and blockchain enhances transparency and automation in smart container management. AI-driven analytics improve route optimization, predictive maintenance, and cargo forecasting. Blockchain enables secure, tamper-proof data sharing between supply chain participants. These technologies reduce administrative errors and improve accountability in global freight operations. The growing adoption of digital ecosystems by logistics firms and shipping companies is accelerating the deployment of smart containers for data-driven decision-making.
Key Trends & Opportunities
Growth of Connected Logistics Ecosystems
Smart containers are becoming central components of connected logistics ecosystems that link shippers, carriers, and customers. Companies are integrating smart containers with transportation management systems (TMS) and warehouse management systems (WMS). This integration allows seamless information flow and proactive response to disruptions. Emerging technologies like edge computing are improving data processing at remote locations. The trend promotes automation, transparency, and real-time coordination, creating new opportunities in intelligent supply chain management.
- For instance, Emerson’s Rosemount 408 Wireless Level Sensor includes radar-based non-contact level and temperature sensing, integrates GPS, and uses cellular connectivity to send encrypted data points to its Plantweb Insight cloud platform.
Rising Adoption of Sustainable and Energy-Efficient Containers
The push for sustainability is encouraging the development of energy-efficient smart containers. Manufacturers are using solar-powered sensors and recyclable materials to reduce carbon footprints. Smart power management systems optimize energy use during long-distance shipments. Logistics operators view eco-friendly smart containers as key tools for achieving carbon neutrality goals. Governments and industry regulators are promoting sustainable logistics practices, creating long-term growth opportunities for environmentally responsible container technologies.
Expansion in Emerging Markets and E-Commerce Logistics
Emerging economies in Asia-Pacific, Latin America, and the Middle East are witnessing rapid logistics digitalization. E-commerce growth has intensified the demand for reliable, real-time cargo tracking. Smart containers enable accurate delivery updates and asset management across vast distribution networks. Local logistics companies are partnering with global tech providers to deploy IoT-enabled solutions. This regional expansion presents strong opportunities for market players focusing on affordable, scalable, and mobile-based container monitoring systems.
- For instance, Phillips Connect’s SolarNet™ trailer or container tracking gateway offers an integrated solar recharge system and claims a 10-year battery life when deployed on solar power.
Key Challenges
High Implementation and Maintenance Costs
Smart container systems require significant investment in IoT hardware, communication networks, and data platforms. Small and medium-sized logistics providers face cost barriers in deploying large-scale fleets. Maintenance expenses increase with complex sensor calibration and software updates. In regions with limited connectivity infrastructure, continuous data transmission also raises operational costs. Balancing technology investment with cost efficiency remains a major challenge for widespread adoption across low-margin logistics operations.
Data Security and Connectivity Limitations
The reliance on wireless networks and cloud systems exposes smart containers to cybersecurity threats. Unauthorized data access, sensor tampering, and communication failures can disrupt logistics operations. Data integrity is critical in sectors like pharmaceuticals and defense logistics, where compliance and safety standards are strict. Additionally, network gaps in remote or maritime regions limit real-time tracking accuracy. Addressing these connectivity and security concerns is essential for building trust and ensuring consistent global deployment.
Regional Analysis
North America
North America holds the largest share of the Smart Containers Market, accounting for nearly 35% of the global revenue. The region’s dominance stems from early adoption of IoT, AI, and telematics solutions in logistics and supply chain management. Major shipping and e-commerce companies utilize smart containers for real-time monitoring and predictive maintenance. The presence of key players and advanced connectivity infrastructure supports large-scale deployment. Government initiatives to enhance cross-border trade efficiency and sustainability further accelerate the adoption of intelligent container tracking systems across the region.
Europe
Europe captures a significant 28% share of the Smart Containers Market, driven by strong regulatory focus on green logistics and cold chain monitoring. The European Union’s sustainability policies encourage fleet operators to deploy energy-efficient tracking solutions. High trade volumes across ports in Germany, the Netherlands, and the U.K. drive demand for real-time container visibility. The region’s emphasis on traceability in pharmaceuticals and food supply chains boosts IoT-enabled container adoption. Ongoing digital transformation in transportation and logistics continues to strengthen Europe’s market position.
Asia-Pacific
Asia-Pacific represents around 27% of the Smart Containers Market and is the fastest-growing region. Rapid industrialization, expanding e-commerce logistics, and government investment in smart port infrastructure drive strong demand. Countries such as China, Japan, and India are deploying connected container solutions for temperature and security monitoring in high-value shipments. The region’s large manufacturing base benefits from enhanced supply chain efficiency through IoT integration. Rising adoption of smart trade technologies under initiatives like China’s Belt and Road further amplifies regional market expansion.
Latin America
Latin America accounts for nearly 6% of the Smart Containers Market, supported by growing logistics modernization efforts in Brazil, Mexico, and Chile. The region is witnessing increased adoption of smart tracking systems in perishable goods and pharmaceutical exports. Government initiatives promoting digital logistics and cross-border connectivity are improving supply chain transparency. Infrastructure upgrades at major ports and logistics hubs enhance market accessibility. However, high initial investment costs and limited connectivity in remote areas restrain widespread adoption across smaller logistics operators.
Middle East & Africa
The Middle East & Africa hold around 4% share of the Smart Containers Market, showing steady growth potential. The region’s expanding oil and gas exports and increasing demand for secure cargo monitoring drive adoption. Smart containers are being deployed to track hazardous materials and high-value industrial goods. Ports in the UAE and Saudi Arabia are investing in smart logistics infrastructure to support trade diversification. However, the market faces challenges due to fragmented connectivity networks. Continuous investment in digital supply chains is expected to boost regional growth.
Market Segmentations:
By Offering:
- Hardware
- Software
By Technology:
- Global Positioning System (GPS)
- Cellular
By End User:
- Food and Beverages
- Pharmaceuticals
By Geography
- North America
- U.S.
- Canada
- Mexico
- Europe
- Germany
- France
- U.K.
- Italy
- Spain
- Rest of Europe
- Asia Pacific
- China
- Japan
- India
- South Korea
- South-east Asia
- Rest of Asia Pacific
- Latin America
- Brazil
- Argentina
- Rest of Latin America
- Middle East & Africa
- GCC Countries
- South Africa
- Rest of the Middle East and Africa
Competitive Landscape
The Smart Containers Market features leading companies such as Robert Bosch GmbH, Traxens, Savvy Telematics, Seaco, Globe Tracker ApS, Emerson Electric Co., Phillips Connect Technologies, Hapag-Lloyd AG, Sensitech Inc., and ORBCOMM. The Smart Containers Market is highly competitive, characterized by continuous innovation in IoT integration, connectivity, and analytics. Companies are focusing on developing intelligent container solutions that provide real-time visibility, remote diagnostics, and predictive maintenance across global supply chains. Advancements in telematics, AI, and blockchain are enabling greater transparency and data accuracy. Firms are also emphasizing sustainability through energy-efficient hardware and recyclable designs. Strategic collaborations between technology providers and logistics operators enhance market reach and operational capabilities. Increasing investments in connected logistics ecosystems and expansion into emerging markets continue to shape competitive strategies, driving steady technological evolution and market consolidation.
Key Player Analysis
- Robert Bosch GmbH
- Traxens
- Savvy Telematics
- Seaco
- Globe Tracker ApS
- Emerson Electric Co.
- Phillips Connect Technologies
- Hapag-Lloyd AG
- Sensitech Inc.
- ORBCOMM
Recent Developments
- In May 2024, Roambee Corporation introduced the world's first true 5G GPS smart label, designed for single-journey logistics applications. This innovative peel-and-ship label integrates advanced sensors and 5G connectivity to provide real-time visibility and quality assurance across supply chains, catering to global enterprises and 3PLs alike.
- In April 2024, Hapag-Lloyd, a prominent container shipping company, introduced "Live Position," its inaugural dry container tracking product. This strategic initiative establishes Hapag-Lloyd as the first shipping line to deploy a fleet-wide dry container tracking solution on a large scale, utilizing Internet of Things (IoT) technology.
- In April 2024, FourKites and BuyCo announced a strategic partnership to advance container shipping management for high-volume shippers. This collaboration merges FourKites' real-time supply chain visibility platform with BuyCo's digital container shipping solution, delivering a unified management system that covers the entire shipping process-from planning and booking to real-time visibility and inventory management.
- In February 2023, Traxens introduced the TRAXENS-BOX 3 tracker, the first to achieve ATEX certification for use in potentially explosive environments aboard LNG vessels. This advancement positioned Traxens as a leader in providing secure and compliant smart container solutions, meeting increasing demand from maritime companies for enhanced tracking capabilities and regulatory readiness.
Report Coverage
The research report offers an in-depth analysis based on Offering, Technology, End-User and Geography. It details leading market players, providing an overview of their business, product offerings, investments, revenue streams, and key applications. Additionally, the report includes insights into the competitive environment, SWOT analysis, current market trends, as well as the primary drivers and constraints. Furthermore, it discusses various factors that have driven market expansion in recent years. The report also explores market dynamics, regulatory scenarios, and technological advancements that are shaping the industry. It assesses the impact of external factors and global economic changes on market growth. Lastly, it provides strategic recommendations for new entrants and established companies to navigate the complexities of the market.
Future Outlook
- The demand for real-time cargo visibility will continue to drive smart container adoption.
- Integration of IoT, AI, and blockchain will enhance supply chain transparency and automation.
- Cold chain logistics will remain a key growth area for temperature-sensitive goods transport.
- Energy-efficient and solar-powered containers will gain popularity for sustainable logistics.
- Expansion of 5G networks will improve data transmission and tracking accuracy across regions.
- Predictive analytics will support proactive maintenance and reduce container downtime.
- Partnerships between logistics providers and tech firms will strengthen innovation pipelines.
- Growth in e-commerce and cross-border trade will increase demand for connected freight solutions.
- Smart container adoption will expand rapidly in emerging markets with improving infrastructure.
- Government initiatives promoting digital trade and green logistics will accelerate market growth.

Request a Free Sample
Fill in your details and we'll send you a free sample report.
- Sample data tables & charts
- Research methodology
Need a Custom Version of This Report?
Tailor the scope, geography, or segments to your exact requirements.
- Custom geography or segment scope
- Direct access to our analyst team
Frequently Asked Questions
What is the current market size for the Smart Containers Market, and what is its projected size in 2032?
At what Compound Annual Growth Rate is the Smart Containers Market projected to grow between 2025 and 2032?
Which Smart Containers Market segment held the largest share in 2024?
What are the primary factors fueling the growth of the Smart Containers Market?
Who are the leading companies in the Smart Containers Market?
Which region commanded the largest share of the Smart Containers Market in 2024?
Table of Content
Chapter 1 Market Segmentation
- 1.1 Segmentation Framework
- 1.1.1 Product and Service Classification
- 1.1.2 Application and End-Use Classification
- 1.1.3 Technology and Solution Classification
- 1.1.4 Customer and Distribution Channel Classification
- 1.1.5 Geographic Segmentation
- 1.1.6 Market Segment Definitions and Boundaries
Chapter 2 Introduction
- 2.1 Report Objectives and Scope
- 2.2 Product Definition and Industry Terminology
- 2.3 Market Inclusions and Exclusions
- 2.4 Research Process
- 2.4.1 Primary Research and Expert Interviews
- 2.4.2 Secondary Research and Source Review
- 2.4.3 Top-Down and Bottom-Up Estimation
- 2.4.4 Data Triangulation and Verification
- 2.5 Market Size Measurement Basis
- 2.5.1 2024: USD 5.06 billion → 2032: USD 21.54 billion
- 2.6 Historical and Forecast Reference Periods
- 2.6.1 Base Year: 2024
- 2.6.2 Forecast Period: 2024-2032
- 2.7 Research Assumptions and Limitations
Chapter 3 Executive Summary
- 3.1 Market Snapshot and Key Findings
- 3.2 Base-Year Market Size, 2024
- 3.3 Forecast Market Size, 2032
- 3.4 Revenue and Volume Growth Outlook
- 3.5 Key Demand and Supply Indicators
- 3.6 Leading Market Segments
- 3.7 Fastest-Growing Market Opportunities
- 3.8 Regional Performance Highlights
- 3.9 Technology and Industry Transformation
- 3.10 Competitive Landscape Summary
- 3.11 Analyst View and Strategic Implications
Chapter 4 Global Smart Containers Market Trends and Developments
- 4.1 Historical Industry Development
- 4.2 Recent Market Trends and Developments
- 4.3 Demand and Customer Behavior Trends
- 4.4 Technology and Product Innovation
- 4.5 Artificial Intelligence, Automation and Digitalization
- 4.6 Local Manufacturing and Supply Chain Realignment
- 4.7 Industry Partnerships, Mergers and Acquisitions
- 4.8 Sustainability and Circular Economy Developments
- 4.9 Government and Private Sector Investment Trends
- 4.10 Emerging Business Models and Commercialization
- 4.11 Industry Developments and Announcements
Chapter 5 Global Smart Containers Market Production, Supply and Demand Analysis
- 5.1 Demand Trend and Consumption Analysis
- 5.2 Demand Forecast, 2024-2032
- 5.3 Production and Output Trend
- 5.4 Production and Output Forecast, 2024-2032
- 5.5 Installed Capacity and Capacity Utilization
- 5.6 Company-Wise Production Plants and Statistics
- 5.6.1 Installed Production Capacity
- 5.6.2 Actual Production
- 5.6.3 Planned Capacity and Expansion Targets
- 5.7 Supply Chain Structure and Procurement Trends
- 5.8 Supply-Demand Gap and Bottlenecks
- 5.9 Import Dependence and Sourcing Structure
- 5.10 Contract Manufacturing and Outsourcing
- 5.11 Regional Supply and Demand Concentration
Chapter 6 Global Smart Containers Market Pricing Analysis
- 6.1 Pricing Structure and Measurement
- 6.2 Historical Pricing Trends
- 6.3 Pricing Outlook, 2024-2032
- 6.4 Average Selling Price and Unit Economics
- 6.5 Pricing by Product and Market Segment
- 6.6 Geographic Pricing Differences
- 6.7 Key Input, Energy, Labor and Logistics Costs
- 6.8 Contract Pricing and Purchasing Models
- 6.9 Pricing Sensitivity and Competitive Positioning
- 6.10 Price, Margin and Profitability Implications
Chapter 7 Global Smart Containers Market Dynamics
- 7.1 Market Growth Drivers
- 7.1.1 Demand-Side Drivers
- 7.1.2 Technology and Innovation Drivers
- 7.1.3 Infrastructure and Investment Drivers
- 7.1.4 Regulatory and Policy Drivers
- 7.2 Market Restraints
- 7.2.1 Cost and Affordability Constraints
- 7.2.2 Technology and Adoption Barriers
- 7.2.3 Supply Chain and Operational Constraints
- 7.3 Market Challenges
- 7.3.1 Competitive Pressure and Margin Erosion
- 7.3.2 Skills, Infrastructure and Implementation Gaps
- 7.4 Emerging Market Opportunities
- 7.5 Market Dynamics Impact and Time-Horizon Assessment
Chapter 8 Global Smart Containers Value Chain Analysis
- 8.1 Industry Value Chain Overview
- 8.2 Upstream Suppliers and Critical Inputs
- 8.3 Technology and Component Providers
- 8.4 Manufacturing or Service Delivery
- 8.5 Distribution, Channel Partners and Integrators
- 8.6 Downstream Applications and End Users
- 8.7 Value Addition and Profit Pools
- 8.8 Vertical Integration and Outsourcing
- 8.9 Supplier Concentration and Risk
- 8.10 Supply Chain Localization and Resilience
Chapter 9 Global Smart Containers Market Regulations and Policies
- 9.1 Relevant Laws, Standards and Compliance Frameworks
- 9.2 Product, Service, Safety and Quality Requirements
- 9.3 Government Policies, Incentives and Subsidies
- 9.4 Imports, Exports and Trade Barriers
- 9.5 Public Procurement and Local Content Requirements
- 9.6 Environmental and Sustainability Compliance
- 9.7 Upcoming Policy Changes and Market Implications
Chapter 10 Global Smart Containers Market Hotspots and Opportunities
- 10.1 Market Opportunity Mapping and Growth Hotspots
- 10.2 High-Growth Applications and Customer Groups
- 10.3 Underserved Markets and White-Space Opportunities
- 10.4 Emerging Technology and Product Opportunities
- 10.5 New Capacity and Investment Hotspots
- 10.6 Market Entry and Expansion Opportunities
- 10.7 Distribution and Partnership Opportunities
- 10.8 Near-Term and Long-Term Commercial Potential
- 10.9 Opportunity Attractiveness and Execution Risks
Chapter 11 Global Smart Containers Market Outlook, 2024-2032
- 11.1 Market Size and Analysis
- 11.1.1 Revenue (Market Measurement: 2024: USD 5.06 billion → 2032: USD 21.54 billion)
- 11.1.2 Market Volume and Quantity Sold
- 11.1.3 Historical Market Size
- 11.1.4 Base-Year Market Size, 2024
- 11.2 Market Forecast, 2024-2032
- 11.2.1 Revenue Forecast to 2032
- 11.2.2 Volume Forecast to 2032
- 11.2.3 CAGR and Year-on-Year Growth
- 11.2.4 Incremental Revenue Opportunity
- 11.3 Forecast Assumptions and Scenario Analysis
- 11.3.1 Base-Case Forecast
- 11.3.2 Optimistic and Conservative Scenarios
- 11.3.3 Technology, Pricing and Policy Sensitivities
- 11.4 Market Attractiveness and Growth Outlook
Chapter 12 Global Smart Containers Market Segmentation and Outlook
- 12.1 Segmentation Summary and Market Shares, 2024
- 12.2 Largest and Fastest-Growing Segments
- 12.3 Segment Growth Comparison
- 12.4 Segment Attractiveness and Priority Matrix
Chapter 13 Global Smart Containers Geographic Market Outlook, 2024-2032
- 13.1 Regional Market Size and Share, 2024
- 13.2 Regional Market Forecast, 2024-2032
- 13.3 Regional Pricing, Production and Demand Differences
- 13.4 North America
- 13.4.1 United States
- 13.4.2 Canada
- 13.4.3 Mexico
- 13.5 Europe
- 13.5.1 Germany
- 13.5.2 France
- 13.5.3 Italy
- 13.5.4 United Kingdom
- 13.5.5 Spain
- 13.5.6 Poland
- 13.5.7 Russia
- 13.5.8 Netherlands
- 13.5.9 Belgium
- 13.5.10 Sweden
- 13.5.11 Denmark
- 13.5.12 Norway
- 13.5.13 Rest of Europe
- 13.6 Asia Pacific
- 13.6.1 China
- 13.6.2 India
- 13.6.3 Japan
- 13.6.4 South Korea
- 13.6.5 Thailand
- 13.6.6 Indonesia
- 13.6.7 Vietnam
- 13.6.8 Malaysia
- 13.6.9 Australia
- 13.6.10 Rest of Asia Pacific
- 13.7 Latin America
- 13.7.1 Brazil
- 13.7.2 Argentina
- 13.7.3 Colombia
- 13.7.4 Chile
- 13.7.5 Rest of Latin America
- 13.8 Middle East
- 13.8.1 Saudi Arabia
- 13.8.2 United Arab Emirates
- 13.8.3 Turkey
- 13.8.4 Israel
- 13.8.5 Iran
- 13.8.6 Rest of the Middle East
- 13.9 Africa
- 13.9.1 South Africa
- 13.9.2 Egypt
- 13.9.3 Nigeria
- 13.9.4 Morocco
- 13.9.5 Rest of Africa
- 13.10 Regional Investment, Policy and Supply Chain Differences
- 13.11 Regional Competitive Landscape
- 13.12 Geographic Growth Hotspots
Chapter 14 Global Smart Containers Technology, Innovation and Sustainability Outlook
- 14.1 Technology Landscape and Maturity
- 14.2 Product, Process and Service Innovation
- 14.3 AI, Automation and Digital Tools in the Industry
- 14.4 Technology Adoption and Performance Benchmarking
- 14.5 Innovation Pipeline and R&D Investment
- 14.6 Patent and Intellectual Property Trends
- 14.7 Energy Efficiency and Resource Management
- 14.8 Sustainability, Recycling and Circularity
- 14.9 Technology Roadmap, 2024-2032
- 14.10 Risks of Obsolescence and Technology Substitution
Chapter 15 Global Smart Containers Market Key Strategic Imperatives
- 15.1 Growth and Market Entry Priorities
- 15.2 High-Return Products and Segments
- 15.3 Pricing, Profitability and Cost Optimization
- 15.4 Technology Investment and Product Differentiation
- 15.5 Supply Chain Localization and Resilience
- 15.6 Distribution and Customer Acquisition
- 15.7 Partnership, Acquisition and Capacity Strategy
- 15.8 Regional Expansion Priorities
- 15.9 Short-, Medium- and Long-Term Actions
Chapter 16 Competition Outlook
- 16.1 Industry Competition Characteristics
- 16.2 Market Structure and Concentration
- 16.3 Market Share and Competitive Positioning, 2024
- 16.4 Company-Wise Revenue and Product Benchmarking
- 16.5 Production and Service Capacity Benchmarking
- 16.6 Technology, Pricing and Differentiation
- 16.7 Regional Footprint and Distribution Strength
- 16.8 Mergers, Acquisitions and Strategic Alliances
- 16.9 New Entrants and Competitive Threats
- 16.10 Porter's Five Forces and Industry Attractiveness
- 16.11 Competitive Outlook, 2024-2032
Chapter 17 Company Profiles
- 17.1 Company Coverage and Selection Criteria
- 17.2 Leading Market Participants – Standard Profile Structure
- 17.2.1 Business Description
- 17.2.2 Company Ownership and Geographic Presence
- 17.2.3 Product and Service Portfolio
- 17.2.4 Manufacturing and Operating Footprint
- 17.2.5 Production Capacity and Expansion Plans
- 17.2.6 Financial Performance and Investment
- 17.2.7 Market Share and Competitive Position
- 17.2.8 Technology and Innovation Capabilities
- 17.2.9 Strategic Alliances or Partnerships
- 17.2.10 Recent Developments
- 17.2.11 Growth Strategy and Outlook
- 17.3 Other Relevant Market Participants
Note: Every listed company is profiled on the structure shown under the first company. The company list is preliminary and may change based on research findings, market developments, data availability and client requirements.
Chapter 18 Disclaimer
- 18.1 Research and Forecast Disclaimer
- 18.2 Data Source and Estimation Limitations
Note: The depth of individual sections depends on data availability for this market. Volume, capacity, trade and other unit-based metrics are included where applicable.