Market Overview
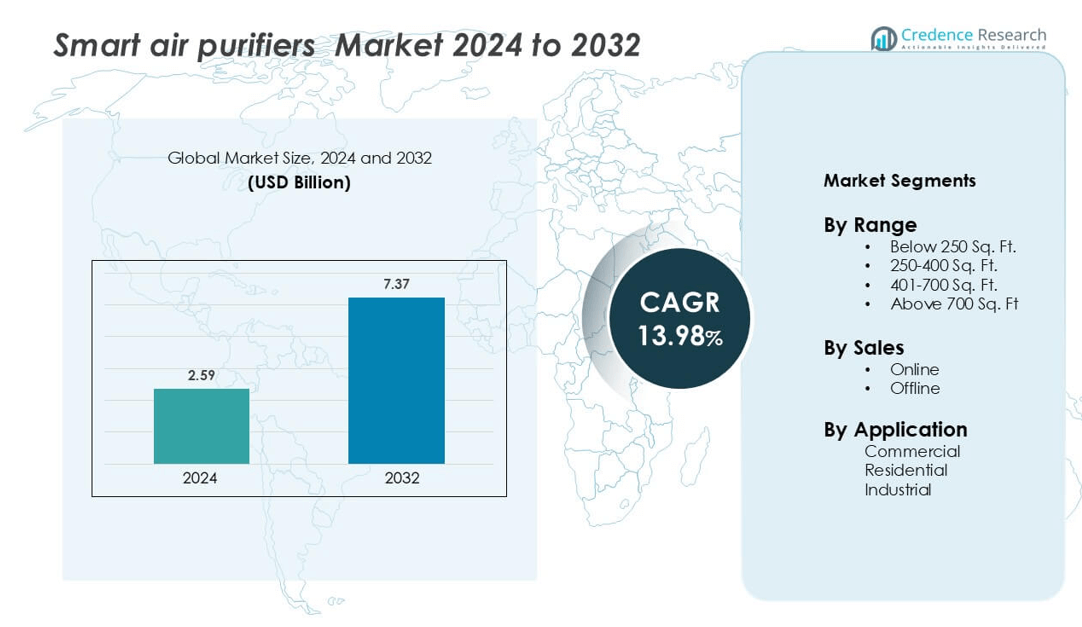
The Smart air purifiers Market size was valued at USD 2.59 billion in 2024 and is anticipated to reach USD 7.37 billion by 2032, growing at a CAGR of 13.98% during the forecast period.
| REPORT ATTRIBUTE |
DETAILS |
| Historical Period |
2020-2023 |
| Base Year |
2024 |
| Forecast Period |
2025-2032 |
| Smart Air Purifiers Market Size 2024 |
USD 2.59 billion |
| Smart Air Purifiers Market, CAGR |
13.9% |
| Smart Air Purifiers Market Size 2032 |
USD 7.37 billion |
The Smart Air Purifiers market features global and regional leaders. Key players include LG Electronics, Carrier, IQAir, Unilever PLC, Panasonic Corporation, Hamilton Beach Brands, Honeywell International, Whirlpool Corporation, Camfi, and Koninklijke Philips N.V. Companies compete on HEPA-13/14 filtration, verified CADR, quiet operation, and smart connectivity. App analytics, filter subscriptions, and reliable after-sales service drive retention. Partnerships with retailers and marketplaces strengthen omnichannel reach and speed fulfillment. Energy efficiency, recyclable filters, and credible certifications shape brand trust. Asia Pacific leads the market with [41.4%] share in 2024. North America follows with wildfire-driven demand and strong IAQ programs. Europe sustains growth through renovation funding and clear IAQ standards.
Market Insights
- The global smart air purifier market was valued at USD 2.59 billion in 2024 and is projected to grow at a CAGR of 98% from 2025 to 2032, driven by rising demand for connected home appliances and advanced filtration technologies.
- Growing health awareness, increasing air pollution levels, and rapid urbanization are key drivers boosting adoption across residential and commercial segments worldwide.
- Emerging trends include integration of AI and IoT for real-time air monitoring, voice-assistant compatibility, energy-efficient designs, and app-based control systems enhancing user convenience.
- The market is moderately consolidated, with leading players such as Philips, Dyson, Xiaomi, Honeywell, and LG focusing on product innovation, smart features, and mergers to strengthen global distribution networks.
- Asia-Pacific holds the largest regional share at 41.4%, followed by North America (35%) and Europe (32%), while the residential segment accounts for nearly 60% of total market revenue due to rising home air-quality concerns.
Access crucial information at unmatched prices!
Request your sample report today & start making informed decisions powered by Credence Research Inc.!
Download Sample
Market Segmentation Analysis:
By Range
The 250–400 sq. ft. range leads the Smart Air Purifiers Market.Urban apartments and mid-sized rooms drive demand for balanced CADR, noise, and price. Buyers prefer H13 HEPA, app control, and sub-35 dB operation for bedrooms. Compact footprints fit Indian 2BHK layouts and rental homes. Wider retail assortments improve availability across brands and SKUs. Automated PM2.5 sensing supports energy savings and filter life. Below-250 sq. ft. suits small rooms and dorms. The 401–700 sq. ft. and above-700 sq. ft. tiers grow with villas, offices, and open-plan spaces.
- For instance, the Xiaomi Smart Air Purifier 4 features a particle CADR of up to 400 m³/h, covers an area of up to 516 sq ft, supports app and voice control, and has a night-mode noise floor of 32.1 dB(A).
By Sales
Online sales dominate share, supported by nationwide logistics and rapid delivery. Marketplaces and D2C sites drive conversions through reviews, EMI, and exchange offers. Filter-subscription add-ons simplify ownership and retention. High-intent searches peak during pollution spikes, boosting paid and organic traffic. Influencer and comparison content reduce uncertainty on CADR and filter grades. Bundled warranties and installation scheduling strengthen trust. Offline remains vital for demos, institutional orders, and immediate takeaways. Modern trade and brand stores focus on premium models, assisted selling, and B2B prospects.
- For instance, Dyson India provides no-cost EMI for 3, 6, 12, 18, or 24 months. The offer applies on dyson.in checkout. App features include detailed PM2.5 and PM10 graphs.
By Application
Residential is the dominant application, accounting share. Households seek PM2.5 reduction, allergy relief, and low-noise night modes. Smart purifiers integrate with voice assistants and home routines. Seasonal smog and indoor cooking emissions sustain repeat purchases. Commercial adoption rises in clinics, schools, gyms, and hospitality due to IAQ policies. Industrial demand grows in labs and light manufacturing, targeting dust, VOCs, and compliance. Facilities teams value real-time AQ dashboards and maintenance alerts. Multi-unit deployments favor centralized monitoring and negotiated filter procurement cycles.
Key Growth Drivers
Urban Air Quality Awareness and Health Priorities
Consumers now track indoor air more actively using phones and wearables. Awareness rises during pollution spikes, allergy seasons, and wildfire events. Parents, elderly caregivers, and asthma patients drive recurring demand. Doctors recommend HEPA, CADR, and PM2.5 indicators for symptom relief. Smart assistants simplify daily use with voice scenes and routines. App dashboards display real-time AQI and filter life. Brands pair sensors with auto mode for hands-free operation. Subscription filters remove friction and ensure performance. Energy-efficient motors lower ownership costs for families. Financing options expand access beyond metro buyers. Retailers promote bundles with humidifiers and dehumidifiers.
- For instance, the Philips 1000i Series Smart Air Purifier scans the air 1,000 times per second with its smart sensor, shows real-time PM2.5 and gas levels via the Air+ app, uses less than 55 W at full speed, and integrates with automations via WiFi to schedule replacement alerts.
Connected Homes and Interoperable Ecosystems
Households want devices that work with existing platforms and routines. Compatibility with Matter, Alexa, Google, and HomeKit reduces adoption barriers. Unified apps enable scenes, schedules, and occupancy-based activation. IFTTT-style automations link purifiers with sensors and thermostats. Multi-room control supports whole-home coverage plans. Firmware updates deliver new modes and bug fixes. Cloud analytics optimize fan curves and noise. Integrations with air quality monitors improve responsiveness. Property developers specify connected SKUs for new projects. Insurance partners explore IAQ-linked wellness incentives. Facilities managers prefer centralized fleet monitoring.
- For instance, the Xiaomi Smart Air Purifier 4 Lite supports Google Assistant, Alexa and Apple HomeKit; its built-in laser particle sensor updates air-quality readings every 10 seconds via the Mi Home app, while its fan speed can be scheduled hourly through IFTTT workflows.
Institutional and Commercial IAQ Compliance
Schools, clinics, gyms, and offices tighten IAQ policies. Procurement teams prioritize certified filtration and defined CADR. Audit trails show PM2.5, PM10, and TVOC compliance over time. Central dashboards support multi-site oversight and alerts. Quiet operation enables classrooms and patient areas. Low-maintenance designs reduce technician visits and downtime. Leasing models suit budget cycles and upgrades. Integration with BMS simplifies automation and reporting. Hospitality and retail adopt purifiers to improve guest trust. Industrial labs target particle and VOC control. Service contracts ensure predictable costs.
Key Trends & Opportunities
Energy Efficiency and Low-Noise Design
Manufacturers focus on brushless motors and optimized fan geometry. Users demand sleep modes under library noise levels. Adaptive algorithms balance CADR with power draw. Carbon and HEPA stacks reduce resistance while preserving capture. Eco labels influence institutional bids. Real-time energy readouts educate users on consumption. Smart schedules align operation with occupancy patterns. Longer-life filters reduce waste and visits. Enclosures target minimal vibration and airflow turbulence. Opportunities exist in retrofits for older buildings. Grid-friendly devices can join demand response programs.
- For instance, the Xiaomi Smart Air Purifier 4 Lite features a true HEPA H13 filter certified to capture 99.97% of particles at 0.3 µm, reports a fan curve with lowest noise at 33.4 dB(A), and uses its Mi Home app to enable scheduled operation in four-hour increments and filter-replacement reminders after “air-purified volume” of 5,000 m³”.
Data-Driven Services and Predictive Maintenance
Apps now deliver actionable IAQ insights, not just numbers. Trend charts reveal cooking or traffic patterns. Predictive models estimate filter replacement windows. Parts logistics sync with notifications for quick fulfillment. Remote diagnostics shorten service cycles. APIs let third parties build wellness features. Insurers explore IAQ data for benefits. Employers offer IAQ dashboards to staff. Landlords showcase compliance to tenants. anonymized datasets inform urban planning. New revenue grows from subscriptions and extended warranties.
Portable, Room-Specific, and Niche Solutions
Buyers want right-sized units for bedrooms, nurseries, and home offices. Portable lines target renters and students. Designers develop under-desk, tower, and wall-mount options. Specialized filters address smoke, pollen, and pet dander. Kitchen-focused units tackle cooking aerosols. Industrial micro-zones protect sensitive benches. Travel purifiers suit hotels and co-living. Outdoor-rated models support patios and kiosks. Aesthetic designs blend into modern décor. Modular accessories enable fragrance or humidification add-ons. Retailers bundle room planners and coverage maps.
Key Challenges
Cost, Access, and After-Sales Reliability
Upfront prices remain high for multi-room coverage. Filter costs deter consistent replacement. Rural and tier-two markets face limited-service networks. Counterfeit filters undermine performance and safety. Energy costs discourage continuous operation. Noise complaints reduce nighttime usage. Financing options are uneven across regions. Repair turnarounds vary by brand and city. Warranty terms confuse buyers and reduce trust. Education gaps persist around CADR and room sizing. Clear TCO communication is still rare.
Standards, Claims, and Data Privacy
Certification schemes differ across regions and categories. Consumers struggle to compare CADR, HEPA grades, and TVOC claims. Inconsistent smoke and pollen tests confuse outcomes. Cloud features raise concerns over data sharing. Enterprises demand strict retention and encryption controls. Regulators scrutinize misleading marketing and “ionizer” claims. Interoperability issues hinder ecosystem setups. Firmware security requires sustained vendor commitment. Building codes evolve, adding compliance complexity. Cross-border sales face labeling challenges. Transparent disclosures are now a competitive requirement.
Regional Analysis
Asia-Pacific
The Asia-Pacific region dominates the smart air purifier market, capturing around 41.4% of global share in 2024. The region’s leadership stems from high ambient pollution levels in nations such as China and India, rising urbanization, and increased disposable income enabling the adoption of smart indoor-air solutions. Government initiatives to address air quality, especially in school settings and residential spaces, further drive demand. The combination of health awareness, large untapped markets and smart-home adoption positions Asia-Pacific for continued robust growth.
North America
North America accounts for roughly 35–40% of the smart air-purifier market.This high share reflects strong consumer awareness of indoor-air quality, widespread smart-home ecosystem penetration, and regulatory pressure to improve air environments. The region is characterised by premium product demand and innovation in connected features, giving manufacturers an attractive but competitive landscape with mature uptake.
Europe
Europe accounts for a noteworthy share of the smart air purifier market, supported by strong environmental regulation, sustainability-oriented consumers and high penetration of smart home infrastructure. One source estimates Europe contributed around 32% of global smart air purifier revenue in 2024. The market here emphasizes energy-efficient models, eco-friendly materials and compliance with indoor-air quality directives. Growth in commercial and institutional sectors (e.g., offices, educational facilities) further reinforces Europe’s market position.
Latin America
In Latin America, the smart air purifier market remains modest but emerging, holding about 7% of global share according to recent estimates. Urbanization, rising disposable income and increasing awareness of indoor‐air pollution are key growth enablers. However, adoption is still constrained by economic factors and infrastructure maturity. Manufacturers targeting this region must focus on cost-effective models and local distribution channels to drive penetration.
Middle East & Africa (MEA)
The Middle East & Africa region currently holds the smallest share among the major regions, estimated at roughly 3% of the global smart air purifier market. Nonetheless, it presents growth potential driven by urban-dust challenges, industrial emissions and rising health awareness in urban centres. Markets such as the Gulf states are more oriented toward premium smart devices, while sub-Saharan regions remain price-sensitive, shaping a dual-track adoption dynamic.
Market Segmentations:
By Range
- Below 250 Sq. Ft.
- 250-400 Sq. Ft.
- 401-700 Sq. Ft.
- Above 700 Sq. Ft.
By Sales
By Application
- Commercial
- Residential
- Industrial
By Geography
- North America
- Europe
- Germany
- France
- U.K.
- Italy
- Spain
- Rest of Europe
- Asia Pacific
- China
- Japan
- India
- South Korea
- South-east Asia
- Rest of Asia Pacific
- Latin America
- Brazil
- Argentina
- Rest of Latin America
- Middle East & Africa
- GCC Countries
- South Africa
- Rest of the Middle East and Africa
Competitive Landscape
The smart air purifiers market is highly competitive, with key players focusing on innovation, connectivity, and health-driven design. LG Electronics and Panasonic Corporation lead through AI-integrated air purifiers equipped with real-time air quality monitoring and IoT-enabled controls. Honeywell International, Inc. and Carrier emphasize energy-efficient HEPA filtration systems tailored for both residential and commercial spaces. Koninklijke Philips N.V. and IQAir dominate the premium segment with multi-layer filtration and app-controlled purification performance designed for allergy and asthma sufferers. Whirlpool Corporation and Hamilton Beach Brands, Inc. strengthen their presence through affordable smart models that combine ease of use with effective purification technology. Unilever PLC and Camfi are investing in portable, eco-friendly purifiers targeting urban consumers with compact living spaces. Companies are increasingly adopting sensor-based automation, voice assistant integration, and sustainable filter materials to enhance user experience and maintain competitiveness in the rapidly evolving indoor air quality market.
Shape Your Report to Specific Countries or Regions & Enjoy 30% Off!
Key Player Analysis
- LG Electronics
- Carrier
- IQAir
- Unilever PLC
- Panasonic Corporation
- Hamilton Beach Brands, Inc.
- Honeywell International, Inc.
- Whirlpool Corporation
- Camfi
- Koninklijke Philips N.V.
Recent Developments
- In January 2024, COWAY CO., LTD. launched Airmega 100. It has a 360° air intake and a 3-stage HEPA filtration system that effectively removes harmful pollutants and purifies the air within an 810- square-foot space every hour. The product has a real-time air quality indicator, energy-saving technology, auto mode, and a precise particle sensor, which are some of the important features of this new air purifier.
- In February 2023, the company introduced a new carbon air purifier that uses UV technology to promote healthy indoor air quality. This system helps eliminate unwanted odors, gases, and volatile organic compounds from the air inside the home. Additionally, the technology reduces the growth of microorganisms, such as viruses and bacteria, on the evaporator coil
Report Coverage
The research report offers an in-depth analysis based on Range, Sales, Application, and Geography. It details leading market players, providing an overview of their business, product offerings, investments, revenue streams, and key applications. Additionally, the report includes insights into the competitive environment, SWOT analysis, current market trends, as well as the primary drivers and constraints. Furthermore, it discusses various factors that have driven market expansion in recent years. The report also explores market dynamics, regulatory scenarios, and technological advancements that are shaping the industry. It assesses the impact of external factors and global economic changes on market growth. Lastly, it provides strategic recommendations for new entrants and established companies to navigate the complexities of the market.
Future Outlook
- IAQ regulations tighten, pushing smart purifiers into homes and workplaces.
- Wildfire and dust events sustain demand spikes across multiple regions.
- Energy-efficient motors and eco filters become core buying criteria.
- Interoperability with Matter and major platforms improves user adoption.
- AI features optimize fan speed, noise, and filter life in real time.
- Sensor fusion expands to PM, VOCs, CO₂, and humidity monitoring.
- Subscription filter services grow recurring revenue and retention.
- Commercial deployments scale in schools, healthcare, hospitality, and offices.
- Localized filters address regional pollutants and drive brand preference.
- Emerging markets expand through D2C channels and flexible financing.


