Market Overview
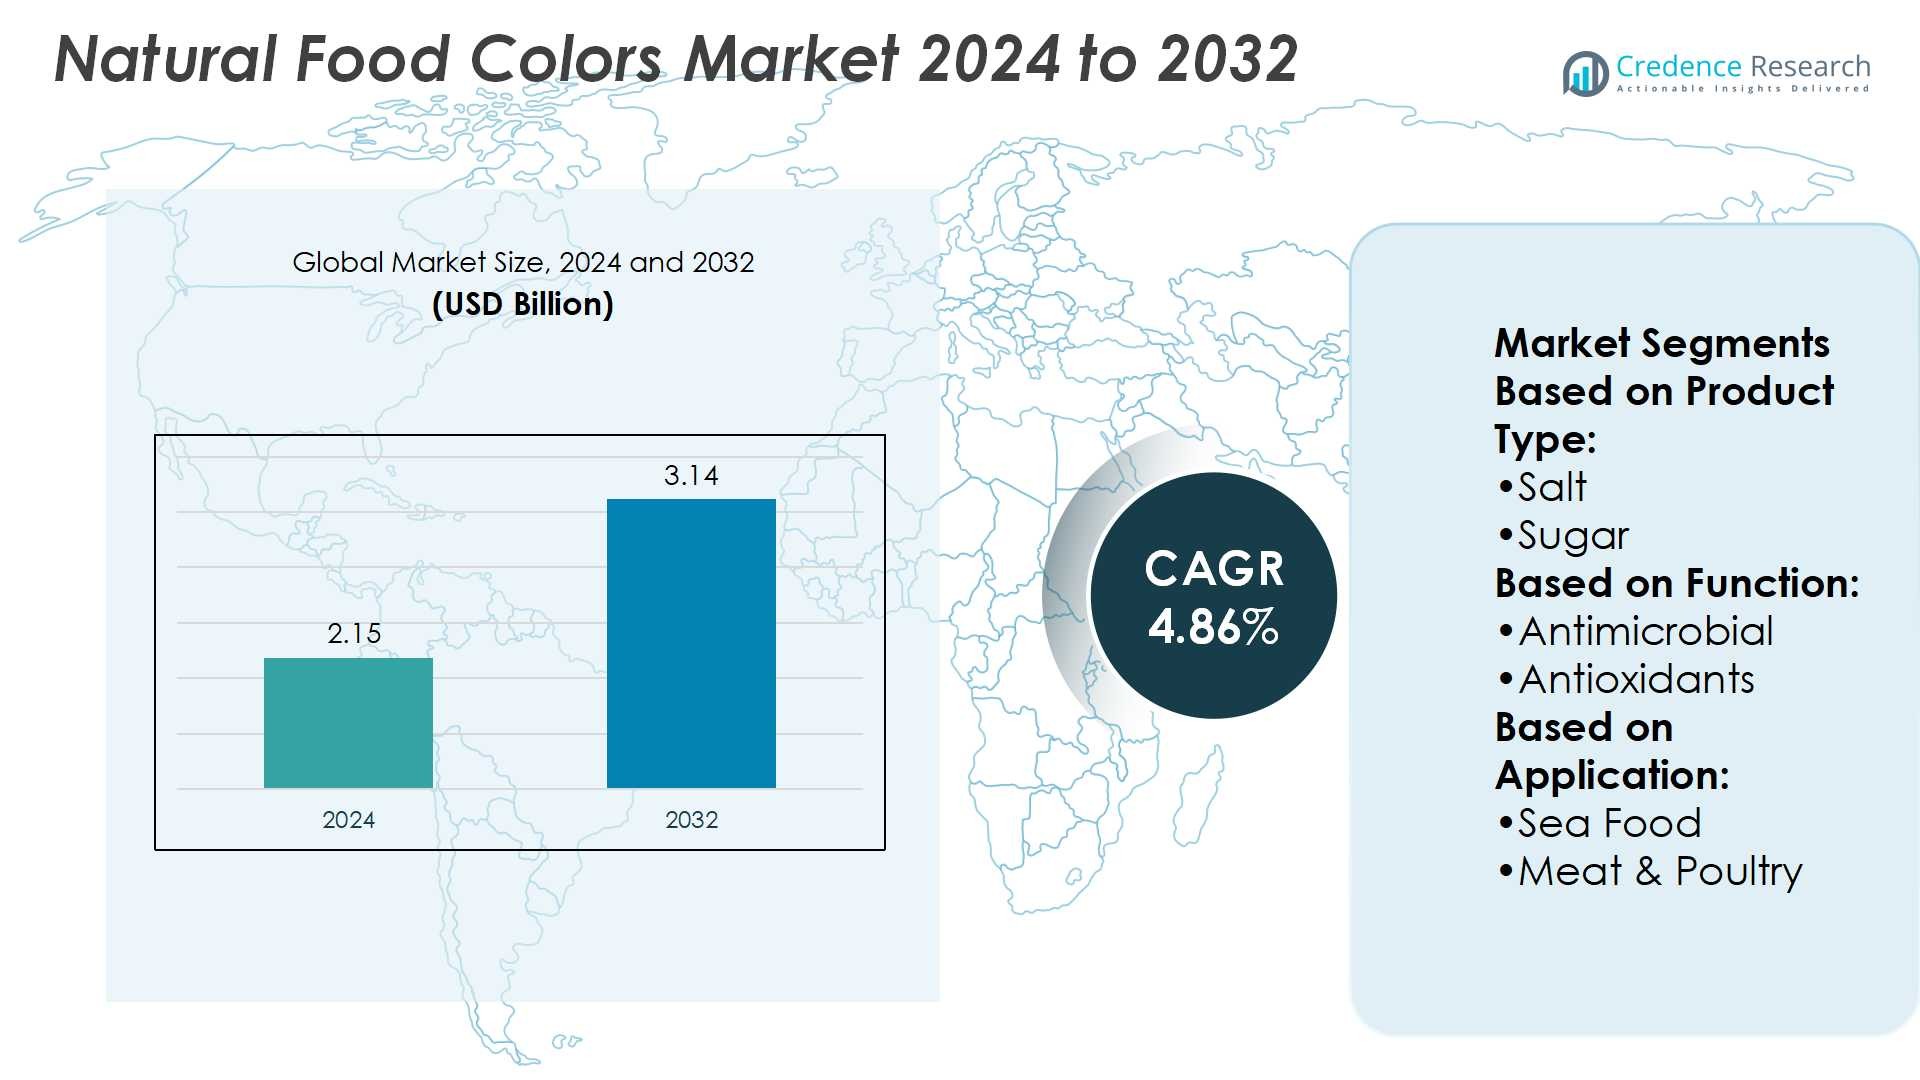
Natural Food Colors Market size was valued at USD 2.15 billion in 2024 and is anticipated to reach USD 3.14 billion by 2032, at a CAGR of 4.86% during the forecast period.
| REPORT ATTRIBUTE |
DETAILS |
| Historical Period |
2020-2023 |
| Base Year |
2024 |
| Forecast Period |
2025-2032 |
| Natural Food Colors Market Size 2024 |
USD 2.15 Billion |
| Natural Food Colors Market, CAGR |
4.86% |
| Natural Food Colors Market Size 2032 |
USD 3.14 Billion |
The Natural Food Colors Market grows through strong drivers such as rising consumer demand for clean-label products, strict regulations limiting synthetic additives, and increasing health awareness that favors plant-based pigments. It benefits from expanding use across bakery, dairy, beverage, and confectionery segments where safety and visual appeal are critical. Key trends include technological advances in encapsulation and fermentation to improve pigment stability, growing preference for sustainable and traceable sourcing, and rising adoption in functional foods that connect color with added nutritional value. Together, these dynamics shape a competitive, innovation-driven market with strong global growth potential.
The Natural Food Colors Market shows strong geographical presence, with North America and Europe leading due to strict regulations and high consumer awareness, while Asia-Pacific emerges as the fastest-growing region supported by urbanization and rising disposable incomes. Latin America and the Middle East & Africa offer steady opportunities through expanding clean-label adoption. Key players such as Cargill, Archer Daniels Midland Company, Kerry Group, Royal DSM, Tate & Lyle, Kemin Industries, Corbion, Naturex (Givaudan), Ajinomoto, and Brenntag drive innovation and global competitiveness.
Access crucial information at unmatched prices!
Request your sample report today & start making informed decisions powered by Credence Research Inc.!
Download Sample
Market Insights
- Natural Food Colors Market size was valued at USD 2.15 billion in 2024 and is expected to reach USD 3.14 billion by 2032, registering a CAGR of 4.86%.
- Rising consumer demand for clean-label products and strict regulations against synthetic additives drive strong adoption.
- Increasing health awareness favors plant-based pigments, boosting demand across bakery, dairy, beverages, and confectionery.
- Technological advances in encapsulation and fermentation improve pigment stability and expand application scope.
- Competition remains strong, with key players investing in innovation, sustainable sourcing, and global distribution networks.
- High production costs and raw material supply chain vulnerabilities restrain broader adoption across smaller manufacturers.
- North America and Europe dominate through strict standards, Asia-Pacific shows fastest growth, while Latin America and Middle East & Africa provide emerging opportunities through rising clean-label adoption.
Market Drivers
Rising Health Awareness and Consumer Preference for Clean Labels
The Natural Food Colors Market grows strongly due to rising global health awareness. Consumers prefer food products free from synthetic additives and chemicals. This shift supports clean-label product development across beverages, confectionery, and dairy. Food manufacturers integrate natural colors to align with consumer trust and transparency. It drives wider adoption in packaged foods that highlight authenticity and safety. Growing rejection of artificial colors reinforces long-term market expansion.
- For instance, Corbion expanded lactic acid capacity at its Blair, Nebraska plant by about 40%, while simultaneously cutting the cradle-to-gate carbon footprint per ton by 9%, all using 100% renewable electricity at the site.
Expanding Use Across Food and Beverage Segments
The Natural Food Colors Market benefits from strong demand across bakery, dairy, and beverage industries. Natural pigments such as carotenoids, anthocyanins, and chlorophyll find use in diverse formulations. It allows manufacturers to meet consumer expectations without sacrificing product appeal. Strong growth in functional beverages and plant-based foods accelerates adoption of these ingredients. Flavor houses and product developers rely on natural solutions for vibrant and safe product presentation. This broad application scope strengthens commercial opportunities.
- For instance, Brenntag Nutrition developed a plant-based spreadable cheese mix that delivers a low carbon footprint of just 2.15 kg CO₂e per kilogram of product, compared to 12.51 kg CO₂e per kilogram from conventional dairy cheese, as verified by TÜV Rheinland and calculated using Brenntag’s proprietary CO2Xplorer tool.
Supportive Regulations and Industry Standards Encouraging Adoption
The Natural Food Colors Market gains momentum from strict regulatory frameworks. Authorities in North America and Europe restrict or phase out artificial additives. It compels manufacturers to reformulate products with safer, plant-derived pigments. Certification requirements for organic and clean-label goods further boost natural color adoption. Regulatory approvals expand opportunities for regional and global suppliers. These supportive policies enhance trust among consumers and food brands.
Innovation and Investment in Sustainable Color Extraction Technologies
The Natural Food Colors Market advances through investment in sustainable extraction and processing methods. New techniques improve pigment stability, shelf life, and color intensity. It ensures consistent quality in processed foods with demanding production conditions. Companies invest in biotechnology and fermentation for cost-effective pigment production. Partnerships with farmers for natural raw material supply improve traceability and sustainability. Continuous innovation creates competitive differentiation and secures long-term market leadership.
Market Trends
Growing Preference for Plant-Based and Sustainable Color Sources
The Natural Food Colors Market reflects a growing trend toward plant-based and sustainable sources. Consumers prefer products derived from fruits, vegetables, and algae due to health and environmental benefits. It drives suppliers to expand portfolios with turmeric, beetroot, and spirulina pigments. Sustainability practices, including traceable sourcing and reduced carbon footprints, strengthen brand loyalty. Companies highlight eco-friendly production in marketing strategies to appeal to conscious buyers. This shift toward greener ingredients defines future product innovation.
- For instance, Kemin partners with U.S. growers on more than 1,100 acres to sustainably cultivate rosemary, supporting traceable extract production for food ingredients at six auditable global sites.
Rising Demand for Stable and Functional Color Solutions
The Natural Food Colors Market shows strong movement toward improved pigment stability and functionality. Heat, light, and pH sensitivity of natural pigments remain a challenge for manufacturers. It drives research into encapsulation, fermentation, and blending methods to enhance performance. Food and beverage companies invest in solutions that maintain vibrant appearance through longer shelf lives. The demand extends to functional foods where color links with health benefits. This focus on technical performance boosts confidence among large-scale processors.
- For instance, BASF’s Nutrition & Health division offers specific vitamin A and E ingredients whose product carbon footprints (PCFs) are at least 20% lower than the global market average, as certified by TÜV Rheinland.
Increasing Penetration in Packaged and Processed Foods
The Natural Food Colors Market expands through greater penetration in packaged and processed foods. Brands reformulate snacks, beverages, and confectionery to meet clean-label demands. It helps manufacturers cater to both premium and mass-market segments. E-commerce platforms highlight natural claims, reinforcing consumer choices. Emerging markets witness faster adoption due to urbanization and modern retail growth. The rising influence of younger demographics accelerates preference for natural alternatives over synthetic ones.
Technological Advancements Driving Innovation in Pigment Extraction
The Natural Food Colors Market advances with continuous innovation in pigment extraction and processing. Supercritical CO₂ extraction, microencapsulation, and precision fermentation deliver higher yields and purity. It enables cost efficiency while supporting consistent performance across varied applications. Technology-driven suppliers differentiate by offering customized shades for specific food categories. Industry collaborations with biotechnology firms expand opportunities for novel pigments. This technological progress ensures adaptability to evolving food industry requirements.
Market Challenges Analysis
High Production Costs and Limited Pigment Stability Restricting Broader Adoption
The Natural Food Colors Market faces challenges due to high production costs and limited pigment stability. Extraction from natural sources requires advanced processes, which increase overall pricing. It restricts adoption among small and medium-sized food manufacturers with limited budgets. Many natural pigments show poor resistance to heat, light, or pH variation during processing. This instability reduces their usability in packaged and processed food applications. Companies must invest heavily in research to overcome these technical barriers and achieve scale.
Supply Chain Vulnerabilities and Regulatory Complexities Affecting Market Growth
The Natural Food Colors Market encounters difficulties from raw material supply chain vulnerabilities and regulatory complexities. Dependence on agricultural crops such as turmeric, paprika, and beetroot exposes producers to climate risks and seasonal fluctuations. It creates inconsistent availability and drives price volatility across global markets. Regulatory requirements vary by region, creating compliance hurdles for manufacturers expanding internationally. The need for certifications and approvals delays product launches and increases costs. These supply and compliance issues limit growth potential despite strong demand.
Market Opportunities
Expanding Scope in Functional Foods and Emerging Economies
The Natural Food Colors Market presents strong opportunities in functional foods and emerging economies. Rising consumer focus on health supports products that combine natural color with nutritional benefits. It encourages the use of carotenoids, anthocyanins, and spirulina for both visual appeal and wellness value. Expanding middle-class populations in Asia-Pacific, Latin America, and Africa drive demand for clean-label packaged foods. Local manufacturers adopt natural pigments to differentiate products in competitive retail environments. This creates room for global suppliers to strengthen market presence through tailored solutions.
Growth Potential Through Innovation and Strategic Collaborations
The Natural Food Colors Market benefits from innovation in biotechnology and collaborative partnerships. Advances in fermentation and encapsulation enable higher pigment yield, improved stability, and cost efficiency. It supports broader use in beverages, bakery, and dairy products where performance is critical. Partnerships between pigment producers, food manufacturers, and research institutions accelerate product development. Collaborations with farmers secure sustainable raw material sourcing and traceability, which align with global supply chain goals. These advancements open new growth pathways for companies targeting long-term industry leadership.
Market Segmentation Analysis:
By Product Type
The Natural Food Colors Market is segmented by product type into salt, sugar, oil, honey, citric acid, vinegar, and others. Salt remains a widely adopted ingredient due to its role in flavor preservation and compatibility with natural pigments. Sugar supports color stability in confectionery and beverages, enhancing product appeal. It enables vibrant presentation in categories targeting younger demographics. Oil plays a role in pigment solubility and delivery across processed foods. Honey and citric acid contribute natural sweetness and acidity, supporting pigment interaction and product shelf life. Vinegar and other natural bases expand the versatility of natural colors in diverse food formulations.
- For instance, Roquette’s new Food Innovation Center in Lestrem, France offers the press release confirms the center occupies 5,000+ sqm of applications laboratories and pilots globally, with the new Lestrem center accounting for over 2,500 m² of that total.
By Function
The market is segmented by function into antimicrobial, antioxidants, and others. Antimicrobial functions gain demand as natural pigments often possess inherent protective properties. It reduces reliance on synthetic preservatives while maintaining product safety. Antioxidants from carotenoids and anthocyanins serve dual purposes of color enhancement and oxidative stability. Their role supports longer shelf life in processed and packaged foods. Other functions, including pH regulation and emulsification, expand usability across niche applications. This functional diversity enhances the value proposition for food manufacturers seeking natural and safe solutions.
- For instance, Tate & Lyle repowered its Brazilian Guarani site powered by 100% renewable energy. Tate & Lyle announced that its manufacturing facility in Guarani, Brazil, had become the first company site to be powered entirely by renewable energy.
By Application
The Natural Food Colors Market is segmented by application into seafood, meat and poultry, and bakery and confectionery. Seafood products benefit from natural colors that maintain freshness and visual appeal. It supports consumer trust in high-value items where appearance drives purchase decisions. Meat and poultry segments integrate natural pigments to align with clean-label initiatives and meet regulatory standards. Bakery and confectionery applications showcase the strongest demand, where vibrant and safe colors enhance product attractiveness. This application breadth ensures consistent adoption across premium and mass-market food categories, driving long-term growth opportunities for global suppliers.
Segments:
Based on Product Type:
Based on Function:
- Antimicrobial
- Antioxidants
Based on Application:
Based on the Geography:
- North America
- Europe
- Germany
- France
- U.K.
- Italy
- Spain
- Rest of Europe
- Asia Pacific
- China
- Japan
- India
- South Korea
- South-east Asia
- Rest of Asia Pacific
- Latin America
- Brazil
- Argentina
- Rest of Latin America
- Middle East & Africa
- GCC Countries
- South Africa
- Rest of the Middle East and Africa
Regional Analysis
North America
North America holds around 35% of the Natural Food Colors Market. The U.S. and Canada show strong demand due to consumer focus on clean labels and food safety. It benefits from strict regulations that push companies to replace synthetic pigments. Large food manufacturers reformulate products to meet these expectations. Innovation in pigment stability and shelf life supports broad applications across bakery, dairy, and beverages. Rising awareness of healthier diets strengthens the region’s leadership position.
Europe
Europe accounts for about 34% of the Natural Food Colors Market. The region is shaped by strict bans on artificial additives and high consumer awareness. Companies expand their product portfolios with sustainable plant-based pigments. It benefits from advanced R&D centers in Germany, France, and the UK. Food and beverage firms highlight transparency and organic certifications to build consumer trust. These dynamics make Europe a hub for innovation and product launches.
Asia-Pacific
Asia-Pacific represents close to 25% of the Natural Food Colors Market, with the fastest growth rate. Rising disposable incomes and urbanization drive strong demand for packaged foods. China and India lead with local sourcing of turmeric, spirulina, and beet pigments. It benefits from cost advantages and government-backed agricultural support. Rapid expansion in retail and e-commerce increases availability of clean-label products. Younger demographics prefer natural alternatives, boosting future adoption.
Latin America
Latin America holds about 4% of the Natural Food Colors Market. Brazil and Mexico lead in both production and consumption. It benefits from agricultural resources like paprika and annatto. Food brands adopt natural pigments to appeal to eco-conscious consumers. Regional trade agreements expand export opportunities to North America and Europe. Though smaller in share, Latin America shows strong long-term growth potential.
Middle East & Africa
The Middle East & Africa account for nearly 2% of the Natural Food Colors Market. It remains an emerging region with rising demand in urban centers. Food safety regulations grow stronger, encouraging natural pigment adoption. Local spice-based sources reduce dependency on imports. It benefits from increasing consumer awareness of health and clean-label trends. Future investments in supply chains may unlock steady growth in this region.
Shape Your Report to Specific Countries or Regions & Enjoy 30% Off!
Key Player Analysis
- Kerry Group
- Ajinomoto Co., Inc.
- Corbion
- Royal DSM
- Brenntag Ingredients, Inc.
- Kemin Industries
- Archer Daniels Midland Company (ADM)
- Cargill, Inc.
- Naturex (Givaudan)
- Tate & Lyle PLC
Competitive Analysis
The Natural Food Colors Market companies including Cargill, Inc., Archer Daniels Midland Company (ADM), Kemin Industries, Corbion, Tate & Lyle PLC, Naturex (Givaudan), Kerry Group, Royal DSM, Ajinomoto Co., Inc., and Brenntag Ingredients, Inc. The Natural Food Colors Market is highly competitive, shaped by innovation, sustainability, and regulatory compliance. Companies focus on expanding product portfolios with pigments that deliver improved stability, vibrant appearance, and extended shelf life. It benefits from advancements in biotechnology, fermentation, and encapsulation, which support cost efficiency and wider application across food categories. Global demand for clean-label and plant-based products pushes manufacturers to invest in research and secure sustainable raw material sourcing. Partnerships with farmers, food producers, and research institutions strengthen supply chains and accelerate product development. Continuous innovation and sustainability initiatives remain central to building long-term competitiveness in this evolving market.
Recent Developments
- In April 2025, the Spanish government, alongside the regional governments of Navarra and La Rioja, introduced Europe’s first AgriFoodtech Sandbox, designed to accelerate technological advancements in the agrifood industry.
- In February 2024, Willow Biosciences secured a strategic investment from Kalsec to advance the development and commercialization of innovative natural food ingredients.
- In January 2024, Ginkgo Bioworks and Phytolon achieved a major milestone by unlocking a full yellow-to-purple color spectrum for Phytolon natural food colors through fermentation.
- In October 2023, Phytolon secured funding to launch its innovative natural food colors made through fermentation, with support from investors like Nextgen Nutrition Investment Partners, EIT Food, and Chairman Steve Dubin.
Report Coverage
The research report offers an in-depth analysis based on Product Type, Function, Application and Geography. It details leading market players, providing an overview of their business,product offerings, investments, revenue streams, and key applications. Additionally, the reportincludes insights into the competitive environment, SWOT analysis, current market trends, as well as the primary drivers and constraints. Furthermore, it discusses various factors that have driven market expansion in recent years. The report also explores market dynamics, regulatory scenarios, and technological advancements that are shaping the industry. It assesses the impact of external factors and global economic changes on market growth. Lastly, it provides strategic recommendations for new entrants and established companies to navigate the complexities of the market.
Future Outlook
- Demand for clean-label and plant-based food products will drive steady market expansion.
- Regulatory pressure against synthetic additives will strengthen adoption of natural pigments.
- Advances in biotechnology and fermentation will improve pigment yield and cost efficiency.
- Encapsulation technologies will enhance stability of pigments across varied food applications.
- Growing use in functional foods will link natural colors with added health benefits.
- Emerging markets in Asia-Pacific, Latin America, and Africa will provide new growth opportunities.
- Strategic collaborations between suppliers and food manufacturers will accelerate innovation pipelines.
- E-commerce platforms will boost visibility and accessibility of natural color products.
- Sustainability initiatives will increase focus on traceable and eco-friendly sourcing practices.
- Continuous R&D investments will secure long-term competitiveness in the global market.


