
| REPORT ATTRIBUTE | DETAILS |
|---|---|
| Historical Period | 2020-2023 |
| Base Year | 2024 |
| Forecast Period | 2025-2032 |
| Natural Vitamin E Product Market Size 2024 | USD 808.1 million |
| Natural Vitamin E Product Market, CAGR | 10.3% |
| Natural Vitamin E Product Market Size 2032 | USD 1,770.39 million |
Market Overview:
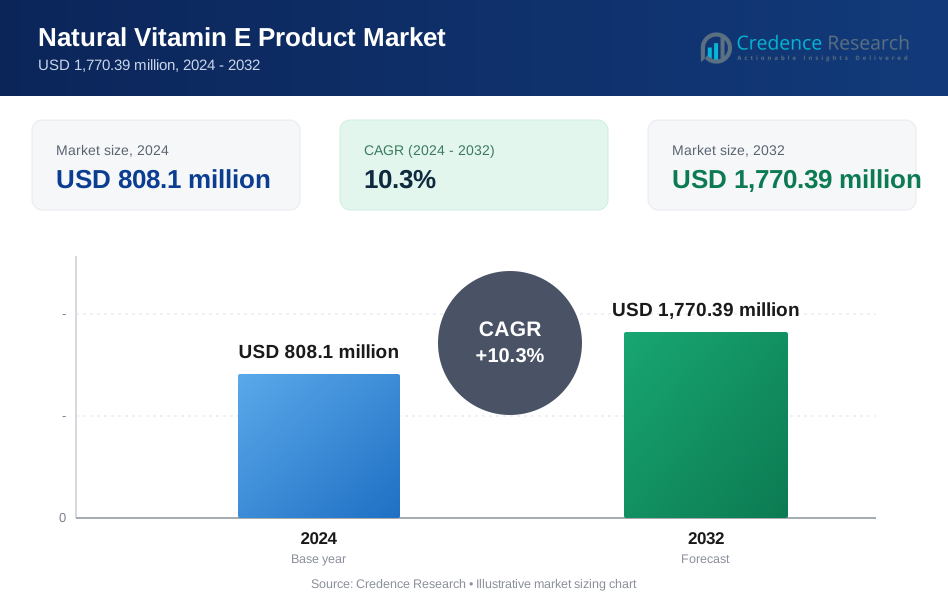
The natural vitamin E product market is projected to grow from USD 808.1 million in 2024 to USD 1,770.39 million by 2032, with a compound annual growth rate (CAGR) of 10.3%.
The natural vitamin E product market is driven by increasing consumer demand for natural and clean-label ingredients, particularly in food, cosmetics, and dietary supplements. Growing awareness of the health benefits of natural vitamin E, such as its antioxidant properties and role in supporting skin health, immune function, and cardiovascular wellness, is fueling its adoption. The expanding geriatric population and rising incidence of chronic diseases further amplify the need for vitamin E-enriched products. Additionally, the shift toward sustainable and plant-based sources aligns with consumer preferences for eco-friendly products. The rise of functional foods and dietary supplements, combined with advancements in extraction techniques and product formulation, is expected to boost market growth. Regional markets like Asia-Pacific are witnessing rapid expansion due to the increased focus on health and wellness. These drivers and trends position the natural vitamin E product market for steady growth in the coming years.
The geographical analysis of the natural vitamin E product market highlights North America, Europe, Asia-Pacific, Latin America, and the Middle East & Africa as key regions. North America holds a significant market share, driven by strong consumer demand for health and wellness products. Europe follows, with a focus on clean-label, natural ingredients, particularly in Germany, France, and the U.K. Asia-Pacific is experiencing the fastest growth, with rising disposable incomes and increasing awareness of natural health products in countries like China, India, and Japan. Latin America, led by Brazil and Argentina, is also expanding, while the Middle East & Africa shows moderate growth, driven by demand for natural cosmetics. Key players in these regions include Archer Daniels Midland, BASF SE, Koninklijke DSM, and others, who are actively competing to capture regional opportunities.
Market Insights:
- The natural vitamin E product market is projected to grow from USD 808.1 million in 2024 to USD 1,770.39 million by 2032, with a CAGR of 10.3%.
- Increasing demand for natural, clean-label ingredients in food, cosmetics, and dietary supplements is driving market growth.
- Rising awareness of the health benefits of natural vitamin E, including antioxidant properties, supports its adoption across industries.
- The expanding geriatric population and prevalence of chronic diseases are boosting the need for vitamin E-enriched products.
- Growing consumer preferences for eco-friendly, sustainable, plant-based sources further contribute to market expansion.
- Asia-Pacific is expected to witness the fastest growth, while North America and Europe will hold significant market shares in 2024.
- Advancements in extraction techniques and product formulation are enhancing the quality and availability of natural vitamin E products.
Market Drivers:
Rising Consumer Demand for Natural and Clean-Label Ingredients:
The increasing shift toward natural and clean-label products is a key driver of the natural vitamin E product market. Consumers are becoming more health-conscious, preferring products derived from natural sources over synthetic alternatives. This demand is particularly prevalent in the food, cosmetics, and dietary supplement industries, where transparency about ingredient sourcing and processing is highly valued. As a result, manufacturers are incorporating natural vitamin E into their product offerings, fueling market growth.
Health Awareness and Benefits of Natural Vitamin E:
Natural vitamin E is widely recognized for its powerful antioxidant properties, contributing to skin health, immune system support, and cardiovascular wellness. Rising health awareness among consumers, coupled with the growing prevalence of chronic diseases such as cardiovascular disorders and diabetes, is driving demand for natural vitamin E-enriched products. The increasing availability of research highlighting these benefits has further boosted its market appeal.
Expanding Geriatric Population and Focus on Preventive Healthcare:
The global aging population is contributing significantly to the growth of the natural vitamin E market. For instance, SeniorHealth includes natural vitamin E in their supplement line to support healthy aging. Older individuals are more prone to age-related diseases, which has led to increased demand for preventive healthcare solutions, including supplements containing natural vitamin E. Its role in reducing oxidative stress and supporting healthy aging has positioned it as a vital component in geriatric nutrition. The rising focus on maintaining wellness and preventing age-related conditions continues to drive market expansion.
Sustainability and Eco-Friendly Product Preferences:
Sustainability trends are shaping consumer preferences across industries, and the natural vitamin E market is no exception. For instance, Kensing produces plant-based vitamin E extracted from sustainable feedstocks such as vegetable oils. Their vitamin E products boast at least 96% purity and are non-GMO, PCR-negative, and Halal/Kosher certified. Consumers are increasingly opting for plant-based, eco-friendly products. This alignment with sustainability trends enhances the appeal of natural vitamin E products and drives market growth.
Market Trends:
Growing Preference for Organic and Plant-Based Sources:
A key trend in the natural vitamin E product market is the increasing preference for organic and plant-based sources. This trend is particularly prominent in the dietary supplement and personal care industries, where organic certifications and clean-label claims are becoming important selling points.
Rising Demand in Functional Foods and Beverages:
The demand for functional foods and beverages enriched with natural vitamin E is on the rise. As consumers prioritize health and wellness, they are gravitating towards products that offer additional nutritional benefits. Natural vitamin E’s antioxidant properties and its role in supporting overall health make it a popular ingredient in fortified foods and drinks. This trend is expected to grow further as the functional food market continues to expand globally.
Innovation in Extraction and Formulation Techniques:
Advancements in extraction technologies and product formulations are driving innovation in the natural vitamin E market. Manufacturers are investing in research to develop such advancements. For instance, Archer Daniels Midland Company’s (ADM) Novatol® Natural-Source Vitamin E is sourced from vegetable oils, providing a plant-based alternative for customers wanting to comply with the U.S. Food and Drug Administration’s new labeling regulations. Additionally, new formulations, such as microencapsulation, are enhancing the stability and bioavailability of natural vitamin E in various applications, allowing for broader use in food, cosmetics, and supplements.
Increasing Adoption in Emerging Markets:
Emerging markets, particularly in the Asia-Pacific region, are witnessing a surge in demand for natural vitamin E products. For instance, BTSA offers Oxabiol E feed, a natural vitamin E tocopherol P powder extracted from non-GMO vegetables, available in concentrations from 250 to 1300 International Units, to meet the rising demand for animal-quality meat. As more consumers in these regions become conscious of the benefits of natural ingredients, the adoption of natural vitamin E products is expected to rise significantly, offering growth opportunities for global manufacturers.
Market Challenges Analysis:
High Production Costs and Limited Raw Material Availability:
One of the major challenges facing the natural vitamin E product market is the high production cost associated with its extraction and manufacturing processes. Natural vitamin E is typically sourced from vegetable oils, such as sunflower, soybean, and palm oil. However, the extraction process for obtaining pure and high-quality natural vitamin E from these sources is complex, labor-intensive, and costly. This, in turn, drives up the price of the final product, making it less competitive compared to synthetic alternatives. Additionally, fluctuations in the availability and price of raw materials, such as vegetable oils, due to factors like seasonal variations, agricultural challenges, and geopolitical issues, further contribute to production cost volatility. For instance, : In June 2022, Kensing, LLC, a manufacturer of natural vitamin E, acquired Vitae Naturals, a producer of plant sterol esters and non-GMO natural vitamin E derivatives. As a result, manufacturers often struggle to balance cost-efficiency with maintaining the premium quality of natural vitamin E, limiting its wider adoption, particularly in price-sensitive markets. These cost challenges may also impact innovation and R&D investments needed to improve production methods.
Regulatory Compliance and Market Fragmentation:
Regulatory compliance is another significant challenge in the natural vitamin E product market. Different regions have varying regulations governing the production, labeling, and marketing of dietary supplements and food additives, including natural vitamin E. These regulations can be complex and subject to frequent changes, posing a compliance burden for manufacturers. For instance, ensuring that natural vitamin E products meet stringent purity standards and contain no harmful contaminants requires continuous quality control, which adds to operational costs. Moreover, the market is highly fragmented, with a mix of large multinational companies and smaller local players. This fragmentation can lead to inconsistent product quality, making it difficult for consumers to differentiate between high-quality natural vitamin E and inferior products. The presence of counterfeit or low-quality products in some markets further erodes consumer trust and poses reputational risks for established brands. Overcoming these regulatory and market fragmentation challenges requires sustained investment in quality control, compliance systems, and consumer education, which can be burdensome for smaller players. These complexities can slow down market penetration and restrict growth opportunities for new entrants.
Market Opportunities:
The natural vitamin E product market presents significant growth opportunities driven by the rising consumer focus on health and wellness. Increasing awareness of the benefits of natural vitamin E, including its antioxidant properties and role in promoting skin health, immune function, and cardiovascular health, creates a fertile ground for market expansion. As consumers become more selective about the ingredients in their supplements and food products, there is a growing demand for clean-label, non-synthetic options. Manufacturers that can successfully position their products as natural, sustainable, and health-enhancing will be well-positioned to capture this expanding market. Additionally, the shift towards preventive healthcare, especially among aging populations, provides an opportunity for natural vitamin E to be marketed as part of a proactive approach to health management.
Another promising opportunity lies in the increasing demand for natural vitamin E in the cosmetics and personal care industry. The global trend toward clean beauty and natural skincare has created a surge in demand for natural antioxidants, such as vitamin E, which is known for its skin-nourishing and anti-aging properties. As consumers look for products with fewer chemicals and more natural ingredients, manufacturers that incorporate natural vitamin E into their formulations stand to benefit. Furthermore, as emerging markets, particularly in Asia-Pacific, continue to grow economically and embrace wellness trends, the demand for natural vitamin E products is expected to rise, opening up new geographical opportunities for global and regional players to expand their footprint. These factors together present a favorable outlook for the natural vitamin E product market in the coming years.
Market Segmentation Analysis:
By Type
The natural vitamin E product market is segmented into tocopherols and tocotrienols. Tocopherols dominate the market due to their widespread use in dietary supplements and fortified foods, driven by their antioxidant and health-enhancing properties. Tocotrienols, though less common, are gaining popularity due to emerging research highlighting their superior antioxidant potential and cardiovascular benefits, leading to increased demand in niche applications.
By Application
The market is further segmented by application into dietary supplements, food and beverages, cosmetics, and animal nutrition. Dietary supplements account for the largest share, as consumers seek natural alternatives for health and wellness. The cosmetics sector is also experiencing significant growth, driven by the demand for natural skincare solutions. In food and beverages, the trend toward functional ingredients has fueled the incorporation of natural vitamin E as a fortifying agent, while animal nutrition sees rising demand for improving pet health.
Segments:
Based on Type
- Tocopherols
- Tocotrienols
Based on Application
- Dietary Supplements
- Food and Beverages
- Cosmetics
- Others
Based on the Geography:
- North America
- U.S.
- Canada
- Mexico
- Europe
- Germany
- France
- U.K.
- Italy
- Spain
- Rest of Europe
- Asia Pacific
- China
- Japan
- India
- South Korea
- South-east Asia
- Rest of Asia Pacific
- Latin America
- Brazil
- Argentina
- Rest of Latin America
- Middle East & Africa
- GCC Countries
- South Africa
- Rest of the Middle East and Africa
Regional Analysis:
North America:
North America is expected to hold a significant share of the natural vitamin E product market in 2024, accounting for 30% of the global market. The region’s market growth is driven by the high consumer demand for health and wellness products, including dietary supplements, functional foods, and clean-label cosmetics. The U.S. dominates the North American market, where increasing awareness of the health benefits of natural vitamin E, such as its antioxidant properties, continues to fuel demand. Regulatory support for clean-label products and rising interest in preventive healthcare are also propelling market growth. Additionally, the growing geriatric population and increasing incidence of chronic diseases such as cardiovascular disorders are further driving the adoption of natural vitamin E-based products.
Europe
Europe is projected to hold 25% of the global market share in 2024. The demand for natural vitamin E in Europe is primarily driven by the region’s stringent regulations regarding the use of synthetic additives in food, cosmetics, and dietary supplements. Consumers in Europe are increasingly inclined toward natural and organic products, and this trend has been particularly strong in countries like Germany, France, and the U.K. The growing emphasis on clean-label and plant-based ingredients in food products has created significant opportunities for the natural vitamin E market. Additionally, the cosmetic and personal care sector in Europe, known for its high standards and natural product preferences, is contributing to the market’s expansion.
Asia-Pacific
Asia-Pacific is expected to witness the highest growth rate and hold 20% of the global market share in 2024. The region’s rapid economic growth, particularly in countries such as China, India, and Japan, is contributing to increasing disposable incomes and growing awareness of health and wellness. The demand for natural vitamin E products in the dietary supplement and cosmetics sectors is rising sharply, driven by consumer preferences for natural, eco-friendly ingredients. Additionally, the growing focus on pet nutrition in the region provides further opportunities for market growth. As the health and wellness trend continues to rise, Asia-Pacific is poised to become a key growth market for natural vitamin E products.
Latin America
Latin America is anticipated to hold 10% of the global market share in 2024. The region’s market is primarily driven by the increasing consumer awareness of the benefits of natural vitamin E, especially in countries like Brazil and Argentina. The food and beverage industry’s push toward fortifying products with natural ingredients is expected to contribute to market growth. Additionally, the rising demand for clean-label cosmetics and dietary supplements in the region presents a favorable market outlook.
Middle East and Africa
The Middle East and Africa are projected to account for 5% of the global market share in 2024. Although the market is smaller compared to other regions, there is growing demand for natural vitamin E products, particularly in the cosmetics and food sectors. Increasing consumer awareness of the health benefits of natural ingredients, coupled with a growing interest in premium skincare products, is expected to drive growth in the coming years.
Key Player Analysis:
- Herbalife International of America, Inc.
- Matrix Fine Sciences Pvt. Ltd.
- Puritan's Pride
- BASF SE
- Organic Technologies
- Healthful International Co., Ltd. (HSF)
- Archer Daniels Midland Company
- Nature's Bounty Co.
- Amway Corporation
- Koninklijke DSM N.V.
Competitive Analysis:
The natural vitamin E product market is highly competitive, with leading players such as Archer Daniels Midland Company, BASF SE, Koninklijke DSM N.V., Matrix Fine Sciences Pvt. Ltd., Amway Corporation, Herbalife International of America, Inc., Healthful International Co., Ltd. (HSF), Organic Technologies, Nature's Bounty Co., and Puritan's Pride actively vying for market share. These companies focus on product innovation, expanding production capacity, and strategic acquisitions to strengthen their market position. They are investing in research and development to enhance product quality and develop advanced extraction techniques, ensuring higher purity and efficacy of natural vitamin E. Additionally, these companies are capitalizing on growing consumer demand for clean-label, sustainable products by sourcing vitamin E from eco-friendly, non-GMO sources. The intense competition is further driven by efforts to expand distribution networks, penetrate emerging markets, and offer premium products that align with evolving consumer preferences for natural, health-enhancing ingredients.
Recent Developments:
- In November 2023, Excel Vite Inc. launched a groundbreaking pet supplement, EVFurryAid PRO, at the Federation of Asian Veterinary Associations (FAVA) Congress 2023. EVFurryAid PRO is a natural health product that combines ProVitamin A carotenoids, vitamin E tocotrienols, phytosterols, and other palm oil nutrients, without any preservatives.
- In October 2023, Kensing LLC acquired Advanced Organic Materials (AOM), a producer of natural vitamin E, mixed tocopherols, and phytosterols, with facilities in Spain and Argentina. The acquisition provided both companies the chance to leverage their combined strengths to improve performance and broaden their geographic reach.
- In August 2023, Archer Daniels Midland Company strengthened its presence in the Chinese pet market with the introduction of its Ganador, Minino, and Protexin brands. The Minino brand offers a variety of pet food products enriched with ingredients like vitamin E.
- In August 2023, Matrix Life Science introduced premium quality natural Vitamin E products extracted from non-GMO oilseeds. These products are available in various forms, including oil and powder, catering to diverse industries such as pharmaceuticals and cosmetics. The company emphasizes its commitment to high-quality standards and innovation in natural antioxidants.
Market Concentration & Characteristics:
The natural vitamin E product market is characterized by moderate market concentration, with a mix of large multinational corporations and smaller regional players. Key companies such as Archer Daniels Midland Company, BASF SE, and Koninklijke DSM N.V. hold significant market shares due to their extensive product portfolios, global reach, and strong research and development capabilities. The market remains competitive, with players focusing on innovation, product differentiation, and sustainable sourcing to meet evolving consumer preferences. The market also exhibits high product diversity, with natural vitamin E being utilized across various applications such as dietary supplements, cosmetics, functional foods, and animal nutrition. Demand for natural, clean-label products is driving growth, while sustainability and eco-friendly sourcing are critical characteristics shaping product development. Additionally, advancements in extraction techniques and the growing focus on preventive healthcare are encouraging further market expansion and creating opportunities for new entrants and niche players.
Report Coverage:
The research report offers an in-depth analysis based on Type, Application and Geography. It details leading market players, providing an overview of their business, product offerings, investments, revenue streams, and key applications. Additionally, the report includes insights into the competitive environment, SWOT analysis, current market trends, as well as the primary drivers and constraints. Furthermore, it discusses various factors that have driven market expansion in recent years. The report also explores market dynamics, regulatory scenarios, and technological advancements that are shaping the industry. It assesses the impact of external factors and global economic changes on market growth. Lastly, it provides strategic recommendations for new entrants and established companies to navigate the complexities of the market.
Future Outlook:
- The natural vitamin E market is expected to witness steady growth driven by rising consumer demand for clean-label and natural ingredients.
- Increasing awareness of the health benefits of natural vitamin E will continue to boost its use in dietary supplements and functional foods.
- The cosmetics industry will see expanded use of natural vitamin E due to its antioxidant properties and growing demand for eco-friendly skincare products.
- Asia-Pacific will experience the fastest market growth, fueled by rising disposable incomes and health-conscious consumers in countries like China and India.
- Advances in extraction technology will improve the efficiency and quality of natural vitamin E production, lowering costs.
- Sustainability and eco-friendly sourcing of raw materials will remain a key focus for manufacturers to meet consumer preferences.
- The aging global population will drive demand for vitamin E-enriched products in geriatric nutrition.
- Market competition will intensify as companies invest in innovation and product differentiation.
- Regulatory support for natural, non-GMO products will contribute to market expansion.
- Emerging markets will present new growth opportunities for key players as consumer awareness increases globally.
Request a Free Sample
Fill in your details and we'll send you a free sample report.
- Sample data tables & charts
- Research methodology
Need a Custom Version of This Report?
Tailor the scope, geography, or segments to your exact requirements.
- Custom geography or segment scope
- Direct access to our analyst team
Frequently Asked Questions
What is the current size of the Natural Vitamin E Product market?
What factors are driving the growth of the Natural Vitamin E Product market?
What are the key segments within the Natural Vitamin E Product market?
Who are the major players in the Natural Vitamin E Product market?
Table of Content
Chapter 1. Report Introduction
- 1.1 Report Description & Purpose
- 1.1.1 Report Title & Market Definition
- 1.1.2 Unique Selling Propositions (USP) & Key Differentiators
- 1.1.3 Value Proposition for Stakeholders
- 1.2 Research Objectives
- 1.2.1 Market Sizing Objectives (Volume & Revenue)
- 1.2.2 Segmentation Objectives
- 1.2.3 Competitive Intelligence Objectives
- 1.2.4 Forecast & Scenario Objectives
- 1.3 Report Scope
- 1.3.1 Natural Vitamin E Product Scope – Types & Subtypes Covered
- 1.3.2 Geographic Scope – Regions & Countries Covered
- 1.3.3 Historical Period, Base Year & Forecast Period (2024; forecast to 2032)
- 1.3.4 Inclusions & Exclusions
- 1.4 HS Code & Classification Framework
- 1.5 Currency, Units & Pricing Basis
- 1.6 Target Stakeholders
- 1.7 Limitations & Assumptions
Chapter 2. Executive Summary
- 2.1 Global Natural Vitamin E Product Market Snapshot
- 2.1.1 Market Size – Historical (2024) & Forecast (2024-2032) (2024: USD 808.1 million → 2032: USD 1,770.39 million)
- 2.1.2 Volume & Revenue – Global Totals
- 2.1.3 Key Market Highlights – Top Five Facts
- 2.2 Natural Vitamin E Product Market Segmentation Snapshot
- 2.2.1 Market Split by Region – 2024 vs. 2032
- 2.3 Competitive Snapshot
- 2.3.1 Top 10 Players by Revenue Share – 2024
- 2.3.2 Top 10 Players by Volume Share – 2024
- 2.3.3 Recent Strategic Developments (18-Month Summary)
- 2.4 Key Investment Highlights & Strategic Conclusions
Chapter 3. Natural Vitamin E Product Market Dynamics & Industry Analysis
- 3.1 Market Overview & Context
- 3.1.1 Natural Vitamin E Product Market Position in the Broader Automotive Value Chain
- 3.1.2 OEM vs. Replacement Market Dynamics
- 3.1.3 Market Maturity & Development Stage by Region
- 3.2 Natural Vitamin E Product Market Drivers
- 3.3 Natural Vitamin E Product Market Restraints & Challenges
- 3.4 Natural Vitamin E Product Market Opportunities
- 3.5 Porter's Five Forces Analysis
- 3.5.1 Threat of New Entrants
- 3.5.2 Bargaining Power of Suppliers
- 3.5.3 Bargaining Power of Buyers
- 3.5.4 Threat of Substitutes
- 3.5.5 Competitive Rivalry – Intensity Assessment
- 3.6 Natural Vitamin E Product Value Chain Analysis
- 3.6.1 Upstream – Raw Material/Input Suppliers
- 3.6.1.1 Raw Material/Input 1
- 3.6.1.2 Raw Material/Input 2
- 3.6.1.3 Raw Material/Input 3
- 3.6.2 Midstream – Production/Manufacturing/Service Delivery
- 3.6.2.1 Production/Process Overview
- 3.6.2.2 Key Facility Locations & Capacity by Manufacturer
- 3.6.3 Downstream – Distribution & End Consumer
- 3.6.3.1 Primary Channel – B2B/OEM
- 3.6.3.2 Secondary Channels – Dealer, Retail, Online, Direct
- 3.6.4 Value Chain Profitability Analysis
- 3.6.1 Upstream – Raw Material/Input Suppliers
- 3.7 PESTEL Analysis
- 3.7.1 Political Factors
- 3.7.2 Economic Factors
- 3.7.3 Social Factors
- 3.7.4 Technological Factors
- 3.7.5 Environmental Factors
- 3.7.6 Legal Factors
- 3.8 Natural Vitamin E Product Supply Chain Analysis
- 3.8.1 Raw Material/Input Supply Risk Assessment
- 3.8.2 Manufacturing Concentration Risk (Geographic Exposure)
- 3.8.3 Trade Disruption Impact Analysis
- 3.9 Regulatory & Policy Landscape
Note: The regulatory and policy landscape section covers regulations based on their applicability to the market, Natural Vitamin E Product category, geography, and scope of the study. Only regulatory frameworks with a material impact on operations, compliance, trade, sustainability, or market access are analyzed in detail.
Chapter 4. Key Investment Pockets & Opportunity Analysis
- 4.1 Natural Vitamin E Product Market Attractiveness Analysis
- 4.1.1 By Region – Investment Attractiveness Matrix (Volume × CAGR)
- 4.2 Absolute Revenue Growth Opportunity
- 4.2.1 By Region – Absolute USD Growth Through 2032
- 4.3 Incremental Volume Opportunity
- 4.3.1 By Region – Incremental Volume Through 2032
- 4.3.2 Segment – Incremental Volume
- 4.4 Emerging Submarket Opportunity Deep Dive (Subject to Applicability)
- 4.5 Emerging Market Opportunity Scorecards
- 4.5.1 United States
- 4.5.2 Europe
- 4.5.3 Asia
- 4.5.4 Middle East & Africa
Note: Emerging Market Opportunity Scorecards will be included based on relevance and strategic importance. Regions listed are indicative and may vary depending on data availability and market dynamics.
Chapter 5. Natural Vitamin E Product Import-Export Analysis & Trade Flows
- 5.1 Global Trade Overview
- 5.1.1 Global Export Value by Country (2024)
- 5.1.2 Global Export Volume by Country (2024)
- 5.1.3 Global Import Value by Country (2024)
- 5.1.4 Global Import Volume by Country (2024)
- 5.1.5 Net Trade Balance by Country (2024)
- 5.2 Export Analysis – Segment
- 5.2.1 Type 1 (HS Code)
- 5.2.2 Type 2 (HS Code)
- 5.2.3 Type 3 (HS Code)
- 5.2.4 Type 4 (HS Code)
- 5.2.5 Type 5 (HS Code)
- 5.3 Import Analysis – Segment
- 5.3.1 Type 1 (HS Code)
- 5.3.2 Type 2 (HS Code)
- 5.3.3 Type 3 (HS Code)
- 5.3.4 Type 4 (HS Code)
- 5.3.5 Type 5 (HS Code)
- 5.4 Average Unit Trade Prices
- 5.4.1 Average Export Price – Segment & Country
- 5.4.2 Average Import Price – Segment & Source Country
- 5.4.3 Price Trends (2024)
- 5.5 Key Trade Route Analysis
- 5.5.1 Trade Route 1
- 5.5.2 Trade Route 2
- 5.5.3 Trade Route 3
- 5.5.4 Trade Route 4
- 5.5.5 Trade Route 5
- 5.6 Trade Policy Impact Assessment
- 5.6.1 US Anti-Dumping & Section 301 Tariffs
- 5.6.2 EU Customs Union Impact
- 5.6.3 Major Free Trade Agreements
- 5.6.4 USMCA Rules of Origin
Note: Trade policy analysis will be included only where relevant to the Natural Vitamin E Product market.
Chapter 6. Competitive Landscape & Company Benchmarking
- 6.1 Natural Vitamin E Product Market Concentration & Structure
- 6.1.1 Herfindahl-Hirschman Index (HHI) – vs. 2024
- 6.1.2 Tier 1, Tier 2 & Tier 3 Market Structure
- 6.1.3 Global, Regional & Local Player Dynamics
- 6.2 Natural Vitamin E Product Market Share Analysis – 2024
- 6.2.1 Global Revenue Share by Company
- 6.2.2 Global Volume Share by Company
- 6.2.3 Regional Revenue Share
- 6.2.4 Market Share Evolution ( vs. 2024)
- 6.2.5 OEM Segment Share by Company
- 6.2.6 Replacement Segment Share by Company
- 6.3 Production/Delivery Capacity & Facility Analysis
- 6.3.1 Global Installed Capacity
- 6.3.2 Capacity Utilization Rates
- 6.3.3 Production/Output Volume
- 6.3.4 Facility Locations & Capacity Map
- 6.3.5 Planned Capacity Additions
- 6.4 Natural Vitamin E Product Competitive Benchmarking Matrix
- 6.4.1 Revenue, Volume, CAGR & Profitability Comparison
- 6.4.2 Channel Revenue Mix
- 6.4.3 Geographic Revenue Exposure
- 6.4.4 R&D Intensity
- 6.4.5 Sustainability Maturity
- 6.5 Strategic Developments in Natural Vitamin E Product (Last 24 Months)
- 6.5.1 Mergers, Acquisitions & Divestments
- 6.5.2 New Natural Vitamin E Product Launches
- 6.5.3 Facility Expansions
- 6.5.4 Strategic Alliances, Joint Ventures & Partnerships
- 6.5.5 Distribution Expansion & Market Entry
- 6.5.6 Sustainability & ESG Initiatives
- 6.6 Competitive Strategy Mapping
- 6.6.1 Leader, Challenger, Follower & Niche Classification
- 6.6.2 Pricing Strategy Comparison
- 6.6.3 Channel Strategy Matrix
Note: Strategic developments are included based on their materiality and the availability of reliable information.
Chapter 7. Global Natural Vitamin E Product Market – By Distribution Channel
- 7.1 Segment Overview
- 7.1.1 Volume & Revenue Split by Channel (2024 & 2032)
- 7.1.2 Channel Mix Evolution (2024-2032)
Chapter 8. Regional Market Analysis – Global Overview
- 8.1 Global Regional Overview
- 8.1.1 Regional Volume Share
- 8.1.2 Regional Revenue Share
- 8.1.3 Regional Volume by Region
- 8.1.4 Regional Revenue by Region
- 8.1.5 Regional Forecast Through 2032
- 8.2 Cross-Regional Segment Analysis
- 8.2.1 By Distribution Channel
- 8.2.2 By Brand/Price Tier
Chapter 9. North America Natural Vitamin E Product Market
- 9.1 United States
- 9.2 Canada
- 9.3 Mexico
Chapter 10. Europe Natural Vitamin E Product Market
- 10.1 Germany
- 10.2 France
- 10.3 Italy
- 10.4 United Kingdom
- 10.5 Spain
- 10.6 Poland
- 10.7 Russia
- 10.8 Netherlands
- 10.9 Belgium
- 10.10 Sweden
- 10.11 Denmark
- 10.12 Norway
- 10.13 Rest of Europe
Chapter 11. Asia Pacific Natural Vitamin E Product Market
- 11.1 China
- 11.2 India
- 11.3 Japan
- 11.4 South Korea
- 11.5 Thailand
- 11.6 Indonesia
- 11.7 Vietnam
- 11.8 Malaysia
- 11.9 Australia
- 11.10 Rest of Asia Pacific
Chapter 12. Latin America Natural Vitamin E Product Market
- 12.1 Brazil
- 12.2 Argentina
- 12.3 Colombia
- 12.4 Chile
- 12.5 Rest of Latin America
Chapter 13. Middle East Natural Vitamin E Product Market
- 13.1 Saudi Arabia
- 13.2 United Arab Emirates
- 13.3 Turkey
- 13.4 Israel
- 13.5 Iran
- 13.6 Rest of the Middle East
Chapter 14. Africa Natural Vitamin E Product Market
- 14.1 South Africa
- 14.2 Egypt
- 14.3 Nigeria
- 14.4 Morocco
- 14.5 Rest of Africa
Chapter 15. Natural Vitamin E Product Company Profiles
- 15.1 [Company 01]
- 15.1.1 Company Overview
- 15.1.2 Key Management Personnel
- 15.1.3 Products & Services Portfolio
- 15.1.4 Financial Performance
- 15.1.5 Key Market Focus & Geographic Presence
- 15.1.6 Recent Developments & Strategic Initiatives
Note: The company profile list is preliminary and may change based on research findings, market developments, data availability, and client requirements.
Chapter 16. Appendices
- Appendix A – List of Abbreviations & Acronyms
- Appendix B – Industry Classification Code Reference – Full Series
- Appendix C – Production & Capacity Data Tables
- Appendix D – End-Use & Demand Base Tables
- Appendix E – Consumption & Replacement Rate Assumptions
- Appendix F – ASP Reference Tables
- Appendix G – Manufacturing & Facility Database
- Appendix H – Import-Export Data Tables
- Appendix I – Regulatory Summary Tables
- Appendix J – Primary Research Participant List (Anonymized)
- Appendix K – Primary Research Questionnaire Framework
- Appendix L – Data Sources & Bibliography
- Appendix M – Market Size Divergence & Source Comparison
Chapter 17. Research Methodology
- 17.1 Research Framework & Philosophy
- 17.2 Secondary Research – Sources, Hierarchy & Data Extraction
- 17.3 Data Modeling – Bottom-Up & Top-Down Market Sizing
- 17.4 Primary Research – Stakeholder Framework, LOI & Sample Sizes
- 17.5 Forecast Methodology – Regression, Scenario & Sensitivity Analysis
- 17.6 Quality Control – Four-Layer Validation Framework
- 17.7 Limitations & Standard Assumptions
- 17.8 Disclaimer
