CHAPTER NO. 1 : GENESIS OF THE MARKET
1.1 Market Prelude – Introduction & Scope
1.2 The Big Picture – Objectives & Vision
1.3 Strategic Edge – Unique Value Proposition
1.4 Stakeholder Compass – Key Beneficiaries
CHAPTER NO. 2 : EXECUTIVE LENS
2.1 Pulse of the Industry – Market Snapshot
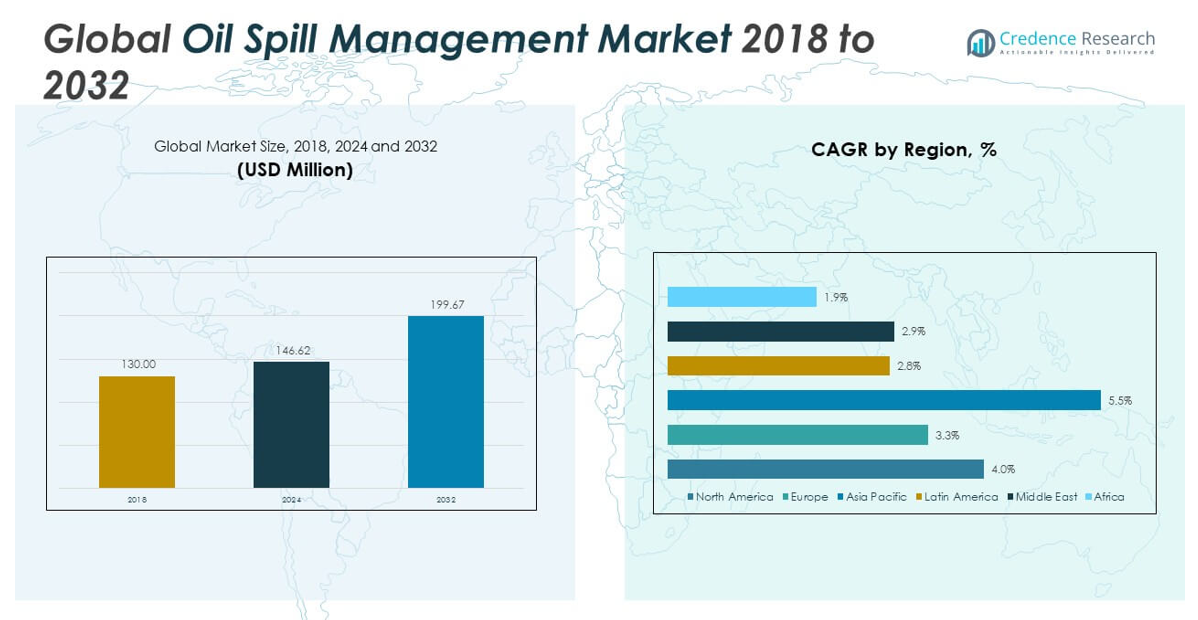
2.2 Growth Arc – Revenue Projections (USD Million)
2.3. Premium Insights – Based on Primary Interviews
CHAPTER NO. 3 : OIL SPILL MANAGEMENT MARKET FORCES & INDUSTRY PULSE
3.1 Foundations of Change – Market Overview
3.2 Catalysts of Expansion – Key Market Drivers
3.2.1 Momentum Boosters – Growth Triggers
3.2.2 Innovation Fuel – Disruptive Technologies
3.3 Headwinds & Crosswinds – Market Restraints
3.3.1 Regulatory Tides – Compliance Challenges
3.3.2 Economic Frictions – Inflationary Pressures
3.4 Untapped Horizons – Growth Potential & Opportunities
3.5 Strategic Navigation – Industry Frameworks
3.5.1 Market Equilibrium – Porter’s Five Forces
3.5.2 Ecosystem Dynamics – Value Chain Analysis
3.5.3 Macro Forces – PESTEL Breakdown
3.6 Price Trend Analysis
3.6.1 Regional Price Trend
3.6.2 Price Trend by product
CHAPTER NO. 4 : KEY INVESTMENT EPICENTER
4.1 Regional Goldmines – High-Growth Geographies
4.2 Technique Frontiers – Lucrative Technique Categories
4.3 Technology Sweet Spots – Emerging Demand Segments
CHAPTER NO. 5: REVENUE TRAJECTORY & WEALTH MAPPING
5.1 Momentum Metrics – Forecast & Growth Curves
5.2 Regional Revenue Footprint – Market Share Insights
5.3 Segmental Wealth Flow – Technique & Technology Revenue
CHAPTER NO. 6 : TRADE & COMMERCE ANALYSIS
6.1. Import Analysis by Region
6.1.1. Global Oil Spill Management Market Import Revenue By Region
6.2. Export Analysis by Region
6.2.1. Global Oil Spill Management Market Export Revenue By Region
CHAPTER NO. 7 : COMPETITION ANALYSIS
7.1. Company Market Share Analysis
7.1.1. Global Oil Spill Management Market: Company Market Share
7.2. Global Oil Spill Management Market Company Revenue Market Share
7.3. Strategic Developments
7.3.1. Acquisitions & Mergers
7.3.2. New Technique Launch
7.3.3. Regional Expansion
7.4. Competitive Dashboard
7.5. Company Assessment Metrics, 2024
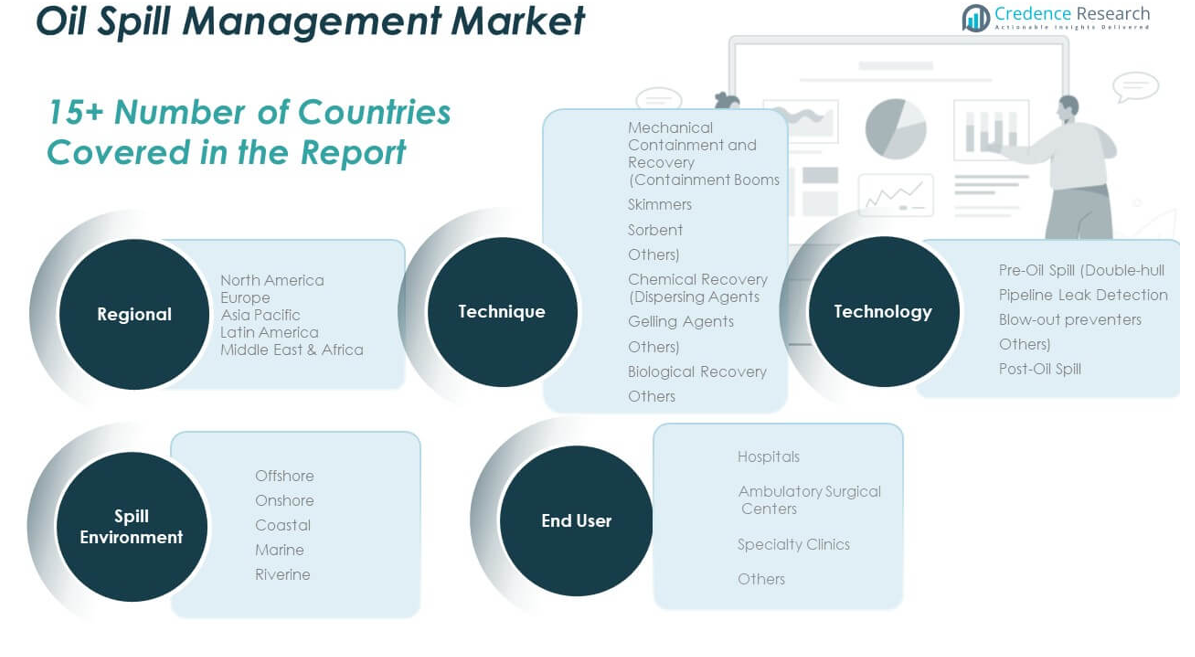
CHAPTER NO. 8 : OIL SPILL MANAGEMENT MARKET – BY TECHNIQUE SEGMENT ANALYSIS
8.1. Oil Spill Management Market Overview by Technique Segment
8.1.1. Oil Spill Management Market Revenue Share By Technique
8.2. Mechanical Containment and Recovery
8.2.1 Containment Booms
8.2.2 Skimmers
8.2.3 Sorbent
8.2.4 Others
8.3. Chemical Recovery
8.3.1 Dispersing Agents
8.3.2 Gelling Agents
8.3.3 Others
8.4. Biological Recovery
8.5. Others
CHAPTER NO. 9 : OIL SPILL MANAGEMENT MARKET – BY TECHNOLOGY SEGMENT ANALYSIS
9.1. Oil Spill Management Market Overview by Technology Segment
9.1.1. Oil Spill Management Market Revenue Share By Technology
9.2. Pre-Oil Spill
9.2.1 Double-hull
9.2.2 Pipeline Leak Detection
9.2.3 Blow-out preventers
9.2.4 Others
9.3. Post-Oil Spill
CHAPTER NO. 10 : OIL SPILL MANAGEMENT MARKET – BY END-USER SEGMENT ANALYSIS
10.1. Oil Spill Management Market Overview by End-user Segment
10.1.1. Oil Spill Management Market Revenue Share By End-user
10.2. Hospitals
10.3. Ambulatory Surgical Centers
10.4. Specialty Clinics
10.5. Others
CHAPTER NO. 11 : OIL SPILL MANAGEMENT MARKET – BY SPILL ENVIRONMENT SEGMENT ANALYSIS
11.1. Oil Spill Management Market Overview by Spill Environment Segment
11.1.1. Oil Spill Management Market Revenue Share By Spill Environment
11.2. Offshore
11.3. Onshore
11.4. Coastal
11.5. Marine
11.6. Riverine
CHAPTER NO. 12 : OIL SPILL MANAGEMENT MARKET – REGIONAL ANALYSIS
12.1. Oil Spill Management Market Overview by Region Segment
12.1.1. Global Oil Spill Management Market Revenue Share By Region
12.1.2. Regions
12.1.3. Global Oil Spill Management Market Revenue By Region
12.1.4. Technique
12.1.5. Global Oil Spill Management Market Revenue By Technique
12.1.6. Technology
12.1.7. Global Oil Spill Management Market Revenue By Technology
12.1.8. End-user
12.1.9. Global Oil Spill Management Market Revenue By End-user
12.1.10. Spill Environment
12.1.11. Global Oil Spill Management Market Revenue By Spill Environment
CHAPTER NO. 13 : NORTH AMERICA OIL SPILL MANAGEMENT MARKET – COUNTRY ANALYSIS
13.1. North America Oil Spill Management Market Overview by Country Segment
13.1.1. North America Oil Spill Management Market Revenue Share By Region
13.2. North America
13.2.1. North America Oil Spill Management Market Revenue By Country
13.2.2. Technique
13.2.3. North America Oil Spill Management Market Revenue By Technique
13.2.4. Technology
13.2.5. North America Oil Spill Management Market Revenue By Technology
13.2.6. End-user
13.2.7. North America Oil Spill Management Market Revenue By End-user
13.2.8. Spill Environment
13.2.9. North America Oil Spill Management Market Revenue By Spill Environment
13.3. U.S.
13.4. Canada
13.5. Mexico
CHAPTER NO. 14 : EUROPE OIL SPILL MANAGEMENT MARKET – COUNTRY ANALYSIS
14.1. Europe Oil Spill Management Market Overview by Country Segment
14.1.1. Europe Oil Spill Management Market Revenue Share By Region
14.2. Europe
14.2.1. Europe Oil Spill Management Market Revenue By Country
14.2.2. Technique
14.2.3. Europe Oil Spill Management Market Revenue By Technique
14.2.4. Technology
14.2.5. Europe Oil Spill Management Market Revenue By Technology
14.2.6. End-user
14.2.7. Europe Oil Spill Management Market Revenue By End-user
14.2.8. Spill Environment
14.2.9. Europe Oil Spill Management Market Revenue By Spill Environment
14.3. UK
14.4. France
14.5. Germany
14.6. Italy
14.7. Spain
14.8. Russia
14.9. Rest of Europe
CHAPTER NO. 15 : ASIA PACIFIC OIL SPILL MANAGEMENT MARKET – COUNTRY ANALYSIS
15.1. Asia Pacific Oil Spill Management Market Overview by Country Segment
15.1.1. Asia Pacific Oil Spill Management Market Revenue Share By Region
15.2. Asia Pacific
15.2.1. Asia Pacific Oil Spill Management Market Revenue By Country
15.2.2. Technique
15.2.3. Asia Pacific Oil Spill Management Market Revenue By Technique
15.2.4. Technology
15.2.5. Asia Pacific Oil Spill Management Market Revenue By Technology
15.2.6. End-user
15.2.7. Asia Pacific Oil Spill Management Market Revenue By End-user
15.2.8. Spill Environment
15.2.9. Asia Pacific Oil Spill Management Market Revenue By Spill Environment
15.3. China
15.4. Japan
15.5. South Korea
15.6. India
15.7. Australia
15.8. Southeast Asia
15.9. Rest of Asia Pacific
CHAPTER NO. 16 : LATIN AMERICA OIL SPILL MANAGEMENT MARKET – COUNTRY ANALYSIS
16.1. Latin America Oil Spill Management Market Overview by Country Segment
16.1.1. Latin America Oil Spill Management Market Revenue Share By Region
16.2. Latin America
16.2.1. Latin America Oil Spill Management Market Revenue By Country
16.2.2. Technique
16.2.3. Latin America Oil Spill Management Market Revenue By Technique
16.2.4. Technology
16.2.5. Latin America Oil Spill Management Market Revenue By Technology
16.2.6. End-user
16.2.7. Latin America Oil Spill Management Market Revenue By End-user
16.2.8. Spill Environment
16.2.9. Latin America Oil Spill Management Market Revenue By Spill Environment
16.3. Brazil
16.4. Argentina
16.5. Rest of Latin America
CHAPTER NO. 17 : MIDDLE EAST OIL SPILL MANAGEMENT MARKET – COUNTRY ANALYSIS
17.1. Middle East Oil Spill Management Market Overview by Country Segment
17.1.1. Middle East Oil Spill Management Market Revenue Share By Region
17.2. Middle East
17.2.1. Middle East Oil Spill Management Market Revenue By Country
17.2.2. Technique
17.2.3. Middle East Oil Spill Management Market Revenue By Technique
17.2.4. Technology
17.2.5. Middle East Oil Spill Management Market Revenue By Technology
17.2.6. End-user
17.2.7. Middle East Oil Spill Management Market Revenue By End-user
17.2.8. Spill Environment
17.2.9. Middle East Oil Spill Management Market Revenue By Spill Environment
17.3. GCC Countries
17.4. Israel
17.5. Turkey
17.6. Rest of Middle East
CHAPTER NO. 18 : AFRICA OIL SPILL MANAGEMENT MARKET – COUNTRY ANALYSIS
18.1. Africa Oil Spill Management Market Overview by Country Segment
18.1.1. Africa Oil Spill Management Market Revenue Share By Region
18.2. Africa
18.2.1. Africa Oil Spill Management Market Revenue By Country
18.2.2. Technique
18.2.3. Africa Oil Spill Management Market Revenue By Technique
18.2.4. Technology
18.2.5. Africa Oil Spill Management Market Revenue By Technology
18.2.6. End-user
18.2.7. Africa Oil Spill Management Market Revenue By End-user
18.2.8. Spill Environment
18.2.9. Africa Oil Spill Management Market Revenue By Spill Environment
18.3. South Africa
18.4. Egypt
18.5. Rest of Africa
CHAPTER NO. 19 : COMPANY PROFILES
19.1. Clean Harbors, Inc.
19.1.1. Company Overview
19.1.2. Technique Portfolio
19.1.3. Financial Overview
19.1.4. Recent Developments
19.1.5. Growth Strategy
19.1.6. SWOT Analysis
19.2. Oil Spill Response Limited (OSRL) (UK)
19.3. Marine Pollution Control Corporation (MPCC) (USA)
19.4. Elastec, Inc. (USA)
19.5. National Response Corporation (NRC) (USA)
19.6. Algaeby Oil Spill Management Co., Ltd. (South Korea)
19.7. Tritec Environmental Equipment Ltd. (UK)
19.8. OceanSaver AS (Norway)
19.9. Boomerang Corporation (Australia)
19.10. Praj Industries Limited (India)
19.11 Hempel A/S (Denmark)
19.12. Maritime Spill Services Limited (UK)
19.13. Oil-Dri Corporation of America (USA)
19.14. JBF Petrochemicals Limited (India)
19.15. EnerMech Group (UK)
19.16. Oil Spill Response Group (OSRG) (Singapore)
19.17. ExxonMobil Corporation (USA)
19.18. Shell Oil Company (UK)