Market Overview
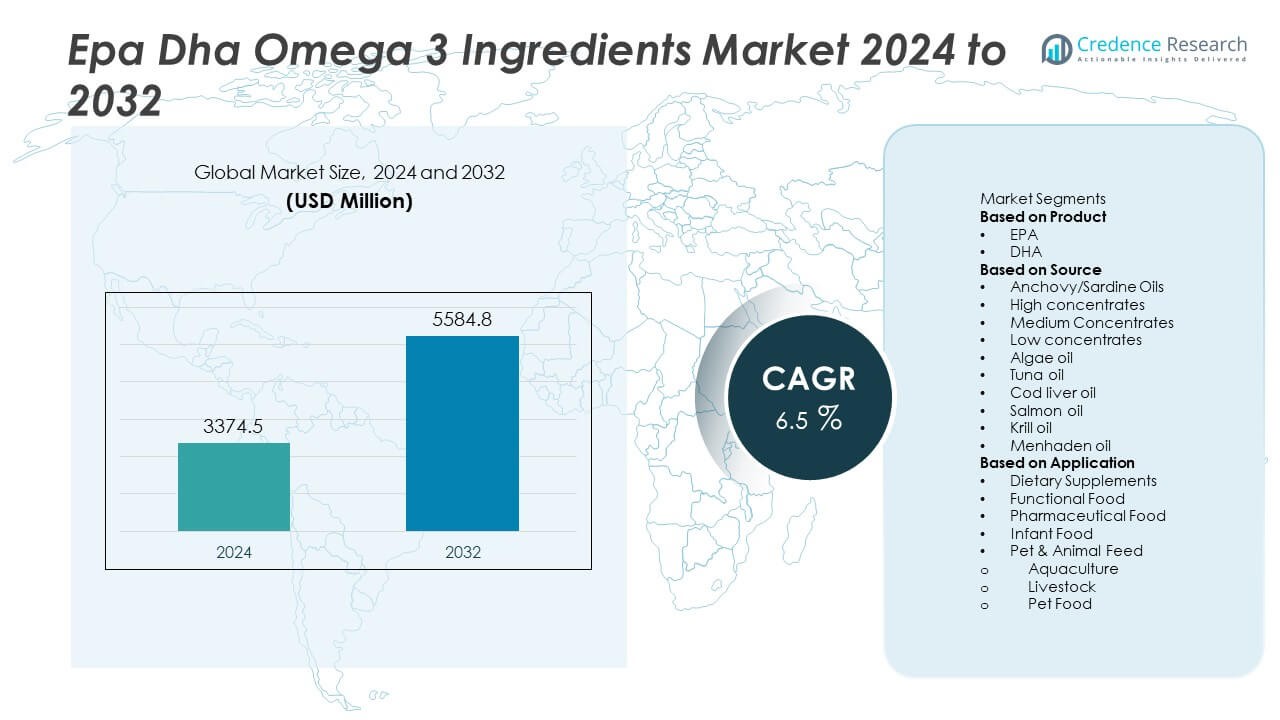
The EPA and DHA omega-3 ingredient market size was valued at USD 3,374.5 million in 2024 and is anticipated to reach USD 5,584.8 million by 2032, registering a CAGR of 6.5% during the forecast period.
| REPORT ATTRIBUTE |
DETAILS |
| Historical Period |
2020-2024 |
| Base Year |
2024 |
| Forecast Period |
2025-2032 |
| EPA and DHA Omega 3 Ingredients Market Size 2024 |
USD 3,374.5 Million |
| EPA and DHA Omega 3 Ingredients Market, CAGR |
6.5% |
| EPA and DHA Omega 3 Ingredients Market Size 2032 |
USD 5,584.8 Million |
The Epa Dha Omega 3 Ingredients Market grows driven by increasing consumer awareness of omega-3’s health benefits, including cardiovascular and cognitive support. Rising demand in dietary supplements, functional foods, and pharmaceuticals fuels market expansion. Technological advancements enhance purity, bioavailability, and stability, improving product quality. The market trends include a shift toward sustainable and plant-based omega-3 sources and integration of smart delivery systems for personalized nutrition.
The Epa Dha Omega 3 Ingredients Market demonstrates strong global presence with significant activity across North America, Europe, Asia Pacific, Latin America, and the Middle East & Africa. North America and Europe lead due to high consumer health awareness, and stringent regulatory frameworks supporting product innovation. Asia Pacific experiences rapid growth driven by rising disposable incomes, urbanization, and increasing demand for functional foods and dietary supplements. Emerging regions such as Latin America and the Middle East & Africa are expanding their market presence through growing health consciousness and improving distribution networks. Key players shaping this market include Koninklijke DSM N.V., BASF SE, Nordic Naturals Inc., and Omega Protein, all leveraging technological advancements, sustainable sourcing, and extensive global distribution to meet diverse consumer needs.
Access crucial information at unmatched prices!
Request your sample report today & start making informed decisions powered by Credence Research Inc.!
Download Sample
Market Insights
- The Epa Dha Omega 3 Ingredients Market was valued at USD 3,374.5 million in 2024 and is projected to reach USD 5,584.8 million by 2032, growing at a CAGR of 6.5% during the forecast period.
- Increasing consumer awareness about the cardiovascular and cognitive health benefits of omega-3 fatty acids drives market growth.
- Market trends include growing demand for sustainable and plant-based omega-3 sources, and advancements in bioavailability and delivery technologies.
- Key players such as Koninklijke DSM N.V., BASF SE, Nordic Naturals Inc., and Omega Protein focus on product innovation and expanding global distribution networks.
- The market faces challenges related to supply chain constraints, quality control, and regulatory complexities across different regions.
- North America and Europe lead adoption due to mature nutraceutical markets and strong regulatory frameworks promoting omega-3 supplementation.
- Asia Pacific is the fastest-growing region, supported by rising disposable incomes, urbanization, and increasing health awareness in emerging economies.
Market Drivers
Rising Consumer Awareness About Health Benefits of Omega-3 Fatty Acids
Increasing consumer understanding of the health advantages offered by EPA and DHA omega-3 ingredients drives the market growth significantly. These fatty acids are recognized for supporting cardiovascular health, brain function, and inflammatory response modulation. The Epa Dha Omega 3 Ingredients Market benefits from expanding knowledge through healthcare campaigns, nutrition labels, and physician recommendations. Growing adoption of preventive healthcare practices encourages consumers to integrate omega-3 supplements into daily routines. It caters to a wide demographic, including aging populations and health-conscious millennials. This heightened awareness translates into steady demand for high-quality, concentrated omega-3 products.
- For instance: In the United States, average adult intake of EPA is 35 mg per day, and of DHA is 76 mg per day, as measured in national dietary intake assessments.
Expanding Applications Across Dietary Supplements and Functional Foods
The broadening use of EPA and DHA omega-3 ingredients in dietary supplements and functional foods fuels market expansion. It is increasingly incorporated in capsules, gummies, fortified dairy products, beverages, and bakery items to meet diverse consumer preferences. This versatility enables manufacturers to innovate product formats that improve compliance and consumption convenience. Functional food applications address consumer demand for health-promoting products within regular diets. The market capitalizes on trends toward natural, plant-based, and clean-label formulations, enhancing product appeal. This application-driven growth supports sustained market momentum across retail and healthcare channels.
- For instance, according to the Japanese Ministry of Health, Labour and Welfare, functional food guidelines suggest that out of total omega-3 intake, at least 1,000 mg per day of combined EPA and DHA is desirable for health promotion via fortified foods.
Technological Advancements Improving Quality and Bioavailability
Innovations in extraction, purification, and encapsulation technologies enhance the safety, purity, and bioavailability of EPA and DHA omega-3 ingredients. The Epa Dha Omega 3 Ingredients Market leverages supercritical CO2 extraction and molecular distillation to reduce contaminants and improve concentration levels. Microencapsulation and emulsification techniques increase stability and absorption in the human body. These technological improvements address concerns related to fishy aftertaste, oxidation, and shelf life. Enhanced product quality strengthens consumer trust and expands applications in sensitive pharmaceutical and infant nutrition sectors. It drives manufacturers to invest in research and development to differentiate offerings.
Increasing Prevalence of Lifestyle-Related Diseases Driving Demand
The rising incidence of chronic diseases such as cardiovascular disorders, cognitive decline, and inflammatory conditions contributes to growing demand for omega-3 fatty acids. The Epa Dha Omega 3 Ingredients Market benefits from clinical evidence supporting EPA and DHA’s role in mitigating risk factors and improving patient outcomes. Healthcare providers increasingly recommend omega-3 supplementation for preventive and adjunctive therapy. It serves aging populations, patients with metabolic syndrome, and pregnant women seeking fetal brain development support. This disease-driven demand creates opportunities for expanding product portfolios tailored to specific health needs and regulatory approvals. It ensures long-term growth potential amid increasing healthcare focus on nutrition-based interventions.
Market Trends
Increasing Demand for Sustainable and Plant-Based Omega-3 Sources
The Epa Dha Omega 3 Ingredients Market is witnessing a notable shift toward sustainable and plant-based sources of omega-3 fatty acids. Consumers and manufacturers prioritize environmentally friendly alternatives such as algal oil and flaxseed-derived EPA and DHA to reduce reliance on fish-based products. It benefits from growing awareness of overfishing concerns and marine ecosystem preservation. Plant-based omega-3 options appeal to vegan and vegetarian populations, expanding the consumer base. Innovation in extraction techniques enhances the purity and concentration of these alternative sources. The trend supports product diversification and aligns with broader sustainability goals within the nutraceutical industry.
- For instance, Nu seed, a specialist in plant-based functional ingredients, announced that it would be highlighting its omega-3 ingredient at IFT FIRST from July 15–17, 2024, in Chicago. Nutriture, a canola-based nutraceutical, is the first plant-based source of ‘total’ omega-3, encompassing docosahexaenoic acid (DHA), eicosapentaenoic acid (EPA), and alpha-linolenic acid (ALA).
Rising Incorporation of Omega-3 in Personalized Nutrition and Functional Foods
Personalized nutrition gains momentum by tailoring omega-3 intake to individual health needs and genetic profiles. The Epa Dha Omega 3 Ingredients Market leverages data analytics and biomarker testing to customize formulations for cardiovascular health, cognitive function, and inflammatory conditions. It fuels development of targeted supplements and fortified functional foods designed for specific consumer segments. The integration of omega-3 ingredients in functional beverages, dairy, and snacks broadens usage occasions and consumer engagement. This trend highlights the evolving role of omega-3s from general supplements to precision health tools.
- For instance, dsm-firmenich initiated a research partnership with Wellmetrix to explore non-invasive biomarker testing through a smartphone-enabled Wellness Panel, enabling customized nutritional insights tied to omega-3 intake.
Technological Innovations Driving Enhanced Bioavailability and Stability
Technological progress continues to improve the bioavailability and oxidative stability of EPA and DHA omega-3 ingredients. The Epa Dha Omega 3 Ingredients Market benefits from encapsulation, emulsification, and microencapsulation techniques that mask unpleasant flavors and extend shelf life. Innovations in antioxidant formulations protect omega-3s from degradation during processing and storage. These advances allow broader inclusion in diverse product matrices without compromising quality. Improved stability and absorption enhance consumer experience and product efficacy. Companies are investing heavily in research to maintain competitive advantage through such innovations.
Expanding Applications in Infant Nutrition and Clinical Therapeutics
The Epa Dha Omega 3 Ingredients Market experiences growth driven by expanding use in infant formula and clinical nutrition. It supports brain development, visual acuity, and immune function in infants, making DHA enrichment a standard in formula manufacturing. Clinical applications include omega-3 supplementation for cardiovascular disease management, mental health support, and inflammatory disorder treatment. Regulatory agencies increasingly recognize the therapeutic potential of EPA and DHA, facilitating new product approvals. The market capitalizes on rising healthcare provider endorsements and consumer trust in omega-3’s health benefits. This expansion into specialized nutrition sectors reinforces long-term demand.
Market Challenges Analysis
Quality Control and Supply Chain Constraints Affecting Product Consistency
The Epa Dha Omega 3 Ingredients Market faces significant challenges related to maintaining consistent product quality amid complex supply chains. Variability in raw material sources, especially fish oil, can lead to differences in purity, potency, and sensory attributes such as odor and taste. It requires stringent quality assurance protocols and advanced purification technologies to meet regulatory and consumer expectations. Fluctuations in marine resource availability and environmental factors impact raw material supply stability. Manufacturers must invest in robust sourcing strategies and sustainable harvesting practices to ensure continuous supply. These challenges increase production costs and complicate inventory management, posing barriers for new entrants and smaller producers.
Regulatory Hurdles and Market Fragmentation Limiting Expansion
The Epa Dha Omega 3 Ingredients Market encounters regulatory complexities that vary across regions, affecting product approvals, labeling, and health claims. It must navigate differing safety standards, allowable concentration limits, and testing requirements, which delay market entry and increase compliance costs. Fragmentation of regulations creates difficulties for companies seeking global distribution. Consumer concerns regarding sustainability, contaminants, and allergenicity demand transparent and verifiable product information. This environment necessitates extensive clinical substantiation and third-party certifications to build trust. Regulatory and market fragmentation restrict rapid scaling and require continuous adaptation by manufacturers to evolving policies.
Market Opportunities
Growing Demand for Sustainable and Alternative Omega-3 Sources Expanding Market Reach
The Epa Dha Omega 3 Ingredients Market benefits from increasing interest in sustainable and plant-based omega-3 alternatives such as algal oil and microbial sources. It offers manufacturers opportunities to cater to vegan, vegetarian, and environmentally conscious consumers. Advances in extraction and purification technologies improve the concentration and bioavailability of these alternatives, enhancing their commercial viability. The shift toward sustainable sourcing aligns with global efforts to reduce overfishing and carbon footprints. Expanding product portfolios to include non-fish-derived omega-3s enables companies to differentiate offerings and capture emerging consumer segments. This trend opens new revenue streams across dietary supplements, functional foods, and pharmaceutical applications.
Expansion into Personalized Nutrition and Clinical Therapeutics Driving Innovation
Personalized nutrition presents significant growth opportunities for the Epa Dha Omega 3 Ingredients Market by tailoring omega-3 formulations to individual health profiles and genetic predispositions. It supports the development of targeted supplements aimed at cardiovascular health, cognitive function, and inflammatory conditions. Collaboration with healthcare providers and technology companies accelerates product innovation and consumer engagement. The growing emphasis on precision health encourages the integration of omega-3s into customized dietary regimens and clinical nutrition products. This focus drives demand for high-purity, clinically validated ingredients and stimulates research into novel delivery systems. The market stands to benefit from expanding awareness of omega-3’s therapeutic potential and increasing healthcare endorsements.
Market Segmentation Analysis:
By Product
The Epa Dha Omega 3 Ingredients Market segments into ethyl esters, triglycerides, and phospholipids based on product form. Ethyl esters dominate due to cost-effective production and high purity levels achieved through molecular distillation, making them suitable for dietary supplements and functional foods. Triglycerides offer higher bioavailability and are preferred in pharmaceutical and premium supplement formulations, enhancing absorption and efficacy. Phospholipids, primarily derived from krill oil, provide additional antioxidant benefits and improved cell membrane integration, appealing to specialized therapeutic applications. It benefits from ongoing advancements in refining and encapsulation technologies that improve stability, flavor masking, and shelf life across all product forms, enabling manufacturers to meet diverse consumer and regulatory requirements.
- For instance, BASF’s PronovaPure® 500:200 TG concentrate contains a minimum of 500 mg EPA and 200 mg DHA per gram, delivering high potency with clean sensory profile.
By Source
The market classifies sources into marine-based (fish oil, krill oil, algae) and plant-based origins (flaxseed, chia, perilla). Marine-based sources remain predominant due to their rich and natural EPA and DHA content, which supports higher potency products. Fish oil continues to be the most widely utilized source, with companies optimizing sustainable harvesting and purification methods to maintain quality. Krill oil gains traction for its phospholipid content and antioxidant properties. Algal oil, a direct plant-based source of EPA and DHA, is rapidly growing in popularity, especially among vegan consumers and those concerned with sustainability. Plant-based omega-3s primarily provide alpha-linolenic acid (ALA), which the body partially converts to EPA and DHA. It capitalizes on technological breakthroughs in algal cultivation and extraction to expand non-animal-based ingredient availability.
- For instance, BASF’s DHA Abgal Oil delivers minimum 380 mg DHA per gram, offering a clean, vegan-friendly alternative. Plant-based ALA sources rely on body conversion to EPA/DHA, yet efficiency varies.
By Application
Applications encompass dietary supplements, functional foods and beverages, pharmaceuticals, and infant nutrition. Dietary supplements dominate the Epa Dha Omega 3 Ingredients Market, driven by widespread consumer use for cardiovascular, cognitive, and joint health support. Functional foods and beverages incorporating EPA and DHA address the growing demand for convenient, health-enhancing daily nutrition options, including fortified dairy, bakery, and beverages. Pharmaceutical applications leverage high-purity EPA and DHA in prescription-grade products targeting specific health conditions like hypertriglyceridemia and inflammatory diseases. Infant nutrition represents a critical segment where DHA is essential for brain and eye development, prompting formula manufacturers to enrich products with precise omega-3 concentrations. It adapts formulations and delivery systems to meet regulatory standards and consumer preferences across these varied applications, ensuring broad market penetration and growth potential.
Segments:
Based on Product
Based on Source
- Anchovy/Sardine Oils
- High concentrates
- Medium Concentrates
- Low concentrates
- Algae oil
- Tuna oil
- Cod liver oil
- Salmon oil
- Krill oil
- Menhaden oil
Based on Application
- Dietary Supplements
- Functional Food
- Pharmaceutical Food
- Infant Food
- Pet & Animal Feed
- Aquaculture
- Livestock
- Pet Food
Based on the Geography:
- North America
- Europe
- UK
- France
- Germany
- Italy
- Spain
- Russia
- Belgium
- Netherlands
- Austria
- Sweden
- Poland
- Denmark
- Switzerland
- Rest of Europe
- Asia Pacific
- China
- Japan
- South Korea
- India
- Australia
- Thailand
- Indonesia
- Vietnam
- Malaysia
- Philippines
- Taiwan
- Rest of Asia Pacific
- Latin America
- Brazil
- Argentina
- Peru
- Chile
- Colombia
- Rest of Latin America
- Middle East
- UAE
- KSA
- Israel
- Turkey
- Iran
- Rest of Middle East
- Africa
- Egypt
- Nigeria
- Algeria
- Morocco
- Rest of Africa
Regional Analysis
North America
North America holds approximately 35% of the Epa Dha Omega 3 Ingredients Market, driven by high consumer awareness of health benefits associated with omega-3 fatty acids and strong presence of dietary supplement manufacturers. The United States leads regional demand, supported by extensive R&D activities and favorable regulatory frameworks encouraging product innovation. Canada contributes through growing adoption in functional foods and pharmaceuticals targeting cardiovascular and cognitive health. The market benefits from widespread distribution channels including pharmacies, health stores, and e-commerce platforms. It also gains from increasing healthcare initiatives promoting preventive nutrition and the inclusion of omega-3s in personalized health regimens. Corporate investments in sustainable sourcing and clean-label product development further enhance market growth.
Europe
Europe commands around 30% of the global Epa Dha Omega 3 Ingredients Market, propelled by stringent food safety standards and rising consumer preference for natural and sustainably sourced ingredients. Countries such as Germany, the United Kingdom, and France lead adoption due to strong demand for dietary supplements and functional foods enriched with EPA and DHA. The European Union’s regulatory policies encourage transparency and efficacy claims, supporting clinical research and product credibility. Scandinavian nations show increasing uptake owing to traditional high fish consumption and growing interest in marine-derived supplements. It benefits from well-established supply chains and a mature nutraceutical industry focused on innovation and sustainability. Continuous public health campaigns raise awareness of omega-3’s preventive health roles, further sustaining demand.
Asia Pacific
Asia Pacific accounts for approximately 25% of the Epa Dha Omega 3 Ingredients Market and is the fastest-growing regional segment. Rapid urbanization, rising disposable incomes, and increasing health consciousness in countries like China, Japan, India, and South Korea drive market expansion. The region witnesses growing integration of omega-3 ingredients in traditional and modern functional foods, dietary supplements, and infant nutrition products. Local manufacturers are scaling up production capabilities, supported by government initiatives promoting nutritional security and food fortification. It capitalizes on shifting dietary patterns toward preventive healthcare and chronic disease management. Expanding e-commerce platforms and retail networks improve product accessibility in both urban and rural markets, accelerating adoption.
Latin America
Latin America holds about 6% of the Epa Dha Omega 3 Ingredients Market, with Brazil and Mexico as key contributors. Growth is supported by rising consumer interest in health supplements and fortified foods amid increasing prevalence of lifestyle-related diseases. The market benefits from government policies encouraging nutritional interventions and public awareness programs. Local production faces challenges related to raw material sourcing, but strategic partnerships with global suppliers enhance ingredient availability. It finds opportunities in urban centers where middle-class populations drive demand for premium health products. Investment in cold-chain logistics and regulatory harmonization further support market development.
Middle East & Africa
The Middle East & Africa region accounts for roughly 4% of the global market. Demand is concentrated in the Gulf Cooperation Council (GCC) countries and South Africa, where increasing health awareness and rising disposable incomes encourage omega-3 consumption. The region faces challenges including limited local production and high import dependence. It benefits from government initiatives to diversify economies and promote wellness industries. The market shows potential in infant nutrition and pharmaceutical applications, with growing investments in healthcare infrastructure. Expanding retail channels and online sales contribute to wider product reach. The region’s focus on combating non-communicable diseases through nutrition drives future growth prospects.
Shape Your Report to Specific Countries or Regions & Enjoy 30% Off!
Key Player Analysis
- Copeinca ASA
- Croda International Plc
- Clover Corporation
- Epax Norway AS
- Omega Protein
- Arista Industries Inc
- Nordic Naturals Inc
- BASF SE
- Koninklijke DSM N.V.
- Solutex
Competitive Analysis
The competitive landscape of the Epa Dha Omega 3 Ingredients Market features both global industry leaders and specialized manufacturers competing through innovation, supply chain strength, and market diversification. Key players include BASF SE, Koninklijke DSM N.V., Nordic Naturals Inc., Clover Corporation, Omega Protein, Copeinca ASA, Solutex, Epax Norway AS, Croda International Plc, and Arista Industries Inc. BASF SE and DSM lead with extensive R&D capabilities, sustainable sourcing practices, and advanced purification technologies to ensure high-quality omega-3 concentrates. Nordic Naturals focuses on premium consumer products with superior freshness and bioavailability, while Clover Corporation specializes in microencapsulation for infant nutrition. Omega Protein and Copeinca ASA leverage large-scale fishing operations for consistent raw material supply. Solutex and Epax Norway AS excel in high-concentration EPA and DHA formulations for pharmaceuticals and nutraceuticals. Croda International Plc expands its footprint through plant-based omega-3 innovations, while Arista Industries emphasizes bulk ingredient supply to global food and supplement manufacturers. Strong distribution networks, product differentiation, and adherence to strict regulatory standards remain key competitive advantages.
Recent Developments
- In March 2025, Croda announced the opening of a cutting-edge lipids manufacturing facility in Lamar, Pennsylvania, designed to support increased production of high-purity lipid ingredients such as omega-3s.
- In November 2024, Cooke Inc. finalized its acquisition of Peru-based Copeinca ASA, one of the world’s leading fish oil producers, enhancing Cooke’s marine ingredients presence and ensuring stable supply of fish-derived omega-3 ingredients.
- In June 2024, Croda’s Incromega™ TG3322 fish oil concentrate featured in a University of Copenhagen study, demonstrating that maternal supplementation during pregnancy reduced the incidence of childhood asthma by approximately 31%
Market Concentration & Characteristics
The EPA DHA Omega 3 Ingredients Market displays a moderately concentrated structure, with a mix of global leaders and specialized producers controlling a significant share of supply. It is characterized by high entry barriers due to stringent quality regulations, complex extraction processes, and the need for advanced refining technologies to ensure purity and stability. Leading companies focus on proprietary concentration methods, molecular distillation, and novel encapsulation techniques to enhance bioavailability and shelf life. Vertical integration across fishing, processing, and formulation secures consistent raw material availability and supports cost control. The market demonstrates strong product differentiation, with variations in source type, concentration levels, and delivery formats targeting distinct application sectors such as dietary supplements, pharmaceuticals, and functional foods. Strategic collaborations with research institutions and investments in clinical validation underpin competitive positioning. Sustainability certifications and traceability systems have become defining attributes, influencing both B2B procurement decisions and end-consumer trust.
Report Coverage
The research report offers an in-depth analysis based on Product, Source, Application and Geography. It details leading market players, providing an overview of their business, product offerings, investments, revenue streams, and key applications. Additionally, the report includes insights into the competitive environment, SWOT analysis, current market trends, as well as the primary drivers and constraints. Furthermore, it discusses various factors that have driven market expansion in recent years. The report also explores market dynamics, regulatory scenarios, and technological advancements that are shaping the industry. It assesses the impact of external factors and global economic changes on market growth. Lastly, it provides strategic recommendations for new entrants and established companies to navigate the complexities of the market.
Future Outlook
- Demand will rise with increasing awareness of cardiovascular and cognitive health benefits.
- Sustainable sourcing practices will become a decisive competitive factor.
- Technological innovations will improve extraction efficiency and product purity.
- Functional foods and beverages will adopt more EPA and DHA fortification.
- Regulatory approvals will expand market penetration in emerging regions.
- Plant-based omega-3 sources will gain traction alongside marine sources.
- Clinical research will strengthen health claims and consumer trust.
- Personalized nutrition trends will boost demand for targeted omega-3 formulations.
- Strategic partnerships will enhance supply chain resilience and global reach.
- Premium, high-concentration EPA and DHA products will capture a larger market share.


