Market Overview
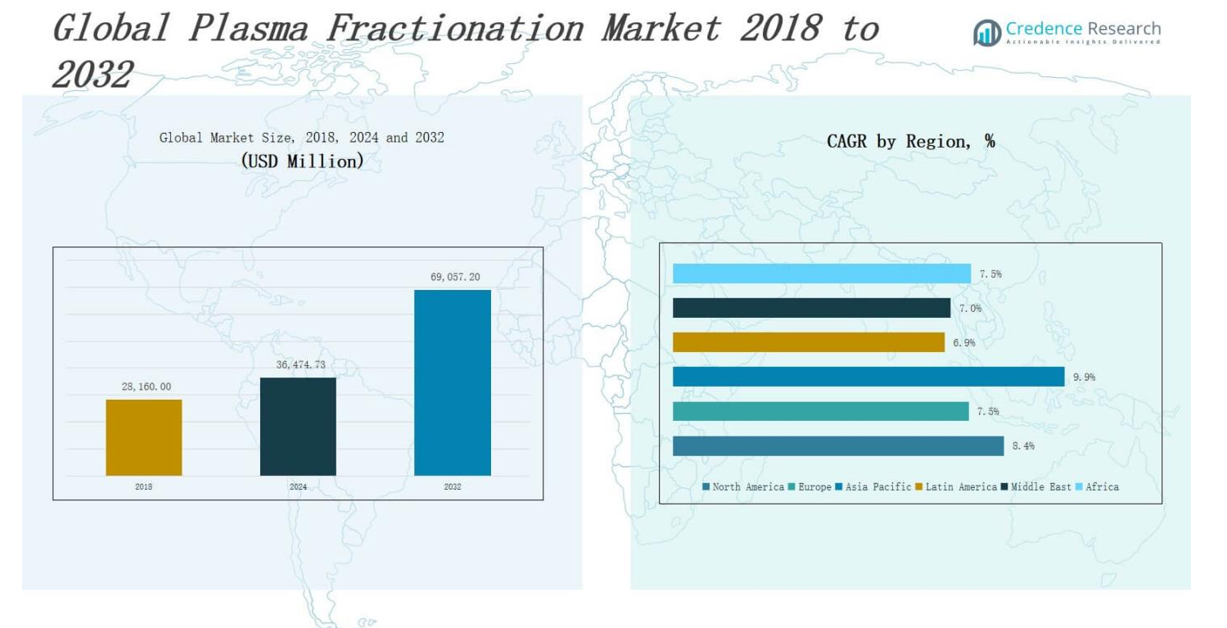
The Plasma Fractionation Market size was valued at USD 28,160.00 million in 2018 to USD 36,474.73 million in 2024 and is anticipated to reach USD 69,057.20 million by 2032, at a CAGR of 8.38% during the forecast period.
| REPORT ATTRIBUTE |
DETAILS |
| Historical Period |
2020-2023 |
| Base Year |
2024 |
| Forecast Period |
2025-2032 |
| Plasma Fractionation Market Size 2024 |
USD 36,474.73 million |
| Plasma Fractionation Market, CAGR |
8.38% |
| Plasma Fractionation Market Size 2032 |
USD 69,057.20 million |
The Plasma Fractionation Market is experiencing significant growth driven by the rising global prevalence of rare and chronic diseases such as hemophilia, primary immunodeficiency disorders, and autoimmune conditions, which require plasma-derived therapies. Increased demand for immunoglobulins, albumin, and coagulation factors, along with advancements in fractionation techniques, are enhancing the safety, yield, and efficiency of plasma processing. The aging population and expanding healthcare access in emerging economies are further fueling market expansion. Additionally, the growing awareness of plasma-based treatments and supportive regulatory frameworks are encouraging investment in plasma collection and processing infrastructure. Strategic collaborations between biotechnology firms and plasma collection centers are accelerating product innovation and regional penetration. A key trend shaping the market is the integration of automation and digital technologies to improve scalability and traceability in plasma fractionation processes. Furthermore, ongoing research into novel applications of plasma derivatives in neurology, oncology, and infectious disease treatment continues to broaden the therapeutic scope of the market.
The Plasma Fractionation Market exhibits strong global presence with significant growth across North America, Europe, Asia Pacific, Latin America, the Middle East, and Africa. North America leads the market due to its robust infrastructure and high plasma collection rates, followed by Europe with strong regulatory systems and domestic production. Asia Pacific shows the fastest growth, driven by rising healthcare investment and expanding patient populations. Latin America, the Middle East, and Africa represent emerging markets with improving healthcare access and increasing demand for plasma-derived therapies. Key players operating in the Plasma Fractionation Market include Grifols S.A., CSL Limited, Takeda Pharmaceutical Company Limited, Octapharma AG, Kedrion S.p.A, LFB S.A., Biotest AG, Sanquin, Bio Products Laboratory Ltd., and Intas Pharmaceuticals Ltd, all of which maintain global or regional dominance through product innovation, strategic partnerships, and capacity expansion.
Market Insights
- The Plasma Fractionation Market was valued at USD 28,160.00 million in 2018, reached USD 36,474.73 million in 2024, and is projected to hit USD 69,057.20 million by 2032, growing at a CAGR of 8.38%.
- Rising cases of chronic and rare diseases like hemophilia, immunodeficiency, and autoimmune disorders are driving demand for plasma-derived therapies worldwide.
- Immunoglobulins and albumin are in high demand due to their essential role in treating neurological disorders, shock, burns, and immune-related conditions.
- Technological advancements in chromatography, automation, and downstream processing are enhancing production efficiency and boosting global competitiveness.
- North America leads the market with a well-established infrastructure, while Asia Pacific is the fastest-growing region due to expanding healthcare access and investment.
- Key market players include Grifols S.A., CSL Limited, Takeda, Octapharma AG, Kedrion, LFB S.A., Biotest AG, Sanquin, BPL, and Intas Pharmaceuticals Ltd, leveraging innovation and global partnerships.
- Challenges such as stringent regulatory frameworks and limited plasma supply remain, but investments in infrastructure and donor recruitment strategies continue to support growth.
Access crucial information at unmatched prices!
Request your sample report today & start making informed decisions powered by Credence Research Inc.!
Download Sample
Market Drivers
Rising Prevalence of Chronic and Rare Disorders
The Plasma Fractionation Market is primarily driven by the increasing incidence of chronic and rare diseases such as hemophilia, primary immunodeficiency, and alpha-1 antitrypsin deficiency. These conditions require long-term treatment with plasma-derived proteins like immunoglobulins and coagulation factors. The growing burden of age-related illnesses and autoimmune diseases is expanding the patient pool. Healthcare providers are prioritizing early diagnosis and consistent treatment, further stimulating demand. It supports consistent utilization of plasma products across hospital and clinical settings. Governments and NGOs are also supporting awareness and treatment initiatives, particularly in underserved regions. The market benefits directly from improved disease surveillance and therapeutic adoption.
- For instance, CSL Behring expanded its plasma fractionation facility in Bern, Switzerland in May 2024 to address the increasing global demand for therapies treating conditions like hemophilia and primary immunodeficiency.
Growing Demand for Immunoglobulin and Albumin Therapies
The Plasma Fractionation Market is experiencing robust demand for immunoglobulin and albumin products due to their broad clinical use. Immunoglobulins are widely used in treating immunodeficiency and neurological disorders, while albumin plays a critical role in treating shock, burns, and hypoalbuminemia. Increasing global surgeries and emergency medical procedures are driving albumin consumption. Technological improvements have also optimized yield and purity in plasma product manufacturing. Hospitals and biopharmaceutical companies are scaling production to meet therapeutic needs. This surge in product demand continues to elevate plasma fractionation volumes globally.
- For instance, Companies like Grifols and CSL Behring are investing in advanced technologies, such as automation and AI, to optimize plasma fractionation processes and improve product yield and purity.
Technological Advancements in Fractionation and Processing
Technological innovation is a key enabler of growth in the Plasma Fractionation Market. Automated systems and advanced chromatography techniques are improving extraction precision and operational efficiency. These innovations reduce contamination risks and enhance yield, making plasma fractionation more cost-effective. Companies are investing in R&D to improve downstream processing and ensure higher-quality therapeutic output. It is also driving adoption among newer biotech firms with limited production capabilities. Regulatory compliance and quality assurance are becoming more manageable with modernized infrastructure. These advancements strengthen market competitiveness and global supply chain resilience.
Expansion of Plasma Collection and Processing Infrastructure
The expansion of global plasma collection networks is accelerating growth across the Plasma Fractionation Market. Increasing the number of plasma donation centers, particularly in North America and Europe, ensures steady raw material availability. Strategic partnerships between plasma collectors and biopharmaceutical manufacturers are enhancing capacity utilization. It allows companies to meet rising therapeutic demands across regions. Emerging markets are also investing in local production facilities to reduce import dependency. Government-backed incentives and regulatory alignment are encouraging infrastructure development. These factors contribute to the sustainable expansion of the global plasma therapy ecosystem.
Market Trends
Increased Adoption of Advanced Fractionation Technologies
The Plasma Fractionation Market is witnessing growing adoption of advanced technologies that improve the efficiency and quality of plasma-derived therapies. High-throughput chromatography systems, integrated automation, and single-use processing equipment are replacing traditional methods. These innovations reduce production time, improve product purity, and minimize contamination risk. Companies are leveraging these tools to scale operations and ensure regulatory compliance. It is also driving cost reductions in long-term production. The shift toward next-generation fractionation techniques supports a more agile and competitive market landscape.
- For instance, Hemobras, Brazil’s state-owned plasma fractionation company, supplied 70 blast freezers and implemented automated temperature control systems in blood centers, doubling plasma availability for fractionation from 150,000 to 300,000 liters within two years.
Rising Focus on Recombinant Alternatives and Hybrid Therapies
The growing interest in recombinant plasma protein therapies is reshaping the Plasma Fractionation Market. Recombinant factors VIII and IX are gaining traction in hemophilia treatment, offering reduced infection risk and consistent supply. Biopharmaceutical firms are investing in hybrid platforms that combine recombinant and plasma-derived solutions for enhanced efficacy. It reflects evolving therapeutic strategies aimed at improving clinical outcomes. The development of long-acting formulations is further driving innovation in this space. This trend fosters product diversification and supports a broader treatment landscape.
Expansion into Emerging Markets with Rising Healthcare Demand
The Plasma Fractionation Market is steadily expanding into emerging markets where demand for biologics is rising. Countries in Asia-Pacific, Latin America, and the Middle East are strengthening healthcare infrastructure and investing in local plasma fractionation facilities. Governments are incentivizing domestic production to reduce dependence on imports. It creates opportunities for international companies to enter new regions through joint ventures and technology transfer agreements. Growing awareness about plasma therapies is also supporting market penetration. This trend is expected to improve global treatment accessibility.
- For instance, Octapharma invested in expanding its plasma collection network in Brazil, partnering with local healthcare providers to increase plasma availability for fractionation and reduce reliance on imports.
Increased Integration of Digital and Data-Driven Solutions
Digital transformation is becoming a central trend in the Plasma Fractionation Market. Data-driven platforms are improving supply chain management, donor screening, and process monitoring across the value chain. Companies are adopting AI-powered analytics to optimize yield forecasting and quality control. It enhances traceability and compliance, which are critical in plasma-based therapies. Cloud-based systems are also streamlining regulatory reporting and inventory management. This trend reflects a broader push toward smarter, more transparent biologics manufacturing. It supports operational efficiency and long-term scalability.
Market Challenges Analysis
Complex Regulatory Landscape and High Compliance Burden
The Plasma Fractionation Market faces significant challenges due to the stringent regulatory environment governing biologics. Compliance with international quality and safety standards, including GMP and pharmacovigilance, requires continuous investment in infrastructure and skilled personnel. Regulatory delays can hinder product approvals and disrupt market entry strategies, especially in emerging economies. It also increases operational costs for companies operating across multiple regions. Adapting to evolving guidelines around donor safety, traceability, and viral inactivation protocols further adds complexity. Companies must maintain rigorous documentation and validation processes to ensure uninterrupted product distribution.
Limited Plasma Supply and High Dependency on Donor Availability
A major constraint in the Plasma Fractionation Market is the limited and uneven global supply of raw plasma. The market relies heavily on voluntary donor contributions, which fluctuate due to demographic, social, and policy-related factors. Any disruption in donor turnout or collection infrastructure can significantly impact production volumes. It creates vulnerability in meeting rising therapeutic demand, especially during global health emergencies. Export restrictions in certain countries further strain international supply chains. Companies are under pressure to improve donor recruitment, retention, and collection efficiency while managing ethical concerns and operational costs.
Market Opportunities
Expansion into Untapped Emerging Economies
The Plasma Fractionation Market holds strong growth potential in emerging economies with underdeveloped healthcare systems and limited access to plasma-derived therapies. Governments in regions such as Asia-Pacific, Latin America, and Africa are prioritizing healthcare infrastructure development and self-sufficiency in biologics production. It creates a favorable environment for global and local companies to establish fractionation facilities through joint ventures and public-private partnerships. Rising awareness of plasma-based treatments among healthcare professionals and patients supports greater market acceptance. Improved reimbursement policies and national health programs further encourage demand. This opportunity enables manufacturers to tap into large, underserved patient populations.
Innovation in Niche Therapeutic Applications
The growing research focus on plasma-derived treatments for rare and complex diseases presents a compelling opportunity for the Plasma Fractionation Market. Expanding indications for immunoglobulins, alpha-1 antitrypsin, and fibrinogen in neurology, oncology, and critical care are opening new revenue streams. It allows companies to diversify their portfolios and address high-value therapeutic areas. Advancements in long-acting formulations and personalized therapies offer additional differentiation. Collaborations with research institutions and clinical trials focused on novel uses of plasma products can accelerate development timelines. These innovations position the market for sustained expansion beyond traditional indications.
Market Segmentation Analysis:
By Product
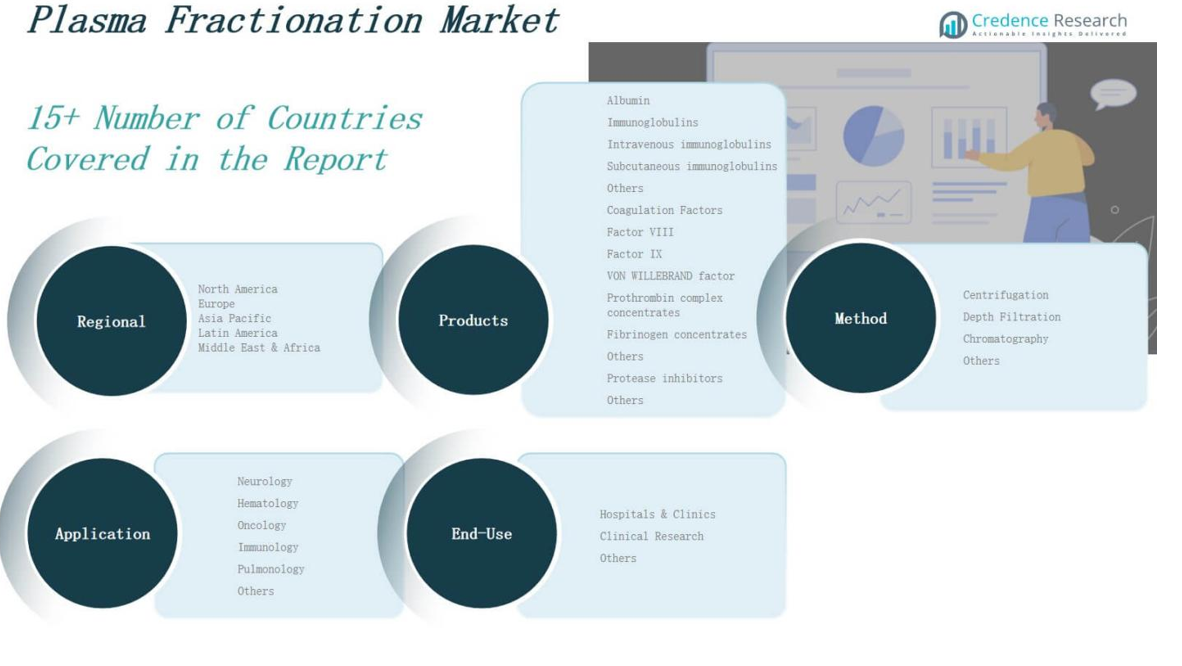
The Plasma Fractionation Market is segmented by product into albumin, immunoglobulins, coagulation factors, protease inhibitors, and others. Immunoglobulins, including intravenous (IVIG) and subcutaneous (SCIG) forms, dominate due to their extensive use in treating immune deficiencies and neurological disorders. Albumin holds a strong share for its critical role in fluid replacement therapies. Coagulation factors such as Factor VIII, Factor IX, and Von Willebrand Factor are essential in hemophilia management. It also sees growing demand for prothrombin complex concentrates and fibrinogen concentrates in emergency care. Protease inhibitors and other plasma components address niche indications.
- For instance, Intas Pharmaceuticals supplies IVIG products to over 50 countries from its high-tech plant, which is approved by the UK’s MHRA, Australia’s TGA, and Brazil’s ANVISA, ensuring compliance with stringent global regulatory standards.
By Method
The Plasma Fractionation Market includes centrifugation, depth filtration, chromatography, and others under the method segment. Chromatography is the most widely adopted due to its high purity yield and process accuracy. Depth filtration supports intermediate clarification processes in large-scale fractionation. Centrifugation continues to be used in traditional plasma separation. It benefits from low capital investment and is often used in small-scale settings. New entrants prefer integrated approaches combining multiple techniques to optimize efficiency and compliance.
- For instance, ChromaCon’s Contichrom® unit utilizes the MCSGP process to obtain high-purity Factor VIII from cryo-precipitate, resulting in at least a 50% increase in yield compared to traditional methods.
By Application
The market is segmented by application into neurology, hematology, oncology, immunology, pulmonology, and others. Neurology holds a leading position due to the high usage of immunoglobulins in treating conditions like CIDP and Guillain-Barré syndrome. Hematology follows closely with demand for coagulation factors in hemophilia treatment. Immunology benefits from broader immunoglobulin use, while oncology and pulmonology represent emerging application areas. It shows potential in expanding therapeutic indications for rare and chronic diseases.
Segments:
Based on Product
- Albumin
- Immunoglobulins
- Intravenous Immunoglobulins (IVIG)
- Subcutaneous Immunoglobulins (SCIG)
- Others
- Coagulation Factors
- Factor VIII
- Factor IX
- Von Willebrand Factor
- Prothrombin Complex Concentrates
- Fibrinogen Concentrates
- Others
- Protease Inhibitors
- Others
Based on Method
- Centrifugation
- Depth Filtration
- Chromatography
- Others
Based on Application
- Neurology
- Hematology
- Oncology
- Immunology
- Pulmonology
- Others
Based on End Use
- Hospitals & Clinics
- Clinical Research
- Others
Based on Region
- North America
- Europe
- Germany
- France
- U.K.
- Italy
- Spain
- Rest of Europe
- Asia Pacific
- China
- Japan
- India
- South Korea
- South-east Asia
- Rest of Asia Pacific
- Latin America
- Brazil
- Argentina
- Rest of Latin America
- Middle East & Africa
- GCC Countries
- South Africa
- Rest of the Middle East and Africa
Regional Analysis
North America
The North America Plasma Fractionation Market size was valued at USD 13,995.52 million in 2018 to USD 17,967.23 million in 2024 and is anticipated to reach USD 33,934.02 million by 2032, at a CAGR of 8.4% during the forecast period. North America holds the largest share in the Plasma Fractionation Market, driven by well-established healthcare infrastructure and high demand for immunoglobulins and albumin. The United States accounts for a major portion of regional revenue due to its extensive network of plasma collection centers and robust clinical usage. Strong government support, favorable reimbursement policies, and continued R&D investments contribute to regional dominance. It benefits from partnerships between biotech companies and academic research institutions. Rising incidences of chronic disorders and a growing elderly population sustain long-term growth. Technological advancements and regulatory clarity further strengthen North America’s leadership.
Europe
The Europe Plasma Fractionation Market size was valued at USD 6,223.36 million in 2018 to USD 7,687.87 million in 2024 and is anticipated to reach USD 13,587.19 million by 2032, at a CAGR of 7.5% during the forecast period. Europe remains a mature and regulated market in plasma fractionation, with a strong emphasis on safety, compliance, and domestic production. Countries such as Germany, France, and the UK lead in consumption and research. It benefits from government-funded healthcare systems that ensure broad access to plasma therapies. Local fractionation facilities reduce dependency on imports and enhance supply chain efficiency. The region’s focus on rare disease treatment expands therapeutic demand. Innovation in recombinant plasma products is also supporting market growth.
Asia Pacific
The Asia Pacific Plasma Fractionation Market size was valued at USD 5,280.00 million in 2018 to USD 7,234.61 million in 2024 and is anticipated to reach USD 15,359.07 million by 2032, at a CAGR of 9.9% during the forecast period. Asia Pacific is the fastest-growing regional segment in the Plasma Fractionation Market, fueled by rising healthcare expenditure, expanding population, and increasing awareness of plasma therapies. Countries like China, Japan, India, and South Korea are investing in local manufacturing and regulatory improvements. It is attracting global players through strategic collaborations and joint ventures. Growing prevalence of chronic conditions and improved diagnostic capabilities are expanding the patient pool. The region shows strong potential for both export and domestic consumption. Rising demand is pushing forward infrastructure development for plasma collection and processing.
Latin America
The Latin America Plasma Fractionation Market size was valued at USD 1,191.17 million in 2018 to USD 1,520.63 million in 2024 and is anticipated to reach USD 2,566.86 million by 2032, at a CAGR of 6.9% during the forecast period. Latin America is an emerging market with growing need for plasma-derived therapies, particularly in Brazil, Argentina, and Mexico. Public and private sector investments in healthcare modernization are gradually improving accessibility. It faces challenges related to supply chain logistics and regulatory alignment, but market penetration is improving. Increasing demand for immunoglobulins in neurology and hematology is boosting product adoption. Regional governments are exploring partnerships to improve local plasma collection. Clinical awareness and diagnosis rates are steadily rising, supporting future market potential.
Middle East
The Middle East Plasma Fractionation Market size was valued at USD 1,075.71 million in 2018 to USD 1,305.56 million in 2024 and is anticipated to reach USD 2,230.93 million by 2032, at a CAGR of 7.0% during the forecast period. The Middle East shows steady growth in the Plasma Fractionation Market, supported by expanding healthcare initiatives and modernization in countries such as Saudi Arabia, UAE, and Israel. It is benefiting from government-led investment in biologics infrastructure and broader insurance coverage. The increasing prevalence of genetic and immune disorders is driving therapeutic demand. Partnerships with international plasma companies are introducing advanced fractionation technologies to the region. Awareness campaigns and training programs are improving clinical adoption. Market growth is also linked to efforts in building regional self-sufficiency.
Africa
The Africa Plasma Fractionation Market size was valued at USD 394.24 million in 2018 to USD 758.82 million in 2024 and is anticipated to reach USD 1,379.14 million by 2032, at a CAGR of 7.5% during the forecast period. Africa represents a nascent but high-potential region in the Plasma Fractionation Market, with growth tied to improved healthcare access and foreign investment. South Africa, Egypt, and Nigeria are key countries moving toward better plasma collection capabilities. It faces challenges including limited infrastructure and fragmented regulatory frameworks. International aid programs and private healthcare providers are expanding access to plasma-derived products. Efforts are underway to strengthen diagnostics and treatment availability. With rising disease awareness and investment in healthcare, the region is poised for long-term development.
Shape Your Report to Specific Countries or Regions & Enjoy 30% Off!
Key Player Analysis
- Grifols S.A.
- CSL Limited
- Takeda Pharmaceutical Company Limited
- Octapharma AG
- Kedrion S.p.A
- LFB S.A.
- Biotest AG
- Sanquin
- Bio Products Laboratory Ltd. (BPL)
- Intas Pharmaceuticals Ltd
Competitive Analysis
The Plasma Fractionation Market is highly competitive, dominated by a few global players with extensive manufacturing capabilities and strong distribution networks. Key companies such as Grifols S.A., CSL Limited, Takeda Pharmaceutical Company, and Octapharma AG maintain leadership through continuous investments in R&D, innovation in plasma-derived therapies, and geographic expansion. It features a high entry barrier due to strict regulatory requirements, capital-intensive infrastructure, and long product development cycles. Market participants focus on strategic alliances, acquisitions, and technological upgrades to enhance their product portfolios and global reach. Regional players are also gaining ground by establishing local collection centers and partnering with government health agencies. The market’s competitive landscape is influenced by price sensitivity, product differentiation, and the ability to ensure uninterrupted plasma supply. Companies that prioritize operational efficiency, donor recruitment, and compliance gain a distinct advantage in maintaining long-term market presence and profitability.
Recent Developments
- In June 2023, GC Biopharma received regulatory approval and began construction on Indonesia’s first plasma fractionation plant, with plans for operation by 2027.
- In April 2024, Takeda announced a US $230 million investment to expand its plasma-derived therapies facility in Los Angeles, aiming to add capacity for 2 million liters per year.
- In 2025, Grifols S.A. launched a digitized plasma supply chain management system, which reduced operational costs by 15%.
- In February 2025, Octapharma AG expanded its Vienna manufacturing site, boosting production capacity by 50% and enhancing packaging and logistics infrastructure for global distribution.
Market Concentration & Characteristics
The Plasma Fractionation Market is moderately consolidated, with a few dominant players holding a significant share of global revenue. It is characterized by high entry barriers due to stringent regulatory requirements, capital-intensive infrastructure, and the complexity of biologics manufacturing. Companies such as Grifols S.A., CSL Limited, Takeda, and Octapharma AG lead through vertical integration, strong global distribution networks, and continuous investment in research and development. The market operates under tight quality controls and GMP compliance, which reinforces trust and long-term contracts with healthcare providers. It exhibits low product substitution due to the critical nature of plasma-derived therapies in managing life-threatening and chronic conditions. The supply chain depends heavily on voluntary plasma donations, creating regional dependencies and logistical challenges. Innovation in recombinant products and digital transformation in manufacturing are reshaping competitive dynamics. The market continues to evolve with expansion into emerging economies and broader application of plasma therapies across multiple disease categories.
Report Coverage
The research report offers an in-depth analysis based on Product, Method, Application, End-Use and Region. It details leading market players, providing an overview of their business, product offerings, investments, revenue streams, and key applications. Additionally, the report includes insights into the competitive environment, SWOT analysis, current market trends, as well as the primary drivers and constraints. Furthermore, it discusses various factors that have driven market expansion in recent years. The report also explores market dynamics, regulatory scenarios, and technological advancements that are shaping the industry. It assesses the impact of external factors and global economic changes on market growth. Lastly, it provides strategic recommendations for new entrants and established companies to navigate the complexities of the market.
Future Outlook
- Demand for plasma-derived therapies will increase due to rising cases of immunodeficiency, autoimmune diseases, and bleeding disorders.
- Innovation in recombinant alternatives and hybrid plasma therapies will diversify treatment options.
- Expansion of plasma collection infrastructure will improve raw material availability and supply chain stability.
- Regulatory alignment across emerging markets will support faster product approvals and market entry.
- Technological advancements in chromatography and purification will enhance processing efficiency.
- Automation and digital tools will streamline manufacturing, compliance, and traceability.
- Strategic collaborations between biopharmaceutical companies and plasma centers will boost capacity and reach.
- Investment in R&D will focus on novel indications in neurology, oncology, and critical care.
- Growing awareness and diagnosis of rare diseases will support consistent clinical demand.
- Entry of regional players with local manufacturing facilities will intensify competition and improve accessibility.


