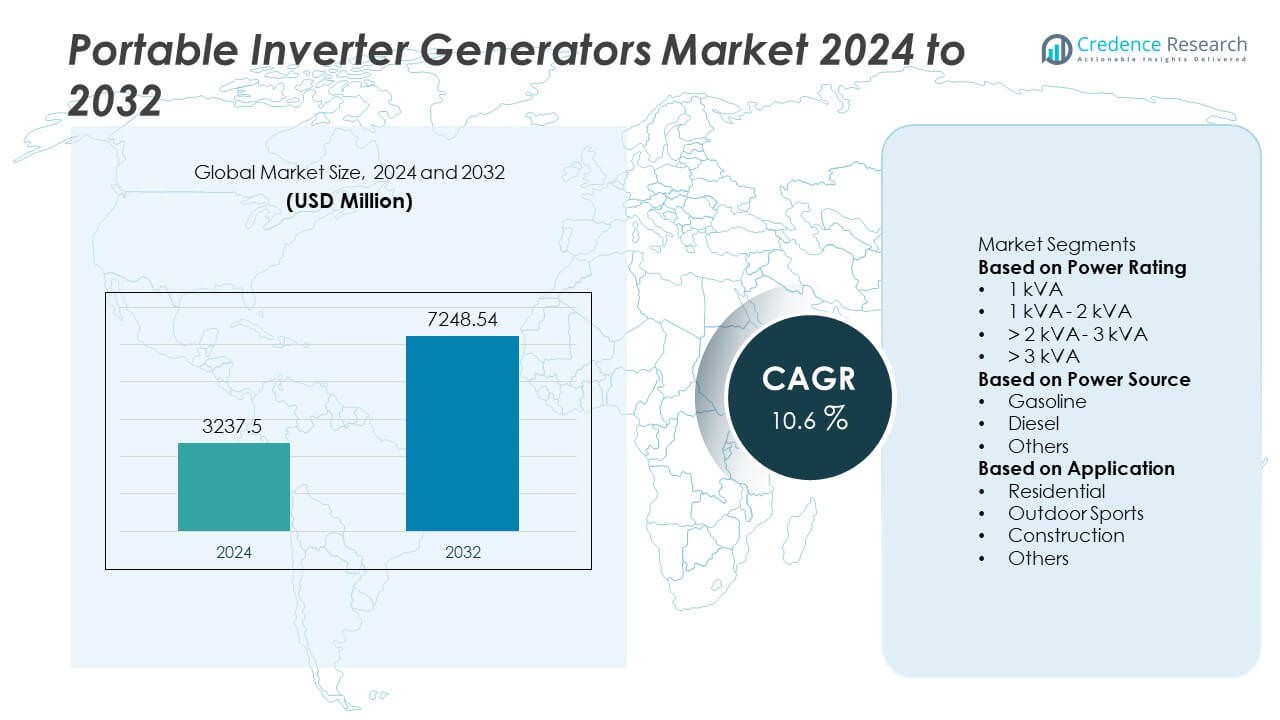
Home » Energy » Portable Inverter Generators Market

Portable Inverter Generators Market By Power Rating (1kVA, 1kVA to 2kVA, >2kVA to 3kVA, >3kVA to 4kVA, >4kVA) By Power Source (Gasoline, Diesel) By Application (Residential, Outdoor Sports, Construction)-Growth, Future Prospects & Competitive Analysis, 2016 – 2030

Price: $4999

Published: | Report ID: 18630 | Report Format : PDF

Key Highlights of the Report

The global portable inverter generators market is segmented by power rating, power source, application, and region. 1kVA to 2kVA-based portable inverter generators category is the most popular, while gasoline is the primary power source segment. The construction category is the most common application, with North America leading the market growth.

The market for portable inverter generators is expected to expand significantly over the forecast period because of their low cost and adaptable functionality, making them ideal for a range of user requirements. These items have evolved from merely extra power sources to becoming necessities for various applications. The widespread use of these devices for residential, light-duty business, construction sites, and recreational purposes will hasten the market expansion for portable inverter generators.

Nonetheless, the North American market for portable inverter generators is predicted to grow at the greatest CAGR. Decreasing grid infrastructure and the growing need for consistent and dependable power will influence corporate growth favorably. The adoption of these solutions will be further fueled by the rise in frequency and severity of weather-related disasters that result in protracted outages.

Market Overview

The global portable inverter generators market has witnessed steady growth in recent years and is expected to continue growing at a CAGR of 6.50% between 2023 and 2030. The market was valued at USD 2.2 billion in 2022 and is expected to reach USD 3.4 billion in 2030.

Design Element 2

Access crucial information at unmatched prices!

Request your free sample report today & start making informed decisions powered by Credence Research!

Download Free Sample
CTA Design Element 3

What Are The Main Drivers Of The Global Portable Inverter Generators Market?

In response to the increasingly frequent and severe electrical outages, market growth is ascribed to the increased importance of backup power and disaster planning measures. These units are expanding as a result of rising power outages, intensifying natural disasters, and declining grid resilience.

What Are The Major Challenges Faced By The Global Portable Inverter Generators Market?

Compared to conventional generators, portable inverter generators are more efficient and standard. Pricey portable inverter generators decreased consumer demand. As opposed to conventional generators, portable inverter generators offer less power.

What Are The Growth Opportunities In The Global Portable Inverter Generators Market?

The increasing population increase and poor grid infrastructure will encourage portable inverter generators. The business’s potential will be shaped by rising consumer spending confidence and rising disposable incomes.

Executive Summary

Overview of the Global Portable Inverter Generators Market

In underdeveloped nations, there is an explosive growth in the demand for continuous electricity supply. India experiences a 30,000 MW daily power loss, according to the International Journal of Advancements in Research & Technology. Additionally, every year the nation is short 80,000 million units of electricity. This pattern will probably persist in the following years, increasing demand for portable inverter generators. Furthermore, it is projected that the expansion would be accelerated by key companies’ increased development of high-performance, fuel-efficient, and surge-sensitive portable inverter generators.

Market Definition

A portable inverter generator automatically adjusts engine speed to the current electrical demand rather than running at a constant pace independent of the load. Additionally, the CO safety shutdown in these systems increases security and dependability. These devices work under the assumption that when engine speed changes, so does the frequency of the generated alternating current (AC). The key advantage of these generators is that they may be moved as needed and don’t need to be installed permanently. It is typically used to provide electricity during blackouts or when electricity is temporarily required when camping or participating in other recreational activities. It can be manually started.

Portable Inverter Generators Market

Market Insights

  • The global demand for portable inverter generators was valued at USD 2.2 Billion in 2022 and is expected to reach USD 3.4 Billion in 2030, growing at a CAGR of 6.50% between 2023 and 2030.
  • 1kVA to 2kVA category is the market leader in value and held over 35% of the market in 2022 and the >4kVA category is anticipated to grow fastest.
  • The gasoline category will continue to rule the market for portable inverter generators globally, with estimates of high CAGR growth and a huge market share of over 60% in 2022.
  • The construction category is anticipated to account for over 49% of the market in 2022, whereas the residential category is anticipated to expand at the highest CAGR over the forecast period.
  • North America will make up almost one-third of the market for portable inverter generators in 2022, while Asia Pacific and Europe will make up around 40% of the total market.
  • Due to frequent and severe electricity outages, market expansion is attributed to the increased significance of backup power and disaster preparation procedures. Due to the increase in power outages, the severity of natural disasters, and the deteriorating grid resilience, these units are growing.
  • The North America portable inverter generators industry is predicted to expand faster. The deteriorating grid infrastructure and the rising need for reliable and consistent power will positively impact growth in the business sector.

Segmentation by Power Rating

  • In 2022, the 1kVA to 2kVA category held the top spot by power rating, with over 35% of the portable inverter generators market share.
  • Over the forecast period, it is predicted that the >4kVA segment will be the fastest-growing.

Segmentation by Power Source

  • With a market share of over 60% in 2022, the gasoline category dominated the global portable inverter generators market.
  • Whereas diesel is anticipated to be the fastest-growing category in the portable inverter generator market.

Segmentation by Application

  • The construction segment led the market with a market share of over 49% in 2022.
  • Over the projection period, the residential category is anticipated to register the highest CAGR.

Segmentation by Region

  • A 42% share was held by North America in 2022.
  • In 2022 Europe will occupy more than 27% of the market, with Asia Pacific accounting for just under 31% of the total.
  • The rest of the world’s demand for portable inverter generators comes from Latin America, the Middle East, and Africa.

Due to power outages, consumers demand more dependable power as an electricity backup. The power inverter generators give homes, businesses, and outdoor activities a dependable power source. This is expected to fuel market expansion. Additionally, by implementing cutting-edge technology, the makers create portable inverter generators that are strong and effective. The market is growing because these modern generators are quieter, more fuel-efficient, and emit fewer greenhouse gases.

North America dominated the global portable inverter generators market. The presence of major international manufacturers in the US, including Honda, Generac, Briggs and Stratton, etc., is fostering cutting-edge technological developments and product innovations that are increasing demand. Construction, automotive, and other mature industries in the US are just a few examples of where portable inverter generators are used. The United States is the most demanding nation in the global market for portable inverter generators due to higher affordability levels and purchasing power among customers there.

The market for portable inverter generators in Asia Pacific is anticipated to grow at the highest CAGR. Leading firms in the worldwide portable inverter generator industry have their corporate headquarters in Japan, giving the country a competitive advantage in the market. The region’s manufacturers are implementing the most recent innovations to create portable inverter generators that are surge-sensitive, fuel-efficient, and perform better. The portable inverter generator market in Japan is anticipated to rise steadily thanks to the country’s recovering end-user industries, including the building and automotive sectors.

Overall, the low cost and adjustable functionality of portable inverter generators, which make them suited for a range of user requirements, will likely drive the market for these devices to grow significantly throughout the forecast period. From being essentially extra power sources, these gadgets have developed into a necessity for various applications. The market growth for portable inverter generators will be accelerated by the increased use of these tools for domestic, light-duty commercial, construction site, and recreational reasons.

Portable inverter generators are more efficient and common than traditional generators. Their high cost lowered the demand for portable inverter generators. Portable inverter generators provide less power than traditional generators.

Increasing Demand For Continuous Power Supply

Electricity is essential for a country’s economic development, yet many nations lack the necessary grid infrastructure. Small and medium-sized businesses (SMEs) and commercial spaces (spaces) operations are significantly hampered by inadequate power supply. Portable inverter generators guarantee a steady electrical supply during a blackout and contribute to expanding the portable inverter generators market. In 2018, the UN estimated that about 55% of people on Earth lived in urban areas; by 2050, that number is expected to rise to 68%. The power demand is rising due to a significant population movement to metro areas.

Furthermore, a lot of development work is being done to build office buildings, business parks, and housing societies, which would increase the need for electricity. Because of these variables, there is a gap between the amount of energy produced and the amount needed, which finally creates profitable prospects for expanding the market for portable inverter generators.

Governmental And International Efforts To Increase Access To Electricity

Frequent power outages and insufficient electricity supplies are important concerns for developing nations. The market’s potential may be constrained by local governments’ growing desire to build out the grid infrastructure to fulfill end-user demand. The market’s expansion is also expected to be constrained by escalating worries about greenhouse gas emissions and changing tendencies towards clean energy technology.

Detailed Government Regulations For Diesel Engine Emission

A wide range of residential, commercial, and industrial applications call for using portable generators. Particulate matter, carbon monoxide, and nitrogen oxides are released when diesel is burned in a generator. These emissions harm the environment and the local population because they are directly emitted into the atmosphere. Globally, several laws have been put into place to limit the noise and air pollution caused by generator sets. Because of rising environmental concerns, every nation has developed its own rules and policies to reduce air pollution.

Insufficient Grid Infrastructure In Developing  Economies

Due to a lack of grid infrastructure, millions of people worldwide do not have access to power. Due to rapid population expansion, increased energy demand, and inadequate energy infrastructure, emerging nations are most affected. The market outlook for portable generators has improved as more housing societies, flats, businesses, and SMEs choose portable generators for a dependable power supply. Additionally, when natural disasters like earthquakes, floods, tsunamis, bushfires, storms, hurricanes, and volcanic eruptions occur, there is an increased need for portable generators. Natural disasters frequently disrupt the infrastructure of the national grid in several parts of the world, which results in erratic electrical delivery. Portable inverter generators are frequently utilized to supply electricity for rescue operations in such situations.

Competitive Landscape

Key Players

The global portable inverter generators market is highly competitive, with the presence of several key players. Some of the major players in the market and their market share are as follows:

  • Honda Power Equipment WEN Products
  • Firman Power Equipment
  • Briggs & Stratton
  • Ryovi
  • Duromax Power Equipment
  • Champion Power Equipment
  • WEN Products
  • Generac Power Systems
  • Westinghouse Electric Company
  • Yamaha Motor Co.

These businesses prioritise product innovation, enlarging their distribution networks, and mergers and acquisitions to stay competitive in the market. The key players in the worldwide portable inverter generators market are continually launching new products and developments to stay ahead.

In May 2022, Tangent Energy, a provider of energy solutions with U.S. headquarters, was purchased by Caterpillar. To offer clients value, the company provides smart energy solutions. By enhancing customer service for dependable, efficient, sustainable, and connected power solutions that support corporate operations while creating new revenue streams, Tangent’s EaaS products complement the company’s electric power product range.

In November 2021, an innovative company called Oxy Neuron India Pvt. Ltd., housed in SIIC, IIT Kanpur, unveiled its revolutionary “Magic Box” wall-mounted Smart Lithium portable inverter. Tesla India, a well-known producer of electric vehicles, is its first client. The innovative inverter is 94% more efficient than currently available transformer-based inverters. The gadget is IoT-compatible and can also be operated by a smartphone.

In January 2021, Cummins Inc. increased its gasoline & liquid propane genset line to serve the recreational vehicle industry by introducing the Onan QG 2800i & 2500i. Compared to comparable options, these units make 62.7% less noise and 60.6% less vibration. The inverter-based devices, which have an output of 2.8 kW and 2.5 kW, respectively, and are more commonly employed by Class B vans and truck campers, are simpler to use and maintain.

Shape Your Report to Specific Countries or Regions & Enjoy 30% Off!

Summary of Key Findings

  • Customers want more reliable power as a backup source of electricity as a result of power disruptions. Homes, businesses, and outdoor activities benefit from the stable power sources of power inverter generators. We anticipate that this will encourage market growth.
  • Market segmented by power rating, power source, application, and region.
  • 1kVA to 2kVA category is the most popular, with gasoline as the primary power source.
  • The construction segment is the most commonly used application of the portable inverter generator market.
  • North America is leading market growth; the market is highly competitive with key players including Honda Power Equipment WEN Products, Firman Power Equipment, Briggs & Stratton, Ryovi, Duromax Power Equipment. Champion Power Equipment, WEN Products, Generac Power Systems, Westinghouse Electric Company and Yamaha Motor Co.

Future Outlook

  • The global market for portable inverter generators is expected to increase significantly, especially in the North American region.
  • The market for portable inverter generators is anticipated to expand rapidly throughout the forecast period due to the low price and adaptable functionality of these devices, making them suitable for various user requirements.
  • Over standard generators, portable inverter generators are more popular and efficient. Their high price reduced the demand for portable inverter generators. Comparatively speaking, portable inverter generators are less powerful. Thus, this is anticipated to limit the growth of the market.
  • To be competitive in the market, major companies should focus on creating novel items, expanding their market, and maintaining cheap prices.

Segmentation

  • By By Power Rating
    • 1kVA
    • 1kVA to 2kVA
    • >2kVA to 3kVA
    • >3kVA to 4kVA
    • >4kVA
  • By Power Source
    • Gasoline
    • Diesel
  • By Application
    • Residential
    • Outdoor Sports
    • Construction
  • By Region
  • North America
    • U.S
    • Canada
    • Mexico
  • Europe
    • Germany
    • France
    • U.K.
    • Italy
    • Spain
    • Rest of Europe
  • Asia Pacific
    • China
    • Japan
    • India
    • South Korea
    • South-east Asia
    • Rest of Asia Pacific
  • Latin America
    • Brazil
    • Argentina
    • Rest of Latin America
  • Middle East & Africa
    • GCC Countries
    • South Africa
    • Rest of Middle East and Africa

1. Preface
1.1. Report Description
1.1.1. Purpose of the Report
1.1.2. Target Audience
1.1.3. USP and Key Offerings
1.2. Research Scope
1.3. Research Methodology
1.3.1. Phase I – Secondary Research
1.3.2. Phase II – Data Modelling
1.3.2.1. Company Share Analysis Model
1.3.2.2. Revenue Based Modelling
1.3.3. Phase III – Primary Research
1.3.4. Research Limitations
1.3.5. Assumptions
1.4. Market Introduction
1.5. Market Research Scope

2. Executive Summary
2.1. Market Snapshot: Global Portable Inverter Generators Market
2.2. Global Portable Inverter Generators Market, By Power Rating
2.3. Global Portable Inverter Generators Market, By Power Source
2.4. Global Portable Inverter Generators Market, By Application
2.5. Global Portable Inverter Generators Market, By Region

3. Market Dynamics & Factors Analysis
3.1. Introduction
3.1.1. Global Portable Inverter Generators Market Value, 2017-2030, (US$ Bn)
3.1.2. Y-o-Y Growth Trend Analysis
3.2. Market Dynamics
3.2.1. Market Drivers
3.2.2. Market Restraints
3.2.3. Market Opportunities
3.2.4. Major Industry Challenges
3.3. Growth and Development Patterns
3.4. Investment Feasibility Analysis
3.5. Market Opportunity Analysis
3.5.1. Power Rating
3.5.2. Power Source
3.5.3. Application
3.5.4. Geography

4. Premium Insights
4.1. STAR (Situation, Task, Action, Results) Analysis
4.2. Porter’s Five Forces Analysis
4.2.1. Threat of New Entrants
4.2.2. Bargaining Power of Buyers/Consumers
4.2.3. Bargaining Power of Suppliers
4.2.4. Threat of Substitute Types
4.2.5. Intensity of Competitive Rivalry
4.3. Key Market Trends
4.3.1. Demand Side Trends
4.3.2. Supply Side Trends
4.4. Value Chain Analysis
4.5. Technology Analysis
4.6. Analysis and Recommendations
4.7. Marketing Strategy Analysis
4.7.1. Direct Marketing
4.7.2. Indirect Marketing
4.7.3. Marketing Channel Development Trend

5. Market Positioning of Key Players, 2022
5.1. Company market share of key players, 2022
5.2. Competitive Benchmarking
5.3. Market Positioning of Key Vendors
5.4. Geographical Presence Analysis
5.5. Major Strategies Adopted by Key Players
5.5.1. Key Strategies Analysis
5.5.2. Mergers and Acquisitions
5.5.3. Partnerships
5.5.4. Product Launch
5.5.5. Geographical Expansion
5.5.6. Others

6. Economic Impact Analysis
6.1. Recession Impact
6.1.1. North America
6.1.2. Europe
6.1.3. Asia Pacific
6.1.4. Latin America
6.1.5. Middle East and Africa
6.2. Ukraine-Russia War Impact
6.2.1. North America
6.2.2. Europe
6.2.3. Asia Pacific
6.2.4. Latin America
6.2.5. Middle East and Africa
6.3. COVID-19 Impact Analysis
6.3.1. North America
6.3.2. Europe
6.3.3. Asia Pacific
6.3.4. Latin America
6.3.5. Middle East and Africa

7. Global Portable Inverter Generators Market, By Power Rating
7.1. Global Portable Inverter Generators Market Overview, by Power Rating
7.1.1. Global Portable Inverter Generators Market Revenue Share, By Power Rating, 2022 Vs 2030 (in %)
7.2. 1kVA
7.2.1. Global Portable Inverter Generators Market, By Region, 2017-2030 (US$ Bn)
7.3. 1kVA to 2kVA
7.3.1. Global Portable Inverter Generators Market, By Region, 2017-2030 (US$ Bn)
7.4. >2kVA to 3kVA
7.4.1. Global Portable Inverter Generators Market, By Region, 2017-2030 (US$ Bn)
7.5. >3kVA to 4kVA
7.5.1. Global Portable Inverter Generators Market, By Region, 2017-2030 (US$ Bn)
7.6. >4kVA
7.6.1. Global Portable Inverter Generators Market, By Region, 2017-2030 (US$ Bn)

8. Global Portable Inverter Generators Market, By Power Source
8.1. Global Portable Inverter Generators Market Overview, by Power Source
8.1.1. Global Portable Inverter Generators Market, By Power Source, 2022 vs 2030 (in %)
8.2. Gasoline
8.2.1. Global Portable Inverter Generators Market, By Region, 2017-2030 (US$ Bn)
8.3. Diesel
8.3.1. Global Portable Inverter Generators Market, By Region, 2017-2030 (US$ Bn)

9. Global Portable Inverter Generators Market, by Application, 2017-2030 (US$ Bn)
9.1. Global Portable Inverter Generators Market Overview, by Application
9.1.1. Global Portable Inverter Generators Market, By Application, 2022 vs 2030 (in%)
9.2. Residential
9.2.1. Global Portable Inverter Generators Market, By Region, 2017-2030 (US$ Bn)
9.3. Outdoor Sports
9.3.1. Global Portable Inverter Generators Market, By Region, 2017-2030 (US$ Bn)
9.4. Construction
9.4.1. Global Portable Inverter Generators Market, By Region, 2017-2030 (US$ Bn)

10. Global Portable Inverter Generators Market, By Region
10.1. Global Portable Inverter Generators Market Overview, by Region
10.1.1. Global Portable Inverter Generators Market, By Region, 2022 vs 2030 (in%)
10.2. Power Rating
10.2.1. Global Portable Inverter Generators Market, By Power Rating, 2017-2030 (US$ Bn)
10.3. Power Source
10.3.1. Global Portable Inverter Generators Market, By Power Source, 2017-2030 (US$ Bn)
10.4. Application
10.4.1. Global Portable Inverter Generators Market, By Application, 2017-2030 (US$ Bn)

11. North America Portable Inverter Generators Market Analysis
11.1. North America Portable Inverter Generators Market, by Power Rating, 2017-2030(US$ Bn)
11.1.1. Overview
11.1.2. SRC Analysis
11.2. North America Portable Inverter Generators Market, by Power Source, 2017-2030(US$ Bn)
11.2.1. Overview
11.2.2. SRC Analysis
11.3. North America Portable Inverter Generators Market, by Application, 2017-2030(US$ Bn)
11.3.1. Overview
11.3.2. SRC Analysis
11.4. North America Portable Inverter Generators Market, by Country, 2017-2030 (US$ Bn)
11.4.1. North America Portable Inverter Generators Market, by Country, 2022 Vs 2030 (in%)
11.4.2. U.S.
11.4.2.1. U.S. Portable Inverter Generators Market Estimates and Forecast, 2017-2030 (US$ Bn)
11.4.2.2. U.S. Portable Inverter Generators, By Power Rating, 2017-2030 (US$ Bn)
11.4.2.3. U.S. Portable Inverter Generators, By Power Source, 2017-2030 (US$ Bn)
11.4.2.4. U.S. Portable Inverter Generators, By Application, 2017-2030 (US$ Bn)
11.4.3. Canada
11.4.3.1. Canada Portable Inverter Generators Market Estimates and Forecast, 2017-2030 (US$ Bn)
11.4.3.2. Canada Portable Inverter Generators, By Power Rating, 2017-2030 (US$ Bn)
11.4.3.3. Canada Portable Inverter Generators, By Power Source, 2017-2030 (US$ Bn)
11.4.3.4. Canada Portable Inverter Generators, By Application, 2017-2030 (US$ Bn)
11.4.4. Mexico
11.4.4.1. Mexico Portable Inverter Generators Market Estimates and Forecast, 2017-2030 (US$ Bn)
11.4.4.2. Mexico Portable Inverter Generators, By Power Rating, 2017-2030 (US$ Bn)
11.4.4.3. Mexico Portable Inverter Generators, By Power Source, 2017-2030 (US$ Bn)
11.4.4.4. Mexico Portable Inverter Generators, By Application, 2017-2030 (US$ Bn)

12. Europe Portable Inverter Generators Market Analysis
12.1. Europe Portable Inverter Generators Market, by Power Rating, 2017-2030(US$ Bn)
12.1.1. Overview
12.1.2. SRC Analysis
12.2. Europe Portable Inverter Generators Market, by Power Source, 2017-2030(US$ Bn)
12.2.1. Overview
12.2.2. SRC Analysis
12.3. Europe Portable Inverter Generators Market, by Application, 2017-2030(US$ Bn)
12.3.1. Overview
12.3.2. SRC Analysis
12.4. Europe Portable Inverter Generators Market, by Country, 2017-2030 (US$ Bn)
12.4.1. Europe Portable Inverter Generators Market, by Country, 2022 Vs 2030 (in%)
12.4.2. Germany
12.4.2.1. Germany Portable Inverter Generators Market Estimates and Forecast, 2017-2030 (US$ Bn)
12.4.2.2. Germany Portable Inverter Generators, By Power Rating, 2017-2030 (US$ Bn)
12.4.2.3. Germany Portable Inverter Generators, By Power Source, 2017-2030 (US$ Bn)
12.4.2.4. Germany Portable Inverter Generators, By Application, 2017-2030 (US$ Bn)
12.4.3. France
12.4.3.1. France Portable Inverter Generators Market Estimates and Forecast, 2017-2030 (US$ Bn)
12.4.3.2. France Portable Inverter Generators, By Power Rating, 2017-2030 (US$ Bn)
12.4.3.3. France Portable Inverter Generators, By Power Source, 2017-2030 (US$ Bn)
12.4.3.4. France Portable Inverter Generators, By Application, 2017-2030 (US$ Bn)
12.4.4. UK
12.4.4.1. UK Portable Inverter Generators Market Estimates and Forecast, 2017-2030 (US$ Bn)
12.4.4.2. UK Portable Inverter Generators, By Power Rating, 2017-2030 (US$ Bn)
12.4.4.3. UK Portable Inverter Generators, By Power Source, 2017-2030 (US$ Bn)
12.4.4.4. UK Portable Inverter Generators, By Application, 2017-2030 (US$ Bn)
12.4.5. Italy
12.4.5.1. Italy Portable Inverter Generators Market Estimates and Forecast, 2017-2030 (US$ Bn)
12.4.5.2. Italy Portable Inverter Generators, By Power Rating, 2017-2030 (US$ Bn)
12.4.5.3. Italy Portable Inverter Generators, By Power Source, 2017-2030 (US$ Bn)
12.4.5.4. Italy Portable Inverter Generators, By Application, 2017-2030 (US$ Bn)
12.4.6. Spain
12.4.6.1. Spain Portable Inverter Generators Market Estimates and Forecast, 2017-2030 (US$ Bn)
12.4.6.2. Spain Portable Inverter Generators, By Power Rating, 2017-2030 (US$ Bn)
12.4.6.3. Spain Portable Inverter Generators, By Power Source, 2017-2030 (US$ Bn)
12.4.6.4. Spain Portable Inverter Generators, By Application, 2017-2030 (US$ Bn)
12.4.7. Rest of Europe
12.4.7.1. Rest of Europe Portable Inverter Generators Market Estimates and Forecast, 2017-2030 (US$ Bn)
12.4.7.2. Rest of Europe Portable Inverter Generators, By Power Rating, 2017-2030 (US$ Bn)
12.4.7.3. Rest of Europe Portable Inverter Generators, By Power Source, 2017-2030 (US$ Bn)
12.4.7.4. Rest of Europe Portable Inverter Generators, By Application, 2017-2030 (US$ Bn)

13. Asia Pacific Portable Inverter Generators Market Analysis
13.1. Asia Pacific Portable Inverter Generators Market, by Power Rating, 2017-2030(US$ Bn)
13.1.1. Overview
13.1.2. SRC Analysis
13.2. Asia Pacific Portable Inverter Generators Market, by Power Source, 2017-2030(US$ Bn)
13.2.1. Overview
13.2.2. SRC Analysis
13.3. Asia Pacific Portable Inverter Generators Market, by Application, 2017-2030(US$ Bn)
13.3.1. Overview
13.3.2. SRC Analysis
13.4. Asia Pacific Portable Inverter Generators Market, by Country, 2017-2030 (US$ Bn)
13.4.1. Asia Pacific Portable Inverter Generators Market, by Country, 2022 Vs 2030 (in%)
13.4.2. China
13.4.2.1. China Portable Inverter Generators Market Estimates and Forecast, 2017-2030 (US$ Bn)
13.4.2.2. China Portable Inverter Generators, By Power Rating, 2017-2030 (US$ Bn)
13.4.2.3. China Portable Inverter Generators, By Power Source, 2017-2030 (US$ Bn)
13.4.2.4. China Portable Inverter Generators, By Application, 2017-2030 (US$ Bn)
13.4.3. Japan
13.4.3.1. Japan Portable Inverter Generators Market Estimates and Forecast, 2017-2030 (US$ Bn)
13.4.3.2. Japan Portable Inverter Generators, By Power Rating, 2017-2030 (US$ Bn)
13.4.3.3. Japan Portable Inverter Generators, By Power Source, 2017-2030 (US$ Bn)
13.4.3.4. Japan Portable Inverter Generators, By Application, 2017-2030 (US$ Bn)
13.4.4. India
13.4.4.1. India Portable Inverter Generators Market Estimates and Forecast, 2017-2030 (US$ Bn)
13.4.4.2. India Portable Inverter Generators, By Power Rating, 2017-2030 (US$ Bn)
13.4.4.3. India Portable Inverter Generators, By Power Source, 2017-2030 (US$ Bn)
13.4.4.4. India Portable Inverter Generators, By Application, 2017-2030 (US$ Bn)
13.4.5. South Korea
13.4.5.1. South Korea Portable Inverter Generators Market Estimates and Forecast, 2017-2030 (US$ Bn)
13.4.5.2. South Korea Portable Inverter Generators, By Power Rating, 2017-2030 (US$ Bn)
13.4.5.3. South Korea Portable Inverter Generators, By Power Source, 2017-2030 (US$ Bn)
13.4.5.4. South Korea Portable Inverter Generators, By Application, 2017-2030 (US$ Bn)
13.4.6. South-East Asia
13.4.6.1. South-East Asia Portable Inverter Generators Market Estimates and Forecast, 2017-2030 (US$ Bn)
13.4.6.2. South-East Asia Portable Inverter Generators, By Power Rating, 2017-2030 (US$ Bn)
13.4.6.3. South-East Asia Portable Inverter Generators, By Power Source, 2017-2030 (US$ Bn)
13.4.6.4. South-East Asia Portable Inverter Generators, By Application, 2017-2030 (US$ Bn)
13.4.7. Rest of Asia Pacific
13.4.7.1. Rest of Asia Pacific Portable Inverter Generators Market Estimates and Forecast, 2017-2030 (US$ Bn)
13.4.7.2. Rest of Asia Pacific Portable Inverter Generators, By Power Rating, 2017-2030 (US$ Bn)
13.4.7.3. Rest of Asia Pacific Portable Inverter Generators, By Power Source, 2017-2030 (US$ Bn)
13.4.7.4. Rest of Asia Pacific Portable Inverter Generators, By Application, 2017-2030 (US$ Bn)

14. Latin America Portable Inverter Generators Market Analysis
14.1. Latin America Portable Inverter Generators Market, by Power Rating, 2017-2030(US$ Bn)
14.1.1. Overview
14.1.2. SRC Analysis
14.2. Latin America Portable Inverter Generators Market, by Power Source, 2017-2030(US$ Bn)
14.2.1. Overview
14.2.2. SRC Analysis
14.3. Latin America Portable Inverter Generators Market, by Application, 2017-2030(US$ Bn)
14.3.1. Overview
14.3.2. SRC Analysis
14.4. Latin America Portable Inverter Generators Market, by Country, 2017-2030 (US$ Bn)
14.4.1. Latin America Portable Inverter Generators Market, by Country, 2022 Vs 2030 (in%)
14.4.2. Brazil
14.4.2.1. Brazil Portable Inverter Generators Market Estimates and Forecast, 2017-2030 (US$ Bn)
14.4.2.2. Brazil Portable Inverter Generators, By Power Rating, 2017-2030 (US$ Bn)
14.4.2.3. Brazil Portable Inverter Generators, By Power Source, 2017-2030 (US$ Bn)
14.4.2.4. Brazil Portable Inverter Generators, By Application, 2017-2030 (US$ Bn)
14.4.3. Argentina
14.4.3.1. Argentina Portable Inverter Generators Market Estimates and Forecast, 2017-2030 (US$ Bn)
14.4.3.2. Argentina Portable Inverter Generators, By Power Rating, 2017-2030 (US$ Bn)
14.4.3.3. Argentina Portable Inverter Generators, By Power Source, 2017-2030 (US$ Bn)
14.4.3.4. Argentina Portable Inverter Generators, By Application, 2017-2030 (US$ Bn)
14.4.4. Rest of Latin America
14.4.4.1. Rest of Latin America Portable Inverter Generators Market Estimates and Forecast, 2017-2030 (US$ Bn)
14.4.4.2. Rest of Latin America Portable Inverter Generators, By Power Rating, 2017-2030 (US$ Bn)
14.4.4.3. Rest of Latin America Portable Inverter Generators, By Power Source, 2017-2030 (US$ Bn)
14.4.4.4. Rest of Latin America Portable Inverter Generators, By Application, 2017-2030 (US$ Bn)

15. Middle East and Africa Portable Inverter Generators Market Analysis
15.1. Middle East and Africa Portable Inverter Generators Market, by Power Rating, 2017-2030(US$ Bn)
15.1.1. Overview
15.1.2. SRC Analysis
15.2. Middle East and Africa Portable Inverter Generators Market, by Power Source, 2017-2030(US$ Bn)
15.2.1. Overview
15.2.2. SRC Analysis
15.3. Middle East and Africa Portable Inverter Generators Market, by Application, 2017-2030(US$ Bn)
15.3.1. Overview
15.3.2. SRC Analysis
15.4. Middle East and Africa Portable Inverter Generators Market, by Country, 2017-2030 (US$ Bn)
15.4.1. Middle East and Africa Portable Inverter Generators Market, by Country, 2022 Vs 2030 (in%)
15.4.2. GCC Countries
15.4.2.1. GCC Countries Portable Inverter Generators Market Estimates and Forecast, 2017-2030 (US$ Bn)
15.4.2.2. GCC Countries Portable Inverter Generators, By Power Rating, 2017-2030 (US$ Bn)
15.4.2.3. GCC Countries Portable Inverter Generators, By Power Source, 2017-2030 (US$ Bn)
15.4.2.4. GCC Countries Portable Inverter Generators, By Application, 2017-2030 (US$ Bn)
15.4.3. South Africa
15.4.3.1. South Africa Portable Inverter Generators Market Estimates and Forecast, 2017-2030 (US$ Bn)
15.4.3.2. South Africa Portable Inverter Generators, By Power Rating, 2017-2030 (US$ Bn)
15.4.3.3. South Africa Portable Inverter Generators, By Power Source, 2017-2030 (US$ Bn)
15.4.3.4. South Africa Portable Inverter Generators, By Application, 2017-2030 (US$ Bn)
15.4.4. Rest of Middle East and Africa
15.4.4.1. Rest of Middle East and Africa Portable Inverter Generators Market Estimates and Forecast, 2017-2030 (US$ Bn)
15.4.4.2. Rest of Middle East and Africa Portable Inverter Generators, By Power Rating, 2017-2030 (US$ Bn)
15.4.4.3. Rest of Middle East and Africa Portable Inverter Generators, By Power Source, 2017-2030 (US$ Bn)
15.4.4.4. Rest of Middle East and Africa Portable Inverter Generators, By Application, 2017-2030 (US$ Bn)

16. Company Profiles
16.1. Honda Power Equipment WEN Products
16.1.1. Company Overview
16.1.2. Products/Services Portfolio
16.1.3. Geographical Presence
16.1.4. Financial Summary
16.1.4.1. Market Revenue and Net Profit (2019-2022)
16.1.4.2. Business Segment Revenue Analysis
16.1.4.3. Geographical Revenue Analysis
16.2. Firman Power Equipment
16.3. Briggs & Stratton
16.4. Ryovi
16.5. Duromax Power Equipment
16.6. Champion Power Equipment
16.7. WEN Products
16.8. Generac Power Systems
16.9. Westinghouse Electric Company
16.10. Yamaha Motor Co.

List of Figures
FIG. 1 Global Portable Inverter Generators Market: Research Methodology
FIG. 2 Market Size Estimation – Top Down & Bottom up Approach
FIG. 3 Global Portable Inverter Generators Market Segmentation
FIG. 4 Global Portable Inverter Generators Market, by Power Rating, 2022 (US$ Bn)
FIG. 5 Global Portable Inverter Generators Market, by Power Source, 2022 (US$ Bn)
FIG. 6 Global Portable Inverter Generators Market, by Application, 2022 (US$ Bn)
FIG. 7 Global Portable Inverter Generators Market, by Geography, 2022 (US$ Bn)
FIG. 8 Attractive Investment Proposition, by Power Rating, 2022
FIG. 9 Attractive Investment Proposition, by Power Source, 2022
FIG. 10 Attractive Investment Proposition, by Application, 2022
FIG. 11 Attractive Investment Proposition, by Geography, 2022
FIG. 12 Global Market Share Analysis of Key Portable Inverter Generators Market Manufacturers, 2022
FIG. 13 Global Market Positioning of Key Portable Inverter Generators Market Manufacturers, 2022
FIG. 14 Global Portable Inverter Generators Market Value Contribution, By Power Rating, 2022 & 2030 (Value %)
FIG. 15 Global Portable Inverter Generators Market, by 1kVA, Value, 2017-2030 (US$ Bn)
FIG. 16 Global Portable Inverter Generators Market, by 1kVA to 2kVA, Value, 2017-2030 (US$ Bn)
FIG. 17 Global Portable Inverter Generators Market, by >2kVA to 3kVA, Value, 2017-2030 (US$ Bn)
FIG. 18 Global Portable Inverter Generators Market, by >3kVA to 4kVA, Value, 2017-2030 (US$ Bn)
FIG. 19 Global Portable Inverter Generators Market, by >4kVA, Value, 2017-2030 (US$ Bn)
FIG. 20 Global Portable Inverter Generators Market Value Contribution, By Power Source, 2022 & 2030 (Value %)
FIG. 21 Global Portable Inverter Generators Market, by Gasoline, Value, 2017-2030 (US$ Bn)
FIG. 22 Global Portable Inverter Generators Market, by Diesel, 2017-2030 (US$ Bn)
FIG. 23 Global Portable Inverter Generators Market Value Contribution, By Application, 2022 & 2030 (Value %)
FIG. 24 Global Portable Inverter Generators Market, by Residential, Value, 2017-2030 (US$ Bn)
FIG. 25 Global Portable Inverter Generators Market, by Outdoor Sports, 2017-2030 (US$ Bn)
FIG. 26 Global Portable Inverter Generators Market, by Construction, 2017-2030 (US$ Bn)
FIG. 27 North America Portable Inverter Generators Market, 2017-2030 (US$ Bn)
FIG. 28 U.S. Portable Inverter Generators Market, 2017-2030 (US$ Bn)
FIG. 29 Canada Portable Inverter Generators Market, 2017-2030 (US$ Bn)
FIG. 30 Mexico Portable Inverter Generators Market, 2017-2030 (US$ Bn)
FIG. 31 Europe Portable Inverter Generators Market, 2017-2030 (US$ Bn)
FIG. 32 Germany Portable Inverter Generators Market, 2017-2030 (US$ Bn)
FIG. 33 France Portable Inverter Generators Market, 2017-2030 (US$ Bn)
FIG. 34 U.K. Portable Inverter Generators Market, 2017-2030 (US$ Bn)
FIG. 35 Italy Portable Inverter Generators Market, 2017-2030 (US$ Bn)
FIG. 36 Spain Portable Inverter Generators Market, 2017-2030 (US$ Bn)
FIG. 37 Rest of Europe Portable Inverter Generators Market, 2017-2030 (US$ Bn)
FIG. 38 Asia Pacific Portable Inverter Generators Market, 2017-2030 (US$ Bn)
FIG. 39 China Portable Inverter Generators Market, 2017-2030 (US$ Bn)
FIG. 40 Japan Portable Inverter Generators Market, 2017-2030 (US$ Bn)
FIG. 41 India Portable Inverter Generators Market, 2017-2030 (US$ Bn)
FIG. 42 South Korea Portable Inverter Generators Market, 2017-2030 (US$ Bn)
FIG. 43 South-East Asia Portable Inverter Generators Market, 2017-2030 (US$ Bn)
FIG. 44 Rest of Asia Pacific Portable Inverter Generators Market, 2017-2030 (US$ Bn)
FIG. 45 Latin America Portable Inverter Generators Market, 2017-2030 (US$ Bn)
FIG. 46 Brazil Portable Inverter Generators Market, 2017-2030 (US$ Bn)
FIG. 47 Mexico Portable Inverter Generators Market, 2017-2030 (US$ Bn)
FIG. 48 Rest of Latin America Portable Inverter Generators Market, 2017-2030 (US$ Bn)
FIG. 49 Middle East & Africa Portable Inverter Generators Market, 2017-2030 (US$ Bn)
FIG. 50 GCC Countries Portable Inverter Generators Market, 2017-2030 (US$ Bn)
FIG. 51 South Africa Portable Inverter Generators Market, 2017-2030 (US$ Bn)
FIG. 52 Rest of Middle East and Africa Portable Inverter Generators Market, 2017-2030 (US$ Bn)

List of Tables
TABLE 1 Market Snapshot: Global Portable Inverter Generators Market
TABLE 2 Global Portable Inverter Generators Market: Market Drivers Impact Analysis
TABLE 3 Global Portable Inverter Generators Market: Market Restraints Impact Analysis
TABLE 4 Global Portable Inverter Generators Market, by Competitive Benchmarking, 2022
TABLE 5 Global Portable Inverter Generators Market, by Geographical Presence Analysis, 2022
TABLE 6 Global Portable Inverter Generators Market, by Key Strategies Analysis, 2022
TABLE 7 Global Portable Inverter Generators Market, by 1kVA, By Region, 2017-2022 (US$ Bn)
TABLE 8 Global Portable Inverter Generators Market, by 1kVA, By Region, 2023-2030 (US$ Bn)
TABLE 9 Global Portable Inverter Generators Market, by 1kVA to 2kVA, By Region, 2017-2022 (US$ Bn)
TABLE 10 Global Portable Inverter Generators Market, by 1kVA to 2kVA, By Region, 2023-2030 (US$ Bn)
TABLE 11 Global Portable Inverter Generators Market, by >2kVA to 3kVA, By Region, 2017-2022 (US$ Bn)
TABLE 12 Global Portable Inverter Generators Market, by >2kVA to 3kVA, By Region, 2023-2030 (US$ Bn)
TABLE 13 Global Portable Inverter Generators Market, by >3kVA to 4kVA, By Region, 2017-2022 (US$ Bn)
TABLE 14 Global Portable Inverter Generators Market, by >3kVA to 4kVA, By Region, 2023-2030 (US$ Bn)
TABLE 15 Global Portable Inverter Generators Market, by >4kVA, By Region, 2017-2022 (US$ Bn)
TABLE 16 Global Portable Inverter Generators Market, by >4kVA, By Region, 2023-2030 (US$ Bn)
TABLE 17 Global Portable Inverter Generators Market, by Gasoline, By Region, 2017-2022 (US$ Bn)
TABLE 18 Global Portable Inverter Generators Market, by Gasoline, By Region, 2023-2030 (US$ Bn)
TABLE 19 Global Portable Inverter Generators Market, by Diesel, By Region, 2017-2022 (US$ Bn)
TABLE 20 Global Portable Inverter Generators Market, by Diesel, By Region, 2023-2030 (US$ Bn)
TABLE 21 Global Portable Inverter Generators Market, by Residential, By Region, 2017-2022 (US$ Bn)
TABLE 22 Global Portable Inverter Generators Market, by Residential, By Region, 2023-2030 (US$ Bn)
TABLE 23 Global Portable Inverter Generators Market, by Outdoor Sports, By Region, 2017-2022 (US$ Bn)
TABLE 24 Global Portable Inverter Generators Market, by Outdoor Sports, By Region, 2023-2030 (US$ Bn)
TABLE 25 Global Portable Inverter Generators Market, by Construction, By Region, 2017-2022 (US$ Bn)
TABLE 26 Global Portable Inverter Generators Market, by Construction, By Region, 2023-2030 (US$ Bn)
TABLE 27 Global Portable Inverter Generators Market, by Power Rating, 2017-2022 (US$ Bn)
TABLE 28 Global Portable Inverter Generators Market, by Power Rating, 2023-2030 (US$ Bn)
TABLE 29 Global Portable Inverter Generators Market, by Power Source, 2017-2022 (US$ Bn)
TABLE 30 Global Portable Inverter Generators Market, by Power Source, 2023-2030 (US$ Bn)
TABLE 31 Global Portable Inverter Generators Market, by Application, 2017-2022 (US$ Bn)
TABLE 32 Global Portable Inverter Generators Market, by Application, 2023-2030 (US$ Bn)
TABLE 33 Global Portable Inverter Generators Market, by Region, 2017-2022 (US$ Bn)
TABLE 34 Global Portable Inverter Generators Market, by Region, 2023-2030 (US$ Bn)
TABLE 35 North America Portable Inverter Generators Market, by Power Rating, 2017-2022 (US$ Bn)
TABLE 36 North America Portable Inverter Generators Market, by Power Rating, 2023-2030 (US$ Bn)
TABLE 37 North America Portable Inverter Generators Market, by Power Source, 2017-2022 (US$ Bn)
TABLE 38 North America Portable Inverter Generators Market, by Power Source, 2023-2030 (US$ Bn)
TABLE 39 North America Portable Inverter Generators Market, by Application, 2017-2022 (US$ Bn)
TABLE 40 North America Portable Inverter Generators Market, by Application, 2023-2030 (US$ Bn)
TABLE 41 North America Portable Inverter Generators Market, by Country, 2017-2022 (US$ Bn)
TABLE 42 North America Portable Inverter Generators Market, by Country, 2023-2030 (US$ Bn)
TABLE 43 United States Portable Inverter Generators Market, by Power Rating, 2017-2022 (US$ Bn)
TABLE 44 United States Portable Inverter Generators Market, by Power Rating, 2023-2030 (US$ Bn)
TABLE 45 United States Portable Inverter Generators Market, by Power Source, 2017-2022 (US$ Bn)
TABLE 46 United States Portable Inverter Generators Market, by Power Source, 2023-2030 (US$ Bn)
TABLE 47 United States Portable Inverter Generators Market, by Application, 2017-2022 (US$ Bn)
TABLE 48 United States Portable Inverter Generators Market, by Application, 2023-2030 (US$ Bn)
TABLE 49 Canada Portable Inverter Generators Market, by Power Rating, 2017-2022 (US$ Bn)
TABLE 50 Canada Portable Inverter Generators Market, by Power Rating, 2023-2030 (US$ Bn)
TABLE 51 Canada Portable Inverter Generators Market, by Power Source, 2017-2022 (US$ Bn)
TABLE 52 Canada Portable Inverter Generators Market, by Power Source, 2023-2030 (US$ Bn)
TABLE 53 Canada Portable Inverter Generators Market, by Application, 2017-2022 (US$ Bn)
TABLE 54 Canada Portable Inverter Generators Market, by Application, 2023-2030 (US$ Bn)
TABLE 55 Mexico Portable Inverter Generators Market, by Power Rating, 2017-2022 (US$ Bn)
TABLE 56 Mexico Portable Inverter Generators Market, by Power Rating, 2023-2030 (US$ Bn)
TABLE 57 Mexico Portable Inverter Generators Market, by Power Source, 2017-2022 (US$ Bn)
TABLE 58 Mexico Portable Inverter Generators Market, by Power Source, 2023-2030 (US$ Bn)
TABLE 59 Mexico Portable Inverter Generators Market, by Application, 2017-2022 (US$ Bn)
TABLE 60 Mexico Portable Inverter Generators Market, by Application, 2023-2030 (US$ Bn)
TABLE 61 Europe Portable Inverter Generators Market, by Power Rating, 2017-2022 (US$ Bn)
TABLE 62 Europe Portable Inverter Generators Market, by Power Rating, 2023-2030 (US$ Bn)
TABLE 63 Europe Portable Inverter Generators Market, by Power Source, 2017-2022 (US$ Bn)
TABLE 64 Europe Portable Inverter Generators Market, by Power Source, 2023-2030 (US$ Bn)
TABLE 65 Europe Portable Inverter Generators Market, by Application, 2017-2022 (US$ Bn)
TABLE 66 Europe Portable Inverter Generators Market, by Application, 2023-2030 (US$ Bn)
TABLE 67 Europe Portable Inverter Generators Market, by Country, 2017-2022 (US$ Bn)
TABLE 68 Europe Portable Inverter Generators Market, by Country, 2023-2030 (US$ Bn)
TABLE 69 Germany Portable Inverter Generators Market, by Power Rating, 2017-2022 (US$ Bn)
TABLE 70 Germany Portable Inverter Generators Market, by Power Rating, 2023-2030 (US$ Bn)
TABLE 71 Germany Portable Inverter Generators Market, by Power Source, 2017-2022 (US$ Bn)
TABLE 72 Germany Portable Inverter Generators Market, by Power Source, 2023-2030 (US$ Bn)
TABLE 73 Germany Portable Inverter Generators Market, by Application, 2017-2022 (US$ Bn)
TABLE 74 Germany Portable Inverter Generators Market, by Application, 2023-2030 (US$ Bn)
TABLE 75 France Portable Inverter Generators Market, by Power Rating, 2017-2022 (US$ Bn)
TABLE 76 France Portable Inverter Generators Market, by Power Rating, 2023-2030 (US$ Bn)
TABLE 77 France Portable Inverter Generators Market, by Power Source, 2017-2022 (US$ Bn)
TABLE 78 France Portable Inverter Generators Market, by Power Source, 2023-2030 (US$ Bn)
TABLE 79 France Portable Inverter Generators Market, by Application, 2017-2022 (US$ Bn)
TABLE 80 France Portable Inverter Generators Market, by Application, 2023-2030 (US$ Bn)
TABLE 81 United Kingdom Portable Inverter Generators Market, by Power Rating, 2017-2022 (US$ Bn)
TABLE 82 United Kingdom Portable Inverter Generators Market, by Power Rating, 2023-2030 (US$ Bn)
TABLE 83 United Kingdom Portable Inverter Generators Market, by Power Source, 2017-2022 (US$ Bn)
TABLE 84 United Kingdom Portable Inverter Generators Market, by Power Source, 2023-2030 (US$ Bn)
TABLE 85 United Kingdom Portable Inverter Generators Market, by Application, 2017-2022 (US$ Bn)
TABLE 86 United Kingdom Portable Inverter Generators Market, by Application, 2023-2030 (US$ Bn)
TABLE 87 Italy Portable Inverter Generators Market, by Power Rating, 2017-2022 (US$ Bn)
TABLE 88 Italy Portable Inverter Generators Market, by Power Rating, 2023-2030 (US$ Bn)
TABLE 89 Italy Portable Inverter Generators Market, by Power Source, 2017-2022 (US$ Bn)
TABLE 90 Italy Portable Inverter Generators Market, by Power Source, 2023-2030 (US$ Bn)
TABLE 91 Italy Portable Inverter Generators Market, by Application, 2017-2022 (US$ Bn)
TABLE 92 Italy Portable Inverter Generators Market, by Application, 2023-2030 (US$ Bn)
TABLE 93 Spain Portable Inverter Generators Market, by Power Rating, 2017-2022 (US$ Bn)
TABLE 94 Spain Portable Inverter Generators Market, by Power Rating, 2023-2030 (US$ Bn)
TABLE 95 Spain Portable Inverter Generators Market, by Power Source, 2017-2022 (US$ Bn)
TABLE 96 Spain Portable Inverter Generators Market, by Power Source, 2023-2030 (US$ Bn)
TABLE 97 Spain Portable Inverter Generators Market, by Application, 2017-2022 (US$ Bn)
TABLE 98 Spain Portable Inverter Generators Market, by Application, 2023-2030 (US$ Bn)
TABLE 99 Rest of Europe Portable Inverter Generators Market, by Power Rating, 2017-2022 (US$ Bn)
TABLE 100 Rest of Europe Portable Inverter Generators Market, by Power Rating, 2023-2030 (US$ Bn)
TABLE 101 Rest of Europe Portable Inverter Generators Market, by Power Source, 2017-2022 (US$ Bn)
TABLE 102 Rest of Europe Portable Inverter Generators Market, by Power Source, 2023-2030 (US$ Bn)
TABLE 103 Rest of Europe Portable Inverter Generators Market, by Application, 2017-2022 (US$ Bn)
TABLE 104 Rest of Europe Portable Inverter Generators Market, by Application, 2023-2030 (US$ Bn)
TABLE 105 Asia Pacific Portable Inverter Generators Market, by Power Rating, 2017-2022 (US$ Bn)
TABLE 106 Asia Pacific Portable Inverter Generators Market, by Power Rating, 2023-2030 (US$ Bn)
TABLE 107 Asia Pacific Portable Inverter Generators Market, by Power Source, 2017-2022 (US$ Bn)
TABLE 108 Asia Pacific Portable Inverter Generators Market, by Power Source, 2023-2030 (US$ Bn)
TABLE 109 Asia Pacific Portable Inverter Generators Market, by Application, 2017-2022 (US$ Bn)
TABLE 110 Asia Pacific Portable Inverter Generators Market, by Application, 2023-2030 (US$ Bn)
TABLE 111 China Portable Inverter Generators Market, by Power Rating, 2017-2022 (US$ Bn)
TABLE 112 China Portable Inverter Generators Market, by Power Rating, 2023-2030 (US$ Bn)
TABLE 113 China Portable Inverter Generators Market, by Power Source, 2017-2022 (US$ Bn)
TABLE 114 China Portable Inverter Generators Market, by Power Source, 2023-2030 (US$ Bn)
TABLE 115 China Portable Inverter Generators Market, by Application, 2017-2022 (US$ Bn)
TABLE 116 China Portable Inverter Generators Market, by Application, 2023-2030 (US$ Bn)
TABLE 117 Japan Portable Inverter Generators Market, by Power Rating, 2017-2022 (US$ Bn)
TABLE 118 Japan Portable Inverter Generators Market, by Power Rating, 2023-2030 (US$ Bn)
TABLE 119 Japan Portable Inverter Generators Market, by Power Source, 2017-2022 (US$ Bn)
TABLE 120 Japan Portable Inverter Generators Market, by Power Source, 2023-2030 (US$ Bn)
TABLE 121 Japan Portable Inverter Generators Market, by Application, 2017-2022 (US$ Bn)
TABLE 122 Japan Portable Inverter Generators Market, by Application, 2023-2030 (US$ Bn)
TABLE 123 India Portable Inverter Generators Market, by Power Rating, 2017-2022 (US$ Bn)
TABLE 124 India Portable Inverter Generators Market, by Power Rating, 2023-2030 (US$ Bn)
TABLE 125 India Portable Inverter Generators Market, by Power Source, 2017-2022 (US$ Bn)
TABLE 126 India Portable Inverter Generators Market, by Power Source, 2023-2030 (US$ Bn)
TABLE 127 India Portable Inverter Generators Market, by Application, 2017-2022 (US$ Bn)
TABLE 128 India Portable Inverter Generators Market, by Application, 2023-2030 (US$ Bn)
TABLE 129 South Korea Portable Inverter Generators Market, by Power Rating, 2017-2022 (US$ Bn)
TABLE 130 South Korea Portable Inverter Generators Market, by Power Rating, 2023-2030 (US$ Bn)
TABLE 131 South Korea Portable Inverter Generators Market, by Power Source, 2017-2022 (US$ Bn)
TABLE 132 South Korea Portable Inverter Generators Market, by Power Source, 2023-2030 (US$ Bn)
TABLE 133 South Korea Portable Inverter Generators Market, by Application, 2017-2022 (US$ Bn)
TABLE 134 South Korea Portable Inverter Generators Market, by Application, 2023-2030 (US$ Bn)
TABLE 135 South-East Asia Portable Inverter Generators Market, by Power Rating, 2017-2022 (US$ Bn)
TABLE 136 South-East Asia Portable Inverter Generators Market, by Power Rating, 2023-2030 (US$ Bn)
TABLE 137 South-East Asia Portable Inverter Generators Market, by Power Source, 2017-2022 (US$ Bn)
TABLE 138 South-East Asia Portable Inverter Generators Market, by Power Source, 2023-2030 (US$ Bn)
TABLE 139 South-East Asia Portable Inverter Generators Market, by Application, 2017-2022 (US$ Bn)
TABLE 140 South-East Asia Portable Inverter Generators Market, by Application, 2023-2030 (US$ Bn)
TABLE 141 Rest of Asia Pacific Portable Inverter Generators Market, by Power Rating, 2017-2022 (US$ Bn)
TABLE 142 Rest of Asia Pacific Portable Inverter Generators Market, by Power Rating, 2023-2030 (US$ Bn)
TABLE 143 Rest of Asia Pacific Portable Inverter Generators Market, by Power Source, 2017-2022 (US$ Bn)
TABLE 144 Rest of Asia Pacific Portable Inverter Generators Market, by Power Source, 2023-2030 (US$ Bn)
TABLE 145 Rest of Asia Pacific Portable Inverter Generators Market, by Application, 2017-2022 (US$ Bn)
TABLE 146 Rest of Asia Pacific Portable Inverter Generators Market, by Application, 2023-2030 (US$ Bn)
TABLE 147 Latin America Portable Inverter Generators Market, by Power Rating, 2017-2022 (US$ Bn)
TABLE 148 Latin America Portable Inverter Generators Market, by Power Rating, 2023-2030 (US$ Bn)
TABLE 149 Latin America Portable Inverter Generators Market, by Power Source, 2017-2022 (US$ Bn)
TABLE 150 Latin America Portable Inverter Generators Market, by Power Source, 2023-2030 (US$ Bn)
TABLE 151 Latin America Portable Inverter Generators Market, by Application, 2017-2022 (US$ Bn)
TABLE 152 Latin America Portable Inverter Generators Market, by Application, 2023-2030 (US$ Bn)
TABLE 153 Brazil Portable Inverter Generators Market, by Power Rating, 2017-2022 (US$ Bn)
TABLE 154 Brazil Portable Inverter Generators Market, by Power Rating, 2023-2030 (US$ Bn)
TABLE 155 Brazil Portable Inverter Generators Market, by Power Source, 2017-2022 (US$ Bn)
TABLE 156 Brazil Portable Inverter Generators Market, by Power Source, 2023-2030 (US$ Bn)
TABLE 157 Brazil Portable Inverter Generators Market, by Application, 2017-2022 (US$ Bn)
TABLE 158 Brazil Portable Inverter Generators Market, by Application, 2023-2030 (US$ Bn)
TABLE 159 Argentina Portable Inverter Generators Market, by Power Rating, 2017-2022 (US$ Bn)
TABLE 160 Argentina Portable Inverter Generators Market, by Power Rating, 2023-2030 (US$ Bn)
TABLE 161 Argentina Portable Inverter Generators Market, by Power Source, 2017-2022 (US$ Bn)
TABLE 162 Argentina Portable Inverter Generators Market, by Power Source, 2023-2030 (US$ Bn)
TABLE 163 Argentina Portable Inverter Generators Market, by Application, 2017-2022 (US$ Bn)
TABLE 164 Argentina Portable Inverter Generators Market, by Application, 2023-2030 (US$ Bn)
TABLE 165 Rest of Latin America Portable Inverter Generators Market, by Power Rating, 2017-2022 (US$ Bn)
TABLE 166 Rest of Latin America Portable Inverter Generators Market, by Power Rating, 2023-2030 (US$ Bn)
TABLE 167 Rest of Latin America Portable Inverter Generators Market, by Power Source, 2017-2022 (US$ Bn)
TABLE 168 Rest of Latin America Portable Inverter Generators Market, by Power Source, 2023-2030 (US$ Bn)
TABLE 169 Rest of Latin America Portable Inverter Generators Market, by Application, 2017-2022 (US$ Bn)
TABLE 170 Rest of Latin America Portable Inverter Generators Market, by Application, 2023-2030 (US$ Bn)
TABLE 171 Middle East and Africa Portable Inverter Generators Market, by Power Rating, 2017-2022 (US$ Bn)
TABLE 172 Middle East and Africa Portable Inverter Generators Market, by Power Rating, 2023-2030 (US$ Bn)
TABLE 173 Middle East and Africa Portable Inverter Generators Market, by Power Source, 2017-2022 (US$ Bn)
TABLE 174 Middle East and Africa Portable Inverter Generators Market, by Power Source, 2023-2030 (US$ Bn)
TABLE 175 Middle East and Africa Portable Inverter Generators Market, by Application, 2017-2022 (US$ Bn)
TABLE 176 Middle East and Africa Portable Inverter Generators Market, by Application, 2023-2030 (US$ Bn)
TABLE 177 GCC Countries Portable Inverter Generators Market, by Power Rating, 2017-2022 (US$ Bn)
TABLE 178 GCC Countries Portable Inverter Generators Market, by Power Rating, 2023-2030 (US$ Bn)
TABLE 179 GCC Countries Portable Inverter Generators Market, by Power Source, 2017-2022 (US$ Bn)
TABLE 180 GCC Countries Portable Inverter Generators Market, by Power Source, 2023-2030 (US$ Bn)
TABLE 181 GCC Countries Portable Inverter Generators Market, by Application, 2017-2022 (US$ Bn)
TABLE 182 GCC Countries Portable Inverter Generators Market, by Application, 2023-2030 (US$ Bn)
TABLE 183 South Africa Portable Inverter Generators Market, by Power Rating, 2017-2022 (US$ Bn)
TABLE 184 South Africa Portable Inverter Generators Market, by Power Rating, 2023-2030 (US$ Bn)
TABLE 185 South Africa Portable Inverter Generators Market, by Power Source, 2017-2022 (US$ Bn)
TABLE 186 South Africa Portable Inverter Generators Market, by Power Source, 2023-2030 (US$ Bn)
TABLE 187 South Africa Portable Inverter Generators Market, by Application, 2017-2022 (US$ Bn)
TABLE 188 South Africa Portable Inverter Generators Market, by Application, 2023-2030 (US$ Bn)
TABLE 189 Rest of Middle East and Africa Portable Inverter Generators Market, by Power Rating, 2017-2022 (US$ Bn)
TABLE 190 Rest of Middle East and Africa Portable Inverter Generators Market, by Power Rating, 2023-2030 (US$ Bn)
TABLE 191 Rest of Middle East and Africa Portable Inverter Generators Market, by Power Source, 2017-2022 (US$ Bn)
TABLE 192 Rest of Middle East and Africa Portable Inverter Generators Market, by Power Source, 2023-2030 (US$ Bn)
TABLE 193 Rest of Middle East and Africa Portable Inverter Generators Market, by Application, 2017-2022 (US$ Bn)
TABLE 194 Rest of Middle East and Africa Portable Inverter Generators Market, by Application, 2023-2030 (US$ Bn)

Frequently Asked Questions

What is the current size of the global portable inverter generators market?

The global portable inverter generators market was valued at USD 2.2 Billion in 2022.

What is the expected growth rate of the portable inverter generators market between 2023 and 2030?

The portable inverter generators market is expected to grow at a CAGR of 6.50% between 2023 and 2030, reaching USD 3.4 Billion in 2030.

Which segment is leading the market share in terms of power rating?

1kVA to 2kVA category is the leading segment by power rating, holding over 35% share in terms of value in 2022.

Which power source segment governs the demand for portable inverter generators in the world?

The gasoline segment governs the demand for portable inverter generators in the world, holding a massive share of over 60% in 2022.

Which application segment is expected to post the highest CAGR during the forecast period?

The construction segment is expected to post the highest CAGR during the forecast period.

Which region is fueling the growth of the portable inverter generators industry?

North America is fueling the growth of the portable inverter generators industry, with over one-third share in 2022.

Who are the major players in the global portable inverter generators market?

The top players include Honda Power Equipment WEN Products, Firman Power Equipment, Briggs & Stratton, Ryovi, Duromax Power Equipment. Champion Power Equipment, WEN Products, Generac Power Systems, Westinghouse Electric Company and Yamaha Motor Co.

What are the major market drivers of the portable inverter generators industry?

In response to the increasingly frequent and severe electrical outages, market growth is ascribed to the increased importance of backup power and disaster planning measures. These units are expanding as a result of rising power outages, intensifying natural disasters, and declining grid resilience.

What are the major market restraints of the portable inverter generators industry?

In comparison to conventional generators, portable inverter generators are more efficient and standard. Pricey portable inverter generators decreased consumer demand. As opposed to conventional generators, portable inverter generators offer less power.

What are the major market opportunities of the portable inverter generators industry?

The increasing population increase and poor grid infrastructure will encourage the use of portable inverter generators. The potential of the business will be shaped by rising consumer spending confidence and rising disposable incomes.

Australia Energy Storage Systems Market

Published:
Report ID: 37321

Vietnam Diesel Generator Set Market

Published:
Report ID: 37167

Produced Water Treatment Market

Published:
Report ID: 8130

Power Distribution Unit Market

Published:
Report ID: 11062

Smart Grid Market

Published:
Report ID: 6144

Hydraulic Fracturing Market

Published:
Report ID: 7544

Coal Bed Methane Market

Published:
Report ID: 3595

Solar Water Pump Market

Published:
Report ID: 36797

Artificial Lift Systems Market

Published:
Report ID: 2043

U.S. Ground Power Unit Market

Published:
Report ID: 36528

Germany Ground Power Unit Market

Published:
Report ID: 36282

Purchase Options

$2999
Delivery Format: Excel.
$4999
Designed for the individual purchaser.
$6999
Users located at a single corporate site or regional office.
$7999
Allowed for unlimited sharing globally within one company.
Smallform of Sample request

Have a question?

User Profile

Don’t settle for less – trust Mitul to help you find the best solution.

Report delivery within 24 to 48 hours

– Other Info –

What people say?-

User Review

I am very impressed with the information in this report. The author clearly did their research when they came up with this product and it has already given me a lot of ideas.

Jana Schmidt
CEDAR CX Technologies

– Connect with us –

Phone

+91 6232 49 3207


support

24/7 Research Support


sales@credenceresearch.com

– Research Methodology –

Going beyond the basics: advanced techniques in research methodology

– Trusted By –

Pepshi, LG, Nestle
Motorola, Honeywell, Johnson and johnson
LG Chem, SIEMENS, Pfizer
Unilever, Samsonite, QIAGEN