
Market Overview
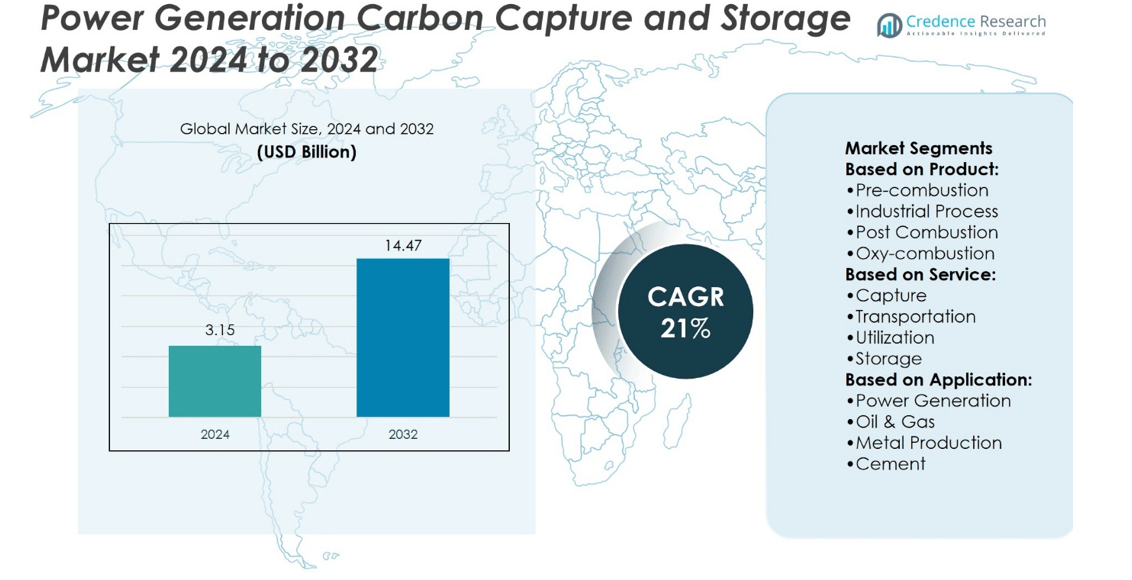
Power Generation Carbon Capture and Storage Market size was valued at USD 3.15 billion in 2024 and is anticipated to reach USD 14.47 billion by 2032, at a CAGR of 21% during the forecast period.
| REPORT ATTRIBUTE | DETAILS |
|---|---|
| Historical Period | 2020-2023 |
| Base Year | 2024 |
| Forecast Period | 2025-2032 |
| Power Generation Carbon Capture and Storage Market Size 2024 | USD 3.15 billion |
| Power Generation Carbon Capture and Storage Market, CAGR | 21% |
| Power Generation Carbon Capture and Storage Market Size 2032 | USD 14.47 billion |
The Power Generation Carbon Capture and Storage Market is driven by rising global pressure to reduce greenhouse gas emissions, stricter regulatory frameworks, and growing investments in clean energy infrastructure. It benefits from government incentives, large-scale funding programs, and strong support for decarbonization in coal and gas power plants. Key trends include the development of large CCS hubs, advancements in capture efficiency, and integration with hydrogen and bioenergy systems to expand low-carbon pathways. It also reflects increasing collaboration among utilities, technology providers, and policymakers to create scalable solutions that align energy security with climate goals.
The Power Generation Carbon Capture and Storage Market shows strong geographical presence, with North America leading through large-scale operational projects, Europe advancing with industrial clusters and storage hubs, and Asia-Pacific emerging with rising investments in China and Australia. The Middle East and Latin America display gradual adoption supported by oil and gas integration and pilot initiatives. Key players focus on technological innovation and strategic partnerships, with industry leaders driving deployment across capture, transportation, utilization, and storage networks to strengthen global adoption.
Market Insights
- Power Generation Carbon Capture and Storage Market size was valued at USD 3.15 billion in 2024 and is anticipated to reach USD 14.47 billion by 2032, at a CAGR of 21%.
- Rising demand for emission reduction, strict regulations, and growing investments in clean energy infrastructure drive market growth.
- Key trends include development of large-scale CCS hubs, improvements in capture efficiency, and integration with hydrogen and bioenergy systems.
- Competitive dynamics emphasize innovation, strategic partnerships, and large project execution by global industry leaders.
- High capital requirements, complex permitting, and long approval timelines act as restraints for wider adoption.
- North America leads with advanced projects, Europe grows through industrial clusters, and Asia-Pacific expands with new investments.
- Middle East leverages CCS in oil and gas operations, while Latin America progresses with smaller pilot-scale projects.
Market Drivers
Growing Emphasis on Reducing Carbon Emissions in Power Generation
The Power Generation Carbon Capture and Storage Market is strongly driven by the urgent global need to reduce greenhouse gas emissions from traditional fossil fuel-based power plants. Governments implement stringent emission regulations, creating demand for solutions that ensure compliance while sustaining energy production. It enables operators to meet carbon reduction goals without abrupt disruptions to power supply. Expanding climate commitments under global agreements continue to reinforce its adoption. Energy producers prioritize sustainable pathways, and carbon capture technology provides a practical tool for balancing energy security with environmental responsibilities. This regulatory and environmental push firmly supports market growth.
- For instance, Shell Quest Carbon Capture and Storage facility in Alberta, Canada, has captured and safely stored more than 8 million tonnes of CO₂ since it began operations in 2015, demonstrating the large-scale impact of industrial CCS projects on emission reduction.
Rising Integration of CCS with Existing and New Power Infrastructure
The Power Generation Carbon Capture and Storage Market gains momentum from the increasing deployment of CCS technologies across coal, gas, and biomass power plants. It allows operators to retrofit existing facilities or integrate systems into newly built plants to achieve lower emissions. Energy companies invest in pilot and full-scale projects, proving technical feasibility and cost optimization in real-world conditions. Partnerships between utilities and technology providers accelerate the rollout of these projects. Expanding research programs enhance capture efficiency, making the systems more viable for large-scale adoption. This integration secures its role as a cornerstone of low-carbon power infrastructure.
- For instance, Petra Nova, a joint venture between NRG Energy and JX Nippon Oil & Gas Exploration, successfully captured over 3.9 million tonnes of CO₂ from a coal-fired power plant in Texas between 2017 and 2020, showcasing the viability of large-scale retrofitted CCS systems in existing infrastructure.
Strong Investment from Governments and Private Sector for Decarbonization
The Power Generation Carbon Capture and Storage Market benefits from a steady rise in funding and investment aimed at accelerating decarbonization technologies. It attracts direct support through subsidies, tax incentives, and large-scale demonstration programs. Governments allocate billions of dollars to infrastructure that promotes widespread CCS deployment. Private energy companies also commit significant capital toward commercial-scale projects to strengthen their environmental, social, and governance (ESG) credentials. These financial flows reduce cost barriers and foster innovation in capture, transportation, and storage techniques. Continuous investment ensures the market maintains a stable growth trajectory.
Expanding Role of CCS in Enabling Renewable Energy Transition
The Power Generation Carbon Capture and Storage Market plays a pivotal role in supporting renewable energy integration by providing reliable low-carbon baseload power. It addresses the intermittency challenges of wind and solar by ensuring steady energy availability. Utilities adopt CCS to maintain flexible generation portfolios while pursuing net-zero strategies. It also supports hydrogen production from natural gas through carbon capture, reinforcing broader clean energy initiatives. Industrial collaborations extend the application of storage reservoirs to create shared networks that reduce overall costs. This positioning makes CCS an essential enabler of a balanced and sustainable energy mix.
Market Trends
Increasing Focus on Large-Scale Deployment and Commercial Viability
The Power Generation Carbon Capture and Storage Market shows a clear trend toward scaling technologies from pilot projects to full commercial operations. Utilities invest in larger facilities that capture millions of tons of CO₂ annually, demonstrating economic feasibility at grid levels. It benefits from engineering advances that cut operating costs while improving capture rates. Energy producers prioritize long-term deployment strategies to align with national decarbonization targets. Shared infrastructure models, including transport pipelines and storage hubs, gain wider adoption to lower individual project costs. This trend emphasizes the transition from experimentation to reliable mainstream integration.
- For instance, Boundary Dam Power Station in Saskatchewan, operated by SaskPower with technology from Mitsubishi Heavy Industries, has captured more than 6.8 million tonnes of CO₂ since its CCS system began operations in 2014, marking it as one of the largest commercial-scale CCS projects in the power generation sector.
Rising Innovation in Capture Efficiency and Storage Reliability
The Power Generation Carbon Capture and Storage Market advances through continuous improvements in capture technologies and reservoir management. It reflects innovation in solvents, membranes, and adsorption systems that increase efficiency beyond 90% capture rates. Research institutions and companies explore new geological storage options, including deep saline aquifers and depleted oil fields, to expand capacity. Real-time monitoring systems improve safety and transparency in underground storage operations. Utilities adopt digital platforms that optimize capture performance and predictive maintenance. This technological evolution strengthens confidence in CCS as a dependable emissions mitigation pathway.
- For instance, Linde plc has been involved in more than 1,000 CO₂ capture and utilization plants worldwide, with individual projects such as the Shell Quest facility in Canada contributing to the safe storage of over 7 million tonnes of CO₂ since 2015, underscoring the company’s role in advancing capture efficiency and long-term reliability.
Expanding Role of CCS in Supporting Hydrogen and Low-Carbon Fuels
The Power Generation Carbon Capture and Storage Market aligns with the broader shift toward hydrogen and synthetic fuels as part of the clean energy mix. It enables low-emission hydrogen production through reforming processes paired with capture systems. Integration with power plants facilitates carbon-neutral fuel development for transportation and industrial sectors. Countries invest in joint CCS and hydrogen hubs that maximize resource efficiency. Partnerships among utilities, refiners, and technology providers accelerate the commercialization of low-carbon fuels. This trend positions CCS as a bridge between conventional power generation and next-generation clean energy systems.
Growing International Collaboration and Policy Support for Net-Zero Goals
The Power Generation Carbon Capture and Storage Market strengthens through cross-border partnerships and multinational agreements focused on net-zero strategies. It gains visibility from joint projects that share technology, expertise, and infrastructure across regions. Policymakers expand funding frameworks that encourage private investment and de-risk large-scale projects. Emerging economies adopt CCS strategies to balance industrial growth with emission commitments. International agencies promote best practices and certification standards that enhance trust in storage projects. This collaborative environment accelerates global deployment and reinforces CCS as a critical element of energy transition policies.
Market Challenges Analysis
High Costs of Deployment and Limited Economic Incentives
The Power Generation Carbon Capture and Storage Market faces significant barriers from high capital and operating costs associated with large-scale projects. It requires substantial investment in capture units, transport pipelines, and storage infrastructure, which often exceeds the budgets of utilities without external support. Limited availability of long-term incentives or carbon pricing frameworks reduces the economic attractiveness for investors. Many projects rely on government subsidies, which create uncertainty about long-term financial stability. The lack of standardized financing mechanisms also delays widespread adoption. This cost burden continues to restrict the pace of deployment across global markets.
Technical Complexities and Public Acceptance Concerns
The Power Generation Carbon Capture and Storage Market also encounters challenges from technological and social factors that limit expansion. It must overcome technical hurdles related to efficiency losses in capture processes, risks of CO₂ leakage, and difficulties in monitoring storage reservoirs. Regulatory gaps in permitting and long project approval timelines further slow deployment. Public opposition arises from safety concerns and the perception that CCS extends fossil fuel reliance instead of driving clean energy transition. Energy producers face pressure to demonstrate transparent monitoring and accountability to build trust. These technical and societal obstacles remain central challenges for sustainable growth.
Market Opportunities
Integration with Emerging Clean Energy Pathways and Industrial Applications
The Power Generation Carbon Capture and Storage Market creates strong opportunities through integration with hydrogen production, synthetic fuels, and bioenergy systems. It enables low-carbon hydrogen generation from natural gas, supporting national clean energy roadmaps. Bioenergy plants paired with CCS achieve negative emissions, offering an effective tool for climate targets. Expanding use of captured CO₂ in enhanced oil recovery and chemical manufacturing adds commercial value. Utilities and industrial operators collaborate to share infrastructure, reducing costs while broadening applications. This synergy expands its role beyond power generation and enhances its appeal to multiple sectors.
Expansion in Developing Economies and Global Carbon Reduction Strategies
The Power Generation Carbon Capture and Storage Market holds untapped opportunities in emerging regions where energy demand continues to rise. It provides a pathway for these economies to pursue industrial growth without compromising emission targets. Governments across Asia-Pacific, Middle East, and Latin America show increasing interest in adopting CCS as part of their energy transition strategies. International financing institutions support these markets with funds and technical expertise to accelerate deployment. Cross-border storage and transportation networks create opportunities for regional cooperation. These developments open new avenues for scaling projects and establishing CCS as a global emissions solution.
Market Segmentation Analysis:
By Product
The Power Generation Carbon Capture and Storage Market is segmented into pre-combustion, industrial process, post-combustion, and oxy-combustion technologies. Pre-combustion systems gain traction in integrated gasification combined cycle (IGCC) plants where carbon removal occurs before fuel combustion. Industrial process capture grows in importance across heavy industries that emit concentrated CO₂ streams. Post-combustion solutions dominate in retrofitting existing coal and gas power plants due to their compatibility with conventional infrastructure. Oxy-combustion technology attracts attention for its ability to generate pure CO₂ streams, improving efficiency of capture and reducing energy penalties. It reflects a balanced mix of mature and emerging technologies serving varied industrial and energy needs.
- For instance, Equinor Sleipner project in the North Sea has been operational since 1996 and has successfully captured and stored more than 23 million tonnes of CO₂ in a saline aquifer, making it one of the world’s longest-running and most reliable large-scale CCS operations.
By Service
The Power Generation Carbon Capture and Storage Market covers capture, transportation, utilization, and storage services. Capture remains the largest segment as it represents the most technically demanding and capital-intensive step. Transportation infrastructure, primarily pipelines and shipping solutions, evolves with regional networks designed for shared access across industries. Utilization of captured CO₂ in chemicals, fuels, and enhanced oil recovery provides commercial incentives that support broader adoption. Storage emerges as a critical element, with deep saline aquifers and depleted oil and gas fields offering large-scale capacity. It underscores the importance of integrated service ecosystems to ensure long-term carbon management.
- For instance, Dakota Gasification Company’s Great Plains Synfuels Plant in North Dakota has captured and transported more than 40 million tonnes of CO₂ via a 320-kilometer pipeline to Canadian oil fields for enhanced oil recovery since 2000, demonstrating large-scale integration of capture, transport, and utilization services.
By Application
The Power Generation Carbon Capture and Storage Market finds applications in power generation, oil and gas, metal production, and cement sectors. Power generation leads adoption, driven by the need to reduce emissions from coal and natural gas plants while maintaining energy security. Oil and gas companies employ CCS for enhanced oil recovery while meeting decarbonization goals. Metal production facilities, particularly steel and aluminum, integrate capture solutions to offset emissions from energy-intensive processes. Cement producers adopt CCS as one of the few viable pathways to mitigate unavoidable process emissions. It highlights the role of CCS in addressing emissions across industries that lack scalable alternatives to achieve deep decarbonization.
Segments:
Based on Product:
- Pre-combustion
- Industrial Process
- Post Combustion
- Oxy-combustion
Based on Service:
- Capture
- Transportation
- Utilization
- Storage
Based on Application:
- Power Generation
- Oil & Gas
- Metal Production
- Cement
Based on the Geography:
- North America
- U.S.
- Canada
- Mexico
- Europe
- UK
- France
- Germany
- Italy
- Spain
- Russia
- Belgium
- Netherlands
- Austria
- Sweden
- Poland
- Denmark
- Switzerland
- Rest of Europe
- Asia Pacific
- China
- Japan
- South Korea
- India
- Australia
- Thailand
- Indonesia
- Vietnam
- Malaysia
- Philippines
- Taiwan
- Rest of Asia Pacific
- Latin America
- Brazil
- Argentina
- Peru
- Chile
- Colombia
- Rest of Latin America
- Middle East
- UAE
- KSA
- Israel
- Turkey
- Iran
- Rest of Middle East
- Africa
- Egypt
- Nigeria
- Algeria
- Morocco
- Rest of Africa
Regional Analysis
North America
North America dominates the Power Generation Carbon Capture and Storage Market with around 35% share of global operational CCS capacity. The United States and Canada lead adoption through large-scale projects integrated into coal, gas, and industrial facilities. The region benefits from advanced infrastructure, strong policy frameworks, and government incentives that encourage private investment. Projects like Petra Nova and Boundary Dam highlight technical maturity and commercial feasibility. It maintains its leadership through robust research and partnerships between utilities, technology providers, and federal agencies. This strong position reinforces North America’s role as the most developed CCS market worldwide.
Europe
Europe holds an estimated 6% market share, with steady growth supported by climate-neutral policies and the European Green Deal. Countries such as Norway, the UK, and the Netherlands focus on large CCS clusters that integrate multiple industries with shared infrastructure. Projects like Northern Lights and Porthos highlight the shift from isolated plants to coordinated hubs. It benefits from advanced regulatory support and significant public funding for low-carbon energy projects. Expanding investment in North Sea storage capacity further strengthens its long-term growth. Europe positions itself as a strategic hub for large-scale CCS expansion.
Asia-Pacific
Asia-Pacific accounts for about 7% of global share, driven by China’s rapid deployment of capture facilities and expanding research programs. China leads in project announcements, integrating CCS into coal-fired power and industrial sectors to balance energy needs with emission commitments. Australia contributes through projects linked to natural gas and carbon storage in offshore reservoirs. Japan, South Korea, and India show growing interest in CCS as part of clean energy transitions. It reflects rising momentum supported by government-backed pilot projects and strong industrial demand. Asia-Pacific is expected to increase its share as more large projects move into operation.
Latin America
Latin America currently represents around 2% of the global CCS market, with limited operational projects but high potential in the long term. Brazil leads with offshore CCS initiatives in the Santos Basin, where captured CO₂ supports enhanced oil recovery. Chile and Uruguay explore pilot-scale projects with international support. It shows interest in aligning energy growth with climate targets but lacks large-scale infrastructure. International partnerships remain crucial for financing and technical expertise. Latin America holds niche presence today but offers opportunities in oil, gas, and industrial applications.
Middle East & Africa
The Middle East & Africa collectively account for about 7% market share, led by Saudi Arabia, UAE, and Qatar with projects integrated into oil and gas operations. It leverages CCS for enhanced oil recovery while demonstrating commitment to emissions reduction goals. Planned projects in Africa remain limited, but South Africa shows interest in pilot initiatives. Strong state-backed funding and energy diversification plans drive future expansion. The region positions CCS as a strategic tool for sustaining hydrocarbon revenues while aligning with decarbonization pathways. It is expected to expand capacity rapidly as large projects move forward.
Key Player Analysis
- Mitsubishi Heavy Industries Ltd.
- Global Thermostat
- Exxon Mobil Corporation
- Aker Solutions
- Linde plc
- General Electric
- Equinor ASA
- HALLIBURTON
- Dakota Gasification Company
- Fluor Corporation
Competitive Analysis
The Power Generation Carbon Capture and Storage Market features include Aker Solutions, Dakota Gasification Company, Equinor ASA, Exxon Mobil Corporation, Fluor Corporation, General Electric, Global Thermostat, Halliburton, Linde plc, and Mitsubishi Heavy Industries Ltd. The Power Generation Carbon Capture and Storage Market is shaped by intense competition driven by technological innovation, cost optimization, and large-scale project execution. Companies focus on developing advanced capture methods that improve efficiency and reduce energy penalties, while also investing in integrated transportation and storage solutions. Strategic partnerships between technology providers, utilities, and governments strengthen market presence and accelerate deployment of commercial-scale projects. Competitive dynamics emphasize the ability to deliver reliable systems that meet strict environmental regulations while aligning with global decarbonization targets. Success in this market depends on continuous research, operational expertise, and the capacity to scale solutions across diverse energy and industrial applications.
Recent Developments
- In April 2025, Aker Solutions secured a contract with Equinor ASA to provide engineering and supply services for Norway's Northern Lights carbon capture and storage (CCS) project. This project aims to capture carbon dioxide (CO2) from power plants and industries, then transport and store it underground.
- In February 2024, Fluor Corporation received a contract to design the integration of carbon capture technology into a coal-fired power plant for a U.S. utility company. The project uses Fluor’s technology to capture 95% of CO2 emissions, with plans for permanent underground storage.
- In March 2023, General Electric (GE) announced a partnership with Svante Technologies to create and use advanced carbon capture solutions for gas-fired power plants. This partnership combines GE’s expertise in gas turbines with Svante’s CO2 capture technology, aiming to cut emissions.
Report Coverage
The research report offers an in-depth analysis based on Product, Service, Application and Geography. It details leading market players, providing an overview of their business, product offerings, investments, revenue streams, and key applications. Additionally, the report includes insights into the competitive environment, SWOT analysis, current market trends, as well as the primary drivers and constraints. Furthermore, it discusses various factors that have driven market expansion in recent years. The report also explores market dynamics, regulatory scenarios, and technological advancements that are shaping the industry. It assesses the impact of external factors and global economic changes on market growth. Lastly, it provides strategic recommendations for new entrants and established companies to navigate the complexities of the market.
Future Outlook
- The market will expand with stronger government mandates on emission reductions across power generation.
- Investments will rise in large-scale CCS clusters that integrate capture, transportation, and storage networks.
- Technological innovation will enhance capture efficiency and reduce energy penalties in new systems.
- Power plants will increasingly retrofit existing facilities with CCS to meet decarbonization targets.
- Partnerships between energy companies and technology providers will accelerate global project development.
- Utilization of captured CO₂ in fuels, chemicals, and enhanced oil recovery will create new revenue streams.
- Developing economies will adopt CCS to balance energy demand with climate commitments.
- International collaboration will grow to establish shared infrastructure and cross-border storage solutions.
- Digital monitoring and predictive analytics will improve operational reliability of capture and storage sites.
- The market will strengthen its role as a key enabler of net-zero strategies in the energy transition.

Request a Free Sample
Fill in your details and we'll send you a free sample report.
- Sample data tables & charts
- Research methodology
Need a Custom Version of This Report?
Tailor the scope, geography, or segments to your exact requirements.
- Custom geography or segment scope
- Direct access to our analyst team
Frequently Asked Questions
What is the current market size for Power Generation Carbon Capture and Storage Market, and what is its projected size in 2032?
Which Power Generation Carbon Capture and Storage Market segment held the largest share in 2024?
What are the primary factors fueling the growth of the Power Generation Carbon Capture and Storage Market?
Who are the leading companies in the Power Generation Carbon Capture and Storage Market?
Table of Content
Chapter 1. Report Introduction
- 1.1 Report Description & Purpose
- 1.1.1 Report Title & Market Definition
- 1.1.2 Unique Selling Propositions (USP) & Key Differentiators
- 1.1.3 Value Proposition for Stakeholders
- 1.2 Research Objectives
- 1.2.1 Market Sizing Objectives (Volume & Revenue) (Volume Where Applicable)
- 1.2.2 Segmentation Objectives
- 1.2.3 Competitive Intelligence Objectives
- 1.2.4 Forecast & Scenario Objectives
- 1.3 Report Scope
- 1.3.1 Power Generation Carbon Capture and Storage Scope – Segments & Subsegments Covered
- 1.3.2 Geographic Scope – Regions & Countries Covered
- 1.3.3 Historical Period, Base Year & Forecast Period (2024; forecast to 2032)
- 1.3.4 Inclusions & Exclusions
- 1.4 Industry Classification & Applicable Codes
- 1.5 Currency, Measurement Units & Valuation Basis
- 1.6 Target Stakeholders
- 1.7 Limitations & Assumptions
Chapter 2. Executive Summary
- 2.1 Global Power Generation Carbon Capture and Storage Market Snapshot
- 2.1.1 Market Size – Historical (2024) & Forecast (2024-2032) (2024: USD 3.15 billion → 2032: USD 14.47 billion)
- 2.1.2 Volume & Revenue – Global Totals (Volume Where Applicable)
- 2.1.3 Key Market Highlights – Top Five Facts
- 2.2 Power Generation Carbon Capture and Storage Market Segmentation Snapshot
- 2.2.1 Market Split by Region – 2024 vs. 2032
- 2.3 Competitive Snapshot
- 2.3.1 Top 10 Players by Revenue Share – 2024
- 2.3.2 Top 10 Players by Volume Share – 2024 (Volume Where Applicable)
- 2.3.3 Recent Strategic Developments (18-Month Summary)
- 2.4 Key Investment Highlights & Strategic Conclusions
Chapter 3. Power Generation Carbon Capture and Storage Market Dynamics & Industry Analysis
- 3.1 Market Overview & Context
- 3.1.1 Power Generation Carbon Capture and Storage Market Position in the Broader Industry Value Chain
- 3.1.2 Demand Structure & Purchasing Dynamics
- 3.1.3 Market Maturity & Development Stage by Region
- 3.2 Power Generation Carbon Capture and Storage Market Drivers
- 3.3 Power Generation Carbon Capture and Storage Market Restraints & Challenges
- 3.4 Power Generation Carbon Capture and Storage Market Opportunities
- 3.5 Porter's Five Forces Analysis
- 3.5.1 Threat of New Entrants
- 3.5.2 Bargaining Power of Suppliers
- 3.5.3 Bargaining Power of Buyers
- 3.5.4 Threat of Substitutes
- 3.5.5 Competitive Rivalry – Intensity Assessment
- 3.6 Power Generation Carbon Capture and Storage Value Chain Analysis
- 3.6.1 Upstream – Key Inputs, Resources & Suppliers
- 3.6.1.1 Key Input/Resource 1
- 3.6.1.2 Key Input/Resource 2
- 3.6.1.3 Key Input/Resource 3
- 3.6.2 Midstream – Core Operations & Value Creation
- 3.6.2.1 Operating Model & Process Overview
- 3.6.2.2 Key Operating Locations & Capabilities by Company
- 3.6.3 Downstream – Market Channels & End Users
- 3.6.3.1 Direct Sales & Customer Engagement Channels
- 3.6.3.2 Indirect Sales, Intermediaries & Partner Channels
- 3.6.4 Value Chain Profitability Analysis
- 3.6.1 Upstream – Key Inputs, Resources & Suppliers
- 3.7 PESTEL Analysis
- 3.7.1 Political Factors
- 3.7.2 Economic Factors
- 3.7.3 Social Factors
- 3.7.4 Technological Factors
- 3.7.5 Environmental Factors
- 3.7.6 Legal Factors
- 3.8 Power Generation Carbon Capture and Storage Supply Chain Analysis
- 3.8.1 Critical Input & Resource Availability Risk Assessment
- 3.8.2 Supplier & Operational Concentration Risk (Geographic Exposure)
- 3.8.3 Supply & Service Disruption Impact Analysis
- 3.9 Regulatory & Policy Landscape
Note: The regulatory and policy landscape section covers regulations based on their applicability to the market, Power Generation Carbon Capture and Storage category, geography, and scope of the study. Only regulatory frameworks with a material impact on operations, compliance, trade, sustainability, or market access are analyzed in detail.
Chapter 4. Key Investment Pockets & Opportunity Analysis
- 4.1 Power Generation Carbon Capture and Storage Market Attractiveness Analysis
- 4.1.1 By Region – Investment Attractiveness Matrix (Market Size × CAGR)
- 4.2 Absolute Revenue Growth Opportunity
- 4.2.1 By Region – Absolute Revenue Growth Through 2032
- 4.3 Incremental Demand Opportunity
- 4.3.1 By Region – Incremental Demand Through 2032
- 4.3.2 Segment – Incremental Demand
- 4.4 Emerging Submarket Opportunity Deep Dive (Subject to Applicability)
- 4.5 Priority Market Opportunity Scorecards
- 4.5.1 United States
- 4.5.2 Europe
- 4.5.3 Asia
- 4.5.4 Middle East & Africa
Note: Priority market opportunity scorecards reflect the geographic scope and strategic relevance of the study. Listed markets are indicative and may be adapted to the industry.
Chapter 5. Power Generation Carbon Capture and Storage Cross-Border Trade & Market Access Analysis
- 5.1 International Trade & Cross-Border Activity Overview
- 5.1.1 Global Export Value by Country (2024)
- 5.1.2 Global Export Volume by Country (2024) (Volume Where Applicable)
- 5.1.3 Global Import Value by Country (2024)
- 5.1.4 Global Import Volume by Country (2024) (Volume Where Applicable)
- 5.1.5 Net Trade Balance by Country (2024)
- 5.2 Export Analysis – Segment
- 5.2.1 Category 1 (Applicable Classification Code)
- 5.2.2 Category 2 (Applicable Classification Code)
- 5.2.3 Category 3 (Applicable Classification Code)
- 5.2.4 Category 4 (Applicable Classification Code)
- 5.2.5 Category 5 (Applicable Classification Code)
- 5.3 Import Analysis – Segment
- 5.3.1 Category 1 (Applicable Classification Code)
- 5.3.2 Category 2 (Applicable Classification Code)
- 5.3.3 Category 3 (Applicable Classification Code)
- 5.3.4 Category 4 (Applicable Classification Code)
- 5.3.5 Category 5 (Applicable Classification Code)
- 5.4 Cross-Border Pricing & Transaction Benchmarks
- 5.4.1 Export Pricing – Segment & Country
- 5.4.2 Import Pricing – Segment & Source Country
- 5.4.3 Price Trends (2024)
- 5.5 Key Cross-Border Trade & Delivery Routes
- 5.5.1 Cross-Border Trade/Delivery Route 1
- 5.5.2 Cross-Border Trade/Delivery Route 2
- 5.5.3 Cross-Border Trade/Delivery Route 3
- 5.5.4 Cross-Border Trade/Delivery Route 4
- 5.5.5 Cross-Border Trade/Delivery Route 5
- 5.6 Trade Policy & Market Access Impact Assessment
- 5.6.1 Tariff & Non-Tariff Barriers
- 5.6.2 Regional Trade & Economic Integration Frameworks
- 5.6.3 Bilateral & Multilateral Trade Agreements
- 5.6.4 Cross-Border Operating, Licensing & Localization Requirements
Note: This chapter applies where cross-border trade or delivery is relevant to Power Generation Carbon Capture and Storage. Goods, services, and digital offerings are assessed using applicable classifications and transaction measures. Import-export volumes, trade balances, and route analyses are included only where meaningful to the market.
Chapter 6. Competitive Landscape & Company Benchmarking
- 6.1 Power Generation Carbon Capture and Storage Market Concentration & Structure
- 6.1.1 Herfindahl-Hirschman Index (HHI) – vs. 2024
- 6.1.2 Leading, Mid-Sized & Emerging Player Structure
- 6.1.3 Global, Regional & Local Player Dynamics
- 6.2 Power Generation Carbon Capture and Storage Market Share Analysis – 2024
- 6.2.1 Global Revenue Share by Company
- 6.2.2 Global Volume Share by Company (Volume Where Applicable)
- 6.2.3 Regional Revenue Share
- 6.2.4 Market Share Evolution ( vs. 2024)
- 6.2.5 Company Market Share by Key Segment
- 6.2.6 Company Market Share by Customer Group
- 6.3 Operating Scale, Capacity & Infrastructure Analysis
- 6.3.1 Global Operating Scale & Supply Capacity
- 6.3.2 Resource Utilization & Operating Efficiency
- 6.3.3 Output, Service Delivery & Activity Metrics
- 6.3.4 Operating Footprint & Infrastructure Map
- 6.3.5 Planned Operational & Capacity Expansion
- 6.4 Power Generation Carbon Capture and Storage Competitive Benchmarking Matrix
- 6.4.1 Revenue, Growth, Profitability & Operating Metric Comparison
- 6.4.2 Channel Revenue Mix
- 6.4.3 Geographic Revenue Exposure
- 6.4.4 R&D Intensity
- 6.4.5 Sustainability Maturity
- 6.5 Strategic Developments in Power Generation Carbon Capture and Storage (Last 24 Months)
- 6.5.1 Mergers, Acquisitions & Divestments
- 6.5.2 New Products, Services & Solutions in Power Generation Carbon Capture and Storage
- 6.5.3 Operational & Infrastructure Expansions
- 6.5.4 Strategic Alliances, Joint Ventures & Partnerships
- 6.5.5 Distribution Expansion & Market Entry
- 6.5.6 Sustainability & ESG Initiatives
- 6.6 Competitive Strategy Mapping
- 6.6.1 Leader, Challenger, Follower & Niche Classification
- 6.6.2 Pricing Strategy Comparison
- 6.6.3 Channel Strategy Matrix
Note: Strategic developments are included based on their materiality and the availability of reliable information.
Chapter 7. Global Power Generation Carbon Capture and Storage Market – By Sales & Delivery Channel
- 7.1 Segment Overview
- 7.1.1 Volume & Revenue Split by Channel (2024 & 2032) (Volume Where Applicable)
- 7.1.2 Channel Mix Evolution (2024-2032)
Chapter 8. Regional Market Analysis – Global Overview
- 8.1 Global Regional Overview
- 8.1.1 Regional Volume Share (Volume Where Applicable)
- 8.1.2 Regional Revenue Share
- 8.1.3 Regional Volume by Region (Volume Where Applicable)
- 8.1.4 Regional Revenue by Region
- 8.1.5 Regional Forecast Through 2032
- 8.2 Cross-Regional Segment Analysis
- 8.2.1 By Sales & Delivery Channel
- 8.2.2 By Competitive Positioning & Price Tier
Chapter 9. North America Power Generation Carbon Capture and Storage Market
- 9.1 United States
- 9.2 Canada
- 9.3 Mexico
Chapter 10. Europe Power Generation Carbon Capture and Storage Market
- 10.1 Germany
- 10.2 France
- 10.3 Italy
- 10.4 United Kingdom
- 10.5 Spain
- 10.6 Poland
- 10.7 Russia
- 10.8 Netherlands
- 10.9 Belgium
- 10.10 Sweden
- 10.11 Denmark
- 10.12 Norway
- 10.13 Rest of Europe
Chapter 11. Asia Pacific Power Generation Carbon Capture and Storage Market
- 11.1 China
- 11.2 India
- 11.3 Japan
- 11.4 South Korea
- 11.5 Thailand
- 11.6 Indonesia
- 11.7 Vietnam
- 11.8 Malaysia
- 11.9 Australia
- 11.10 Rest of Asia Pacific
Chapter 12. Latin America Power Generation Carbon Capture and Storage Market
- 12.1 Brazil
- 12.2 Argentina
- 12.3 Colombia
- 12.4 Chile
- 12.5 Rest of Latin America
Chapter 13. Middle East Power Generation Carbon Capture and Storage Market
- 13.1 Saudi Arabia
- 13.2 United Arab Emirates
- 13.3 Turkey
- 13.4 Israel
- 13.5 Iran
- 13.6 Rest of the Middle East
Chapter 14. Africa Power Generation Carbon Capture and Storage Market
- 14.1 South Africa
- 14.2 Egypt
- 14.3 Nigeria
- 14.4 Morocco
- 14.5 Rest of Africa
Chapter 15. Power Generation Carbon Capture and Storage Company Profiles
- 15.1 [Company 01]
- 15.1.1 Company Overview
- 15.1.2 Key Management Personnel
- 15.1.3 Products & Services Portfolio
- 15.1.4 Financial Performance
- 15.1.5 Key Market Focus & Geographic Presence
- 15.1.6 Recent Developments & Strategic Initiatives
Note: The company profile list is preliminary and may change based on research findings, market developments, data availability, and client requirements.
Chapter 16. Appendices
- Appendix A – List of Abbreviations & Acronyms
- Appendix B – Industry Classification Code Reference – Full Series
- Appendix C – Supply, Output & Operating Capacity Data Tables
- Appendix D – End-Use & Demand Base Tables
- Appendix E – Demand, Adoption & Usage Assumptions
- Appendix F – Pricing & Revenue Metric Reference Tables
- Appendix G – Company Operations & Infrastructure Database
- Appendix H – Cross-Border Trade & Activity Data Tables (Where Applicable)
- Appendix I – Regulatory Summary Tables
- Appendix J – Primary Research Participant List (Anonymized)
- Appendix K – Primary Research Questionnaire Framework
- Appendix L – Data Sources & Bibliography
- Appendix M – Market Size Divergence & Source Comparison
Chapter 17. Research Methodology
- 17.1 Research Framework & Philosophy
- 17.2 Secondary Research – Sources, Hierarchy & Data Extraction
- 17.3 Data Modeling – Bottom-Up & Top-Down Market Sizing
- 17.4 Primary Research – Stakeholder Framework, LOI & Sample Sizes
- 17.5 Forecast Methodology – Regression, Scenario & Sensitivity Analysis
- 17.6 Quality Control – Four-Layer Validation Framework
- 17.7 Limitations & Standard Assumptions
- 17.8 Disclaimer
