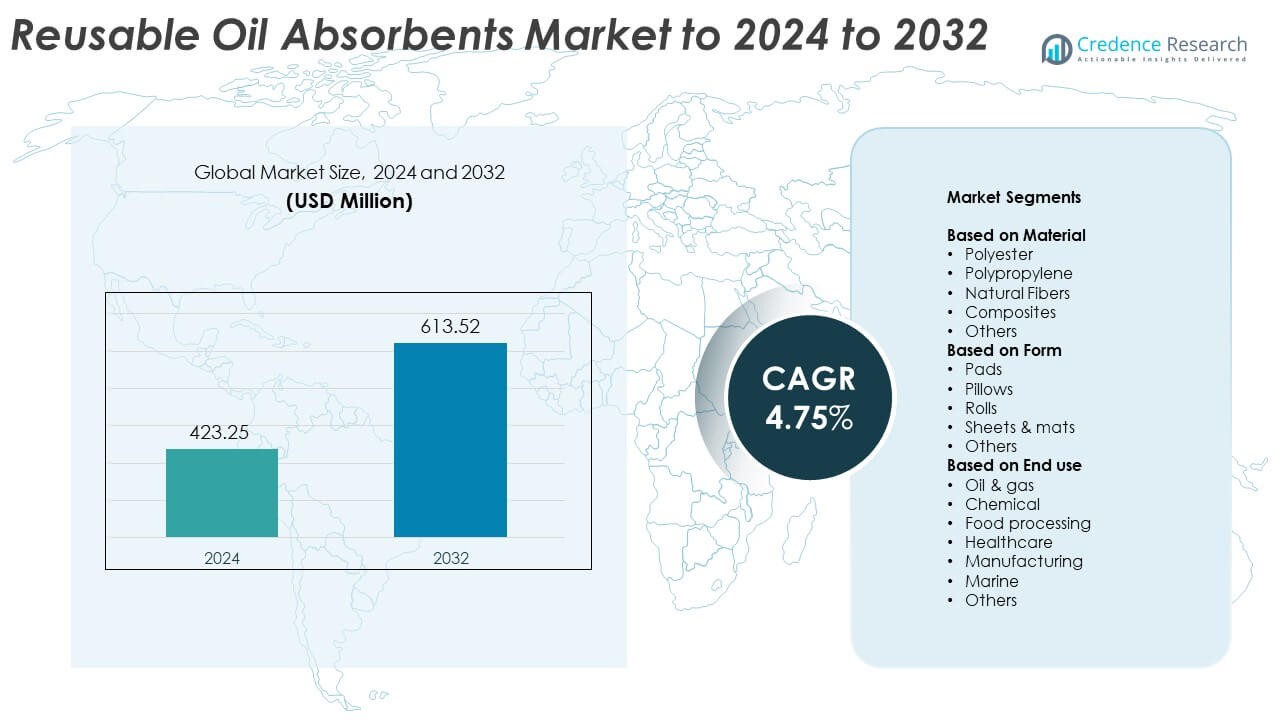
Home » Energy » Reusable Oil Absorbents Market

Reusable Oil Absorbents Market By type (Oil Absorbent Mats, Oil Absorbent Pads, Absorbent Socks, Absorbent Cushion, Absorbent Rolls, Absorbent Booms, Wet Mops) By Material type (Organic, Inorganic, Synthetic) By Application (Oil & Gas, Food & Beverage, Chemicals) By End-use (Residential, Industrial) – Growth, Future Prospects & Competitive Analysis, 2016 – 2028

Price: $4999

Published: | Report ID: 9544 | Report Format : PDF

About this report

The Global Reusable Oil Absorbents market report explores the critical analysis of the industry using key parameters. The report consists of investment strategies, the need for investments in the Global Reusable Oil Absorbents market industry, and the multiple benefits for the investors. Importantly, this report sets out major changes in the global technical regulations for the Global Reusable Oil Absorbents market industry, as well as how economic and non-economic barriers are helping the Global Reusable Oil Absorbents market grow. Moreover, the report analyses the global, regional, and country-level historic and forecasted market size. The report also provides a comprehensive analysis of key investment propositions, demand and supply gap, competitors positioning, STAR analysis, SRC analysis, and Tornado analysis. Key technological developments and other analyses such as porter’s five forces analysis, PESTEL analysis, value chain analysis, etc.

Energy

Key Highlights of the report

How are the major segments performing in the Global Reusable Oil Absorbents Market?

  • In 2021, absorbent mats were a leading segment, dominating the market’s largest share of reusable oil absorbents. It is made from superabsorbent polymers, which can retain their water weight frequently.
  • In 2021, the synthetic segment dominated the global reusable oil absorbent market due to its substantial use in numerous process industries. Furthermore, the rising investment in industrial processes drives growth in the global reusable oil absorbents market.
  • In 2021, the Oil & gas segment dominated the market as it is budget-friendly, which drives the growth of this market.
  • In 2021, the industrial segment captured the largest market share as it helped contain environmental hazards.

Which Region dominated the Global Reusable Oil Absorbents Market?

Asia Pacific region held the majority in the global reusable oil absorbents market in 2021. The increasing population, mostly in such countries as India, china, japan and others. Rapid industrial development and the increasing number of products are expected to increase demand in emerging economies in the Asia Pacific region. The Asia Pacific has seen growth in increasing demand for Absorbent pads, absorbent mats and absorbent rolls. Furthermore, the reusable oil absorbents market in the Asia-Pacific region offers various opportunities for suppliers and manufacturers. In the Asia Pacific, the growing demand for oil & gas industries and food & beverages is expected to grow the Asia Pacific reusable oil absorbents market.

Design Element 2

Access crucial information at unmatched prices!

Request your free sample report today & start making informed decisions powered by Credence Research!

Download Free Sample
CTA Design Element 3

What is the competitive environment of the Global Reusable Oil Absorbents Market?

The competitive environment of the reusable oil absorbents industry provides information on total economic profit made by suppliers and businesses, sales and revenues produced in this sector, global reusable oil absorbents market share, business organization overview, the introduction of new products, and opportunities for the industrial reusable oil absorbents market. Furthermore, corporations are pouring money into research on reusable oil absorbents.

Executive Summary

What developments are being developed in the Global Reusable Oil Absorbents Market?

New opportunities in the reusable oil absorbent market are based on advances in absorbent material science. As materials science advances, industrial companies may have access to reusable oil absorbents with exceptional performance. A few recent multidimensional studies support this trend. One worthy of notice is the work of Argonne National Laboratory researchers who created Oleo Sponge, a polymeric foam. The industry was drawn to its absorbability of 90 times its weight and reusability in applications up to 100 times. Such research paved the way for new avenues of innovation in the reusable oil absorbent market.

Which are the key investments in the Global Reusable Oil Absorbents Market?

Reusable oil absorbents have been used in various industries due to their exceptional flexibility and capacity to be adaptable in any setting. Various investments are made among the key player.

Some of the major players in the market are Closed Loop Recycling, ITU AbsorbTech, Inc, Global Spill Control, Brent Industries, Inc., US Sorbents, Inc., TEXTILE ABSORBENT PRODUCTS CO. LLC, New Pig Corporation, VJ Engineering Solutions Sdn. Bhd., Kimberly-Clark Worldwide, Inc., ZHEJIANG JEENOR NEW MATERIAL CO., LTD, LPT SYSTEMS, Pigmalion Environmental INC., ACME Environmental, Elastec, and Ktech.

What are the Major Driving Factors for the Global Reusable Oil Absorbents Market?

Increasing industrialization is the major factor in the reusable oil absorbent market expansion. Rapid globalization and increasing industrial development are also growing the demand for reusable oil absorbents. The increasing demand for food & beverages, chemicals, oil & gas and other applications propels the market growth. Furthermore, reusable oil absorbents are cost-effective and can be reused, which is also the growth of this market. Additionally, investments made by the government and various development in this sector are expected to grow in the reusable oil absorbents market. Apart from this, the different benefits of reusable oil absorbents, such as non-toxic and non-leaching water, are expected to drive the global reusable oil absorbents market in the Asia-Pacific region

What are the Major Risks for the Global Reusable Oil Absorbents Market?

The lack of awareness of different applications is the major restraint of the Reusable Oil Absorbents market. Moreover, synthetic fibers oil absorbents are less effective on medium oils, another major factor restraining the growth of the global reusable oil absorbents market. Furthermore, a few industries do not use oil absorbents in the workplace, hampering market growth. The strict government regulation on various raw materials is expected to hamper the market growth. Additionally, the pandemic may hamper this market from growing in global markets.

Which is the key End Use in the Market Global Reusable Oil Absorbents Market

The End-use segment is classified into Residential and Industrial. The Industrial segment dominates the largest share in the Reusable Oil Absorbents market because it is one of the major applications where reusable oil absorbents are used, which is expected to grow the Reusable Oil Absorbents market. Furthermore, it helps contain environmental hazards and prevent damage to the environment by disposing of off-hazard substances and any leakage that occurs during transportation. Moreover, the residential segment is expected to dominate the market during the forecast period due to rising demand for end-use industries such as automotive and others.

How is the Global Reusable Oil Absorbents Market performing in regions?

Asia Pacific region held the majority in the global reusable oil absorbents market in 2021. The increasing population, mostly in such countries as India, china, japan and others. Rapid industrial development and the increasing number of products are expected to increase demand in emerging economies in the Asia Pacific region. The Asia Pacific has seen growth in increasing demand for Absorbent pads, absorbent mats and absorbent rolls. Furthermore, the reusable oil absorbents market in the Asia-Pacific region offers various opportunities for suppliers and manufacturers. In the Asia Pacific, the growing demand for oil & gas industries and food & beverages is expected to grow the Asia Pacific reusable oil absorbents market.

In the reusable oil absorbents market, the North American region is anticipated to grow with a substantial CAGR during the forecast period due to the increasing demand for absorbent mats and pads, which is expected to grow. Furthermore, the companies have invested in reusable oil absorbents in North America to manage their operations and may be sold to the profitable market. Furthermore, technological advancement and novel strategies are driving market expansion in North America.

What is the regulatory landscape for the Global Reusable Oil Absorbents Market?

Globally governments are exploring a stricter regulatory approach across regions. Many countries’ governments are planning to apply strict regulations on carbon emissions and old oil absorbents, which cause harmful events in warehouses and other public-private premises. Besides, the government supports using reusable oil absorbents in autonomous and electric-powered vehicles and machines due to their efficiency.

What is the Market Size of Global Reusable Oil Absorbents regarding value?

The global reusable oil absorbents market is anticipated to grow at a substantial CAGR of XX in the upcoming years. The global reusable oil absorbents market was estimated to be worth USD XX million in 2021 and is expected to be worth USD XX million by 2028.

Shape Your Report to Specific Countries or Regions & Enjoy 30% Off!

What are the major players planning for the future of the Global Reusable Oil Absorbents Market?

The key players in the reusable oil absorbents market are investing heavily in numerous research activities and others. Furthermore, future scenarios imply that well-known market players would invest significantly in startups and medium-sized enterprises to treat the sector successfully. Large players must acquire and collaborate with startups to achieve a competitive advantage

Segmentation of Global Reusable Oil Absorbents Market-

Global Reusable Oil Absorbents market– By type

  • Oil Absorbent Mats
  • Oil Absorbent Pads
  • Absorbent Socks
  • Absorbent Cushion
  • Absorbent Rolls
  • Absorbent Booms
  • Wet Mops

 Global Reusable Oil Absorbents market– By Material type

  • Organic
  • Inorganic
  • Synthetic

Global Reusable Oil Absorbents Market– By Application

  • Oil & Gas
  • Food & Beverage
  • Chemicals

Global Reusable Oil Absorbents market– By End-use

  • Residential
  • Industrial

 Global Reusable Oil Absorbents Market– By Region

  • North America
    • U.S.
    • Canada
  • Europe
    • Germany
    • France
    • U.K.
    • Italy
    • Spain
    • Rest of Europe
  • Asia Pacific
    • China
    • Japan
    • India
    • South Korea
    • South-east Asia
    • Rest of Asia Pacific
  • Latin America
    • Brazil
    • Mexico
    • Rest of Latin America
  • Middle East & Africa
    • GCC Countries
    • South Africa
    • Rest of Middle East and Africa

1. Preface
1.1. Report Description
1.1.1. Purpose of the Report
1.1.2. Target Audience
1.1.3. USP and Key Offerings
1.2. Research Scope
1.3. Research Methodology
1.3.1. Phase I – Secondary Research
1.3.2. Phase II – Primary Research
1.3.3. Phase III – Expert Panel Review
1.3.4. Approach Adopted
1.3.4.1. Top-Down Approach
1.3.4.2. Bottom-Up Approach
1.3.5. Assumptions
1.4. Market Segmentation

2. Executive Summary
2.1. Market Snapshot: Global Reusable Oil Absorbents Market
2.2. Global Reusable Oil Absorbents Market, By Type
2.3. Global Reusable Oil Absorbents Market, By Material
2.4. Global Reusable Oil Absorbents Market, By Application
2.5. Global Reusable Oil Absorbents Market, By End Use
2.6. Global Reusable Oil Absorbents Market, By Region

3. Market Dynamics & Factors Analysis
3.1. Introduction
3.1.1. Global Reusable Oil Absorbents Market Value, 2016-2028, (US$ Bn)
3.2. Market Dynamics
3.2.1. Key Growth Trends
3.2.2. Market Drivers
3.2.3. Market Restraints
3.2.4. Market Opportunities
3.2.5. Major Industry Challenges
3.3. Attractive Investment Proposition,2021
3.3.1. Type
3.3.2. Material
3.3.3. Application
3.3.4. End Use
3.3.5. Geography

4. Premium Insights
4.1. STAR (Situation, Task, Action, Results) Analysis
4.2. Porter’s Five Forces Analysis
4.2.1. Threat of New Entrants
4.2.2. Bargaining Power of Buyers/Consumers
4.2.3. Bargaining Power of Suppliers
4.2.4. Threat of Substitute Types
4.2.5. Intensity of Competitive Rivalry
4.3. Value Chain Analysis
4.4. Technology Analysis
4.5. Marketing Strategy Analysis
4.5.1. Direct Marketing
4.5.2. Indirect Marketing
4.5.3. Marketing Channel Development Trend

5. Market Positioning of Key Players, 2021
5.1. Company market share of key players, 2021
5.2. Competitive Benchmarking
5.3. Market Positioning of Key Vendors
5.4. Geographical Presence Analysis
5.5. Major Strategies Adopted By Key Players
5.5.1. Key Strategies Analysis
5.5.2. Mergers and Acquisitions
5.5.3. Partnerships
5.5.4. Product Launch
5.5.5. Geographical Expansion
5.5.6. Absorbent Cushion

6. COVID 19 Impact Analysis
6.1. Global Reusable Oil Absorbents Market Pre Vs Post COVID 19, 2019 – 2028
6.2. Impact on Import & Export

6.3. Impact on Demand & Supply
7. Global Reusable Oil Absorbents Market
7.1. Global Reusable Oil Absorbents Market, By Type, 2016-2028(US$ Bn)
7.1.1. Overview
7.1.2. Global Reusable Oil Absorbents market, By Type, 2021 vs 2028 (in%)
7.1.3. Global Reusable Oil Absorbents Market, By Oil Absorbent Mats, 2016-2028 (US$ Bn)
7.1.4. Global Reusable Oil Absorbents Market, By Oil Absorbent Pads, 2016-2028 (US$ Bn)
7.1.5. Global Reusable Oil Absorbents Market, By Absorbent Socks, 2016-2028 (US$ Bn)
7.1.6. Global Reusable Oil Absorbents Market, By Absorbent Cushion, 2016-2028 (US$ Bn)
7.1.7. Global Reusable Oil Absorbents Market, By Absorbent Rolls, 2016-2028 (US$ Bn)
7.1.8. Global Reusable Oil Absorbents Market, By Absorbent Booms, 2016-2028 (US$ Bn)
7.1.9. Global Reusable Oil Absorbents Market, By Wet Mops, 2016-2028 (US$ Bn)

1.1. Global Reusable Oil Absorbents Market, By Material, 2016-2028(US$ Bn)
1.1.1. Overview
1.1.2. Global Reusable Oil Absorbents Market, By Organic, 2021 vs 2028 (in%)
1.1.3. Global Reusable Oil Absorbents Market, By Inorganic, 2016-2028 (US$ Bn)
1.1.4. Global Reusable Oil Absorbents Market, By Synthetic, 2016-2028 (US$ Bn)
1.1. Global Reusable Oil Absorbents Market, By Application, 2016-2028 (US$ Bn)
1.1.1. Overview
1.1.2. Global Reusable Oil Absorbents Market, By Oil & Gas, 2021 vs 2028 (in%)
1.1.3. Global Reusable Oil Absorbents Market, By Food & Beverage, 2016-2028 (US$ Bn)
1.1.4. Global Reusable Oil Absorbents Market, By Chemicals, 2016-2028 (US$ Bn)
1.2. Global Reusable Oil Absorbents Market, By End Use, 2016-2028(US$ Bn)
1.2.1. Overview
1.2.2. Global Reusable Oil Absorbents Market, By Residential, 2021 vs 2028 (in%)
1.2.3. Global Reusable Oil Absorbents Market, By Industrial, 2016-2028 (US$ Bn)
1. North America Reusable Oil Absorbents Market Analysis
1.1. North America Reusable Oil Absorbents Market By Type, 2016-2028(US$ Bn)
1.1.1. Overview
1.1.2. SRC Analysis
1.2. North America Reusable Oil Absorbents Market By Material, 2016-2028(US$ Bn)
1.2.1. Overview
1.1. SRC Analysis
1.2. North America Reusable Oil Absorbents Market By Application, 2016-2028(US$ Bn)
1.2.1. Overview
1.1. SRC Analysis
1.2. North America Reusable Oil Absorbents Market By End Use, 2016-2028(US$ Bn)
1.2.1. Overview
1.3. SRC Analysis
1.4. North America Reusable Oil Absorbents Market By Country, 2016-2028 (US$ Bn)
1.4.1. U.S.
1.4.1.1. U.S. Reusable Oil Absorbents Market Estimates and Forecast, 2016-2028 (US$ Bn)
1.4.1.2. U.S. Reusable Oil Absorbents By Type, 2016-2028 (US$ Bn)
1.4.1.3. U.S. Reusable Oil Absorbents By Material, 2016-2028 (US$ Bn)
1.4.1.4. U.S. Reusable Oil Absorbents By Application, 2016-2028 (US$ Bn)
1.4.1.5. U.S. Reusable Oil Absorbents By End Use, 2016-2028 (US$ Bn)
1.4.1.6. Canada
1.4.1.7. Canada Reusable Oil Absorbents Market Estimates and Forecast, 2016-2028 (US$ Bn)
1.4.1.8. Canada Reusable Oil Absorbents By Type, 2016-2028 (US$ Bn)
1.4.1.9. Canada Reusable Oil Absorbents By Material, 2016-2028 (US$ Bn)
1.4.1.10. Canada Reusable Oil Absorbents By Application, 2016-2028 (US$ Bn)
1.4.1.11. Canada Reusable Oil Absorbents By End Use, 2016-2028 (US$ Bn)
2. Europe Reusable Oil Absorbents Market Analysis
2.1. Europe Reusable Oil Absorbents Market By Type, 2016-2028(US$ Bn)
2.1.1. Overview
2.1.2. SRC Analysis
2.2. Europe Reusable Oil Absorbents Market By Material, 2016-2028(US$ Bn)
2.2.1. Overview
1.1. SRC Analysis
1.2. Europe Reusable Oil Absorbents Market By Application, 2016-2028(US$ Bn)
1.2.1. Overview
1.1. SRC Analysis
1.2. Europe Reusable Oil Absorbents Market By End Use, 2016-2028(US$ Bn)
1.2.1. Overview
1.2.2. SRC Analysis
1.3. Europe Reusable Oil Absorbents Market By Country, 2016-2028 (US$ Bn)
1.3.1. Germany
1.3.1.1. Germany Reusable Oil Absorbents Market Estimates and Forecast, 2016-2028 (US$ Bn)
1.3.1.2. Germany Reusable Oil Absorbents By Type, 2016-2028 (US$ Bn)
1.3.1.3. Germany Reusable Oil Absorbents By Material, 2016-2028 (US$ Bn)
1.3.1.4. Germany Reusable Oil Absorbents By Application, 2016-2028 (US$ Bn)
1.3.1.5. Germany Reusable Oil Absorbents By End Use, 2016-2028 (US$ Bn)
1.3.2. France
1.3.2.1. France Reusable Oil Absorbents Market Estimates and Forecast, 2016-2028 (US$ Bn)
1.3.2.2. France Reusable Oil Absorbents By Type, 2016-2028 (US$ Bn)
1.3.2.3. France Reusable Oil Absorbents By Material, 2016-2028 (US$ Bn)
1.3.2.4. France Reusable Oil Absorbents By Application, 2016-2028 (US$ Bn)
1.3.2.5. France Reusable Oil Absorbents By End Use, 2016-2028 (US$ Bn)
1.3.3. UK
1.3.3.1. UK Reusable Oil Absorbents Market Estimates and Forecast, 2016-2028 (US$ Bn)
1.3.3.2. UK Reusable Oil Absorbents By Type, 2016-2028 (US$ Bn)
1.3.3.3. UK Reusable Oil Absorbents By Material, 2016-2028 (US$ Bn)
1.3.3.4. UK Reusable Oil Absorbents By Application, 2016-2028 (US$ Bn)
1.3.3.5. UK Reusable Oil Absorbents By End Use, 2016-2028 (US$ Bn)
1.3.4. Italy
1.3.4.1. Italy Reusable Oil Absorbents Market Estimates and Forecast, 2016-2028 (US$ Bn)
1.3.4.2. Italy Reusable Oil Absorbents By Type, 2016-2028 (US$ Bn)
1.3.4.3. Italy Reusable Oil Absorbents By Material, 2016-2028 (US$ Bn)
1.3.4.4. Italy Reusable Oil Absorbents By Application, 2016-2028 (US$ Bn)
1.3.4.5. Italy Reusable Oil Absorbents By End Use, 2016-2028 (US$ Bn)
1.3.5. Spain
1.3.5.1. Spain Reusable Oil Absorbents Market Estimates and Forecast, 2016-2028 (US$ Bn)
1.3.5.2. Spain Reusable Oil Absorbents By Type, 2016-2028 (US$ Bn)
1.3.5.3. Spain Reusable Oil Absorbents By Material, 2016-2028 (US$ Bn)
1.3.5.4. Spain Reusable Oil Absorbents By Application, 2016-2028 (US$ Bn)
1.3.5.5. Spain Reusable Oil Absorbents By End Use, 2016-2028 (US$ Bn)
1.3.6. Rest of Europe
1.3.6.1. Rest of Europe Reusable Oil Absorbents Market Estimates and Forecast, 2016-2028 (US$ Bn)
1.3.6.2. Rest of Europe Reusable Oil Absorbents By Type, 2016-2028 (US$ Bn)
1.3.6.3. Rest of Europe Reusable Oil Absorbents By Material, 2016-2028 (US$ Bn)
1.3.6.4. Rest of Europe Reusable Oil Absorbents By Application, 2016-2028 (US$ Bn)
1.3.6.5. Rest of Europe Reusable Oil Absorbents By End Use, 2016-2028 (US$ Bn)
1.4. Asia Pacific Reusable Oil Absorbents Market Analysis
1.5. Asia Pacific Reusable Oil Absorbents Market By Type, 2016-2028(US$ Bn)
1.5.1. Overview
1.5.2. SRC Analysis
1.6. Asia Pacific Reusable Oil Absorbents Market By Material, 2016-2028(US$ Bn)
1.6.1. Overview
1.1. SRC Analysis
1.2. Asia Pacific Reusable Oil Absorbents Market By Application, 2016-2028(US$ Bn)
1.2.1. Overview
1.2.2. SRC Analysis
1.3. Asia Pacific Reusable Oil Absorbents Market By End Use, 2016-2028(US$ Bn)
1.3.1. Overview
1.3.2. SRC Analysis
1.4. Asia Pacific Reusable Oil Absorbents Market By Country, 2016-2028 (US$ Bn)
1.4.1. China
1.4.1.1. China Reusable Oil Absorbents Market Estimates and Forecast, 2016-2028 (US$ Bn)
1.4.1.2. China Reusable Oil Absorbents By Type, 2016-2028 (US$ Bn)
1.4.1.3. China Reusable Oil Absorbents By Material, 2016-2028 (US$ Bn)
1.4.1.4. China Reusable Oil Absorbents By Application, 2016-2028 (US$ Bn)
1.4.1.5. China Reusable Oil Absorbents By End Use, 2016-2028 (US$ Bn)
1.4.2. Japan
1.4.2.1. Japan Reusable Oil Absorbents Market Estimates and Forecast, 2016-2028 (US$ Bn)
1.4.2.2. Japan Reusable Oil Absorbents By Type, 2016-2028 (US$ Bn)
1.4.2.3. Japan Reusable Oil Absorbents By Material, 2016-2028 (US$ Bn)
1.4.2.4. Japan Reusable Oil Absorbents By Application, 2016-2028 (US$ Bn)
1.4.2.5. Japan Reusable Oil Absorbents By End Use, 2016-2028 (US$ Bn)
1.4.3. India
1.4.3.1. India Reusable Oil Absorbents Market Estimates and Forecast, 2016-2028 (US$ Bn)
1.4.3.2. India Reusable Oil Absorbents By Type, 2016-2028 (US$ Bn)
1.4.3.3. India Reusable Oil Absorbents By Material, 2016-2028 (US$ Bn)
1.4.3.4. India Reusable Oil Absorbents By Application, 2016-2028 (US$ Bn)
1.4.3.5. India Reusable Oil Absorbents By End Use, 2016-2028 (US$ Bn)
1.4.4. South Korea
1.4.4.1. South Korea Reusable Oil Absorbents Market Estimates and Forecast, 2016-2028 (US$ Bn)
1.4.4.2. South Korea Reusable Oil Absorbents By Type, 2016-2028 (US$ Bn)
1.4.4.3. South Korea Reusable Oil Absorbents By Material, 2016-2028 (US$ Bn)
1.4.4.4. South Korea Reusable Oil Absorbents By Application, 2016-2028 (US$ Bn)
1.4.4.5. South Korea Reusable Oil Absorbents By End Use, 2016-2028 (US$ Bn)
1.4.5. South-East Asia
1.4.5.1. South-East Asia Reusable Oil Absorbents Market Estimates and Forecast, 2016-2028 (US$ Bn)
1.4.5.2. South-East Asia Reusable Oil Absorbents By Type, 2016-2028 (US$ Bn)
1.4.5.3. South-East Asia Reusable Oil Absorbents By Material, 2016-2028 (US$ Bn)
1.4.5.4. South-East Asia Reusable Oil Absorbents By Application, 2016-2028 (US$ Bn)
1.4.5.5. South-East Asia Reusable Oil Absorbents By End Use, 2016-2028 (US$ Bn)
1.4.6. Rest of Asia Pacific
1.4.6.1. Rest of Asia Pacific Reusable Oil Absorbents Market Estimates and Forecast, 2016-2028 (US$ Bn)
1.4.6.2. Rest of Asia Pacific Reusable Oil Absorbents By Type, 2016-2028 (US$ Bn)
1.4.6.3. Rest of Asia Pacific Reusable Oil Absorbents By Material, 2016-2028 (US$ Bn)
1.4.6.4. Rest of Asia Pacific Reusable Oil Absorbents By Application, 2016-2028 (US$ Bn)
1.4.6.5. Rest of Asia Pacific Reusable Oil Absorbents By End Use, 2016-2028 (US$ Bn)

2. Latin America Reusable Oil Absorbents Market Analysis
2.1. Latin America Reusable Oil Absorbents Market By Type, 2016-2028(US$ Bn)
2.1.1. Overview
2.1.2. SRC Analysis
2.2. Latin America Reusable Oil Absorbents Market By Material, 2016-2028(US$ Bn)
2.2.1. Overview
1.1. SRC Analysis
1.2. Latin America Reusable Oil Absorbents Market By Application, 2016-2028(US$ Bn)
1.2.1. Overview
1.2.2. SRC Analysis
1.3. Latin America Reusable Oil Absorbents Market By End Use, 2016-2028(US$ Bn)
1.3.1. Overview
1.3.2. SRC Analysis
1.4. Latin America Reusable Oil Absorbents Market By Country, 2016-2028 (US$ Bn)
1.4.1. Brazil
1.4.1.1. Brazil Reusable Oil Absorbents Market Estimates and Forecast, 2016-2028 (US$ Bn)
1.4.1.2. Brazil Reusable Oil Absorbents By Type, 2016-2028 (US$ Bn)
1.4.1.3. Brazil Reusable Oil Absorbents By Material, 2016-2028 (US$ Bn)
1.4.1.4. Brazil Reusable Oil Absorbents By Application, 2016-2028 (US$ Bn)
1.4.1.5. Brazil Reusable Oil Absorbents By End Use, 2016-2028 (US$ Bn)
1.4.2. Mexico
1.4.2.1. Mexico Reusable Oil Absorbents Market Estimates and Forecast, 2016-2028 (US$ Bn)
1.4.2.2. Mexico Reusable Oil Absorbents By Type, 2016-2028 (US$ Bn)
1.4.2.3. Mexico Reusable Oil Absorbents By Material, 2016-2028 (US$ Bn)
1.4.2.4. Mexico Reusable Oil Absorbents By Application, 2016-2028 (US$ Bn)
1.4.2.5. Mexico Reusable Oil Absorbents By End Use, 2016-2028 (US$ Bn)
1.4.3. Rest of Latin America
1.4.3.1. Rest of Latin America Reusable Oil Absorbents Market Estimates and Forecast, 2016-2028 (US$ Bn)
1.4.3.2. Rest of Latin America Reusable Oil Absorbents By Type, 2016-2028 (US$ Bn)
1.4.3.3. Rest of Latin America Reusable Oil Absorbents By Material, 2016-2028 (US$ Bn)
1.4.3.4. Rest of Latin America Reusable Oil Absorbents By Application, 2016-2028 (US$ Bn)
1.4.3.5. Rest of Latin America Reusable Oil Absorbents By End Use, 2016-2028 (US$ Bn)

2. Middle East and Africa Reusable Oil Absorbents Market Analysis
2.1. Middle East and Africa Reusable Oil Absorbents Market By Type, 2016-2028(US$ Bn)
2.1.1. Overview
2.1.2. SRC Analysis
2.2. Middle East and Africa Reusable Oil Absorbents Market By Material, 2016-2028(US$ Bn)
2.2.1. Overview
1.1. SRC Analysis
1.2. Middle East and Africa Reusable Oil Absorbents Market By Application, 2016-2028(US$ Bn)
1.2.1. Overview
1.2.2. SRC Analysis
1.3. Middle East and Africa Reusable Oil Absorbents Market By End Use, 2016-2028(US$ Bn)
1.3.1. Overview
1.3.2. SRC Analysis
1.4. Middle East and Africa Reusable Oil Absorbents Market By Country, 2016-2028 (US$ Bn)
1.4.1. GCC Countries
1.4.1.1. GCC Countries il Reusable Oil Absorbents Market Estimates and Forecast, 2016-2028 (US$ Bn)
1.4.1.2. GCC Countries Reusable Oil Absorbents By Type, 2016-2028 (US$ Bn)
1.4.1.3. GCC Countries Reusable Oil Absorbents By Material, 2016-2028 (US$ Bn)
1.4.1.4. GCC Countries Reusable Oil Absorbents By Application, 2016-2028 (US$ Bn)
1.4.1.5. GCC Countries Reusable Oil Absorbents By End Use, 2016-2028 (US$ Bn)
1.4.2. South Africa
1.4.2.1. South Africa Reusable Oil Absorbents Market Estimates and Forecast, 2016-2028 (US$ Bn)
1.4.2.2. South Africa Reusable Oil Absorbents By Type, 2016-2028 (US$ Bn)
1.4.2.3. South Africa Reusable Oil Absorbents By Material, 2016-2028 (US$ Bn)
1.4.2.4. South Africa Reusable Oil Absorbents By Application, 2016-2028 (US$ Bn)
1.4.2.5. South Africa Reusable Oil Absorbents By End Use, 2016-2028 (US$ Bn)
1.4.3. Rest of Middle East and Africa
1.4.3.1. Rest of Middle East and Africa Reusable Oil Absorbents Market Estimates and Forecast, 2016-2028 (US$ Bn)
1.4.3.2. Rest of Middle East and Africa Reusable Oil Absorbents By Type, 2016-2028 (US$ Bn)
1.4.3.3. Rest of Middle East and Africa Reusable Oil Absorbents By Material, 2016-2028 (US$ Bn)
1.4.3.4. Rest of Middle East and Africa Reusable Oil Absorbents By Application, 2016-2028 (US$ Bn)
1.4.3.5. Rest of Middle East and Africa Reusable Oil Absorbents By End Use, 2016-2028 (US$ Bn)

2. Company Profiles
2.1. Siemens (Germany)
2.1.1. Company Overview
2.1.2. Products/Healthcare Portfolio
2.1.3. Geographical Presence
2.1.4. Financial Summary
2.1.4.1. Market Revenue and Net Profit (2019-2021)
2.1.4.2. Business Segment Revenue Analysis
2.1.4.3. Geographical Revenue Analysis
2.2. Closed Loop Recycling
2.3. ITU Absorb Tech, Inc.
2.4. Global Spill Control
2.5. Brent Industries, Inc.
2.6. US Sorbents Inc.
2.7. TEXTILE ABSORBENT PRODUCTS CO. LLC
2.8. New Pig Corporation
2.9. VJ Engineering Solutions Sdn. Bhd.
2.10. Kimberly-Clark Worldwide, Inc.
2.11. ZHEJIANG JEENOR NEW MATERIAL CO, LTD
2.12. LPT SYSTEMS
2.13. Pigmalion Environmental INC.
2.14. ACME Environmental
2.15. Elastec
2.16. Ktech

List of Figures

FIG. 1 Global Reusable Oil Absorbents Market: Research Methodology
FIG. 2 Market Size Estimation – Top Down & Bottom up Approach
FIG. 3 Global Reusable Oil Absorbents Market Segmentation
FIG. 4 Global Reusable Oil Absorbents Market, By Type, 2021 (US$ Bn)
FIG. 5 Global Reusable Oil Absorbents Market, By Material, 2021 (US$ Bn)
FIG. 6 Global Reusable Oil Absorbents Market, By Application, 2021 (US$ Bn)
FIG. 7 Global Reusable Oil Absorbents Market, By End Use, 2021 (US$ Bn)
FIG. 8 Global Reusable Oil Absorbents Market, By Geography, 2021 (US$ Bn)
FIG. 9 Attractive Investment Proposition, By Type, 2021
FIG. 10 Attractive Investment Proposition, By Material, 2021
FIG. 11 Attractive Investment Proposition, By Application, 2021
FIG. 12 Attractive Investment Proposition, By End Use, 2021
FIG. 13 Attractive Investment Proposition, By Geography, 2021
FIG. 14 Global Market Share Analysis of Key Reusable Oil Absorbents Market Manufacturers, 2021
FIG. 15 Global Reusable Oil Absorbents Market Value Contribution, By Type, 2021 & 2028 (Value %)
FIG. 16 Global Reusable Oil Absorbents Market, By Oil Absorbent Mats, Value, 2016-2028 (US$ Bn)
FIG. 17 Global Reusable Oil Absorbents Market, By Oil Absorbent Pads, Value, 2016-2028 (US$ Bn)
FIG. 18 Global Reusable Oil Absorbents Market, By Absorbent Socks, Value, 2016-2028 (US$ Bn)
FIG. 19 Global Reusable Oil Absorbents Market, By Absorbent Cushion, Value, 2016-2028 (US$ Bn)
FIG. 20 Global Reusable Oil Absorbents Market, By Absorbent Rolls, Value, 2016-2028 (US$ Bn)
FIG. 21 Global Reusable Oil Absorbents Market, By Absorbent Booms, Value, 2016-2028 (US$ Bn)
FIG. 22 Global Reusable Oil Absorbents Market, By Wet Mops, Value, 2016-2028 (US$ Bn)
FIG. 23 Global Reusable Oil Absorbents Market Value Contribution, By Material, 2021 & 2028 (Value %)
FIG. 24 Global Reusable Oil Absorbents Market, By Organic, Value, 2016-2028 (US$ Bn)
FIG. 25 Global Reusable Oil Absorbents Market, By Inorganic, Value, 2016-2028 (US$ Bn)
FIG. 26 Global Reusable Oil Absorbents Market, By Synthetic, Value, 2016-2028 (US$ Bn)
FIG. 27 Global Reusable Oil Absorbents Market Value Contribution, By Application, 2021 & 2028 (Value %)
FIG. 28 Global Reusable Oil Absorbents Market, By Oil & Gas, Value, 2016-2028 (US$ Bn)
FIG. 29 Global Reusable Oil Absorbents Market, By Food & Beverage, Value, 2016-2028 (US$ Bn)
FIG. 30 Global Reusable Oil Absorbents Market, By Chemicals, Value, 2016-2028 (US$ Bn)
FIG. 31 Global Reusable Oil Absorbents Market Value Contribution, By End Use, 2021 & 2028 (Value %)
FIG. 32 Global Reusable Oil Absorbents Market, By Residential, Value, 2016-2028 (US$ Bn)
FIG. 33 Global Reusable Oil Absorbents Market, By Industrial, Value, 2016-2028 (US$ Bn)
FIG. 34 U.S.Reusable Oil Absorbents Market 2016-2028 (US$ Bn)
FIG. 35 Canada Reusable Oil Absorbents Market 2016-2028 (US$ Bn)
FIG. 36 Germany Reusable Oil Absorbents Market 2016-2028 (US$ Bn)
FIG. 37 France Reusable Oil Absorbents Market 2016-2028 (US$ Bn)
FIG. 38 U.K.Reusable Oil Absorbents Market 2016-2028 (US$ Bn)
FIG. 39 Italy Reusable Oil Absorbents Market 2016-2028 (US$ Bn)
FIG. 40 Spain Reusable Oil Absorbents Market 2016-2028 (US$ Bn)
FIG. 41 Rest of Europe Reusable Oil Absorbents Market 2016-2028 (US$ Bn)
FIG. 42 China Reusable Oil Absorbents Market 2016-2028 (US$ Bn)
FIG. 43 Japan Reusable Oil Absorbents Market 2016-2028 (US$ Bn)
FIG. 44 India Reusable Oil Absorbents Market 2016-2028 (US$ Bn)
FIG. 45 South Korea Reusable Oil Absorbents Market 2016-2028 (US$ Bn)
FIG. 46 Southeast Asia Reusable Oil Absorbents Market 2016-2028 (US$ Bn)
FIG. 47 Rest of Asia PacificReusable Oil Absorbents Market 2016-2028 (US$ Bn)
FIG. 48 Latin America Reusable Oil Absorbents Market 2016-2028 (US$ Bn)
FIG. 49 Brazil Reusable Oil Absorbents Market 2016-2028 (US$ Bn)
FIG. 50 Mexico Reusable Oil Absorbents Market 2016-2028 (US$ Bn)
FIG. 51 Rest of Latin America Reusable Oil Absorbents Market 2016-2028 (US$ Bn)
FIG. 52 Middle East & Africa Reusable Oil Absorbents Market 2016-2028 (US$ Bn)
FIG. 53 GCC Countries Reusable Oil Absorbents Market 2016-2028 (US$ Bn)
FIG. 54 South Africa Reusable Oil Absorbents Market 2016-2028 (US$ Bn)
FIG. 55 Rest of Middle East and Africa Reusable Oil Absorbents Market 2016-2028 (US$ Bn)

List of Tables

TABLE 1 Market Snapshot: Global Reusable Oil Absorbents Market
TABLE 2 Global Reusable Oil Absorbents Market, By Competitive Benchmarking, 2021
TABLE 3 Global Reusable Oil Absorbents Market, By Geographical Presence Analysis, 2021
TABLE 4 Global Reusable Oil Absorbents Market, By Key Strategies Analysis, 2021
TABLE 5 Global Reusable Oil Absorbents Market, By Type, 2016-2028 (US$ Bn)
TABLE 6 Global Reusable Oil Absorbents Market, By Material, 2016-2028 (US$ Bn)
TABLE 7 Global Reusable Oil Absorbents Market, By Application, 2016-2028 (US$ Bn)
TABLE 8 Global Reusable Oil Absorbents Market, By End Use, 2016-2028 (US$ Bn)
TABLE 9 Global Reusable Oil Absorbents Market, By Geography, 2016-2028 (US$ Bn)
TABLE 10 North America Reusable Oil Absorbents Market By Type, 2016-2028 (US$ Bn)
TABLE 11 North America Reusable Oil Absorbents Market By Material, 2016-2028 (US$ Bn)
TABLE 12 North America Reusable Oil Absorbents Market By Application, 2016-2028 (US$ Bn)
TABLE 13 North America Reusable Oil Absorbents Market By End Use, 2016-2028 (US$ Bn)
TABLE 14 North America Reusable Oil Absorbents Market By Country, 2016-2028 (US$ Bn)
TABLE 15 US Reusable Oil Absorbents Market By Type, 2016-2028 (US$ Bn)
TABLE 16 US Reusable Oil Absorbents Market By Material, 2016-2028 (US$ Bn)
TABLE 17 US Reusable Oil Absorbents Market By Application, 2016-2028 (US$ Bn)
TABLE 18 US Reusable Oil Absorbents Market By End Use, 2016-2028 (US$ Bn)
TABLE 19 Canada Reusable Oil Absorbents Market By Type, 2016-2028 (US$ Bn)
TABLE 20 Canada Reusable Oil Absorbents Market By Material, 2016-2028 (US$ Bn)
TABLE 21 Canada Reusable Oil Absorbents Market By Application, 2016-2028 (US$ Bn)
TABLE 22 Canada Reusable Oil Absorbents Market By End Use, 2016-2028 (US$ Bn)
TABLE 23 Europe Reusable Oil Absorbents Market By Type, 2016-2028 (US$ Bn)
TABLE 24 Europe Reusable Oil Absorbents Market By Material, 2016-2028 (US$ Bn)
TABLE 25 Europe Reusable Oil Absorbents Market By Application, 2016-2028 (US$ Bn)
TABLE 26 Europe Reusable Oil Absorbents Market By End Use, 2016-2028 (US$ Bn)
TABLE 27 Europe Reusable Oil Absorbents Market By Country, 2016-2028 (US$ Bn)
TABLE 28 Germany Reusable Oil Absorbents Market By Type, 2016-2028 (US$ Bn)
TABLE 29 Germany Reusable Oil Absorbents Market By Material, 2016-2028 (US$ Bn)
TABLE 30 Germany Reusable Oil Absorbents Market By Application, 2016-2028 (US$ Bn)
TABLE 31 Germany Reusable Oil Absorbents Market By End Use, 2016-2028 (US$ Bn)
TABLE 32 France Reusable Oil Absorbents Market By Type, 2016-2028 (US$ Bn)
TABLE 33 France Reusable Oil Absorbents Market By Material, 2016-2028 (US$ Bn)
TABLE 34 France Reusable Oil Absorbents Market By Application, 2016-2028 (US$ Bn)
TABLE 35 France Reusable Oil Absorbents Market By End Use, 2016-2028 (US$ Bn)
TABLE 36 UK Reusable Oil Absorbents Market By Type, 2016-2028 (US$ Bn)
TABLE 37 UK Reusable Oil Absorbents Market By Material, 2016-2028 (US$ Bn)
TABLE 38 UK Reusable Oil Absorbents Market By Application, 2016-2028 (US$ Bn)
TABLE 39 UK Reusable Oil Absorbents Market By End Use, 2016-2028 (US$ Bn)
TABLE 40 Italy Reusable Oil Absorbents Market By Type, 2016-2028 (US$ Bn)
TABLE 41 Italy Reusable Oil Absorbents Market By Material, 2016-2028 (US$ Bn)
TABLE 42 Italy Reusable Oil Absorbents Market By Application, 2016-2028 (US$ Bn)
TABLE 43 Italy Reusable Oil Absorbents Market By End Use, 2016-2028 (US$ Bn)
TABLE 44 Spain Reusable Oil Absorbents Market By Type, 2016-2028 (US$ Bn)
TABLE 45 Spain Reusable Oil Absorbents Market By Material, 2016-2028 (US$ Bn)
TABLE 46 Spain Reusable Oil Absorbents Market By Application, 2016-2028 (US$ Bn)
TABLE 47 Spain Reusable Oil Absorbents Market By End Use, 2016-2028 (US$ Bn)
TABLE 48 Rest of Europe Reusable Oil Absorbents Market By Type, 2016-2028 (US$ Bn)
TABLE 49 Rest of Europe Reusable Oil Absorbents Market By Material, 2016-2028 (US$ Bn)
TABLE 50 Rest of Europe Reusable Oil Absorbents Market By Application, 2016-2028 (US$ Bn)
TABLE 51 Rest of Europe Reusable Oil Absorbents Market By End Use, 2016-2028 (US$ Bn)
TABLE 52 Asia Pacific Reusable Oil Absorbents Market By Type, 2016-2028 (US$ Bn)
TABLE 53 Asia Pacific Reusable Oil Absorbents Market By Material, 2016-2028 (US$ Bn)
TABLE 54 Asia Pacific Reusable Oil Absorbents Market By Application, 2016-2028 (US$ Bn)
TABLE 55 Asia Pacific Reusable Oil Absorbents Market By End Use, 2016-2028 (US$ Bn)
TABLE 56 Asia Pacific Reusable Oil Absorbents Market By Country, 2016-2028 (US$ Bn)
TABLE 57 China Reusable Oil Absorbents Market By Type, 2016-2028 (US$ Bn)
TABLE 58 China Reusable Oil Absorbents Market By Material, 2016-2028 (US$ Bn)
TABLE 59 China Reusable Oil Absorbents Market By Application, 2016-2028 (US$ Bn)
TABLE 60 China Reusable Oil Absorbents Market By End Use, 2016-2028 (US$ Bn)
TABLE 61 Japan Reusable Oil Absorbents Market By Type, 2016-2028 (US$ Bn)
TABLE 62 Japan Reusable Oil Absorbents Market By Material, 2016-2028 (US$ Bn)
TABLE 63 Japan Reusable Oil Absorbents Market By Application, 2016-2028 (US$ Bn)
TABLE 64 Japan Reusable Oil Absorbents Market By End Use, 2016-2028 (US$ Bn)
TABLE 65 India Reusable Oil Absorbents Market By Type, 2016-2028 (US$ Bn)
TABLE 66 India Reusable Oil Absorbents Market By Material, 2016-2028 (US$ Bn)
TABLE 67 India Reusable Oil Absorbents Market By Application, 2016-2028 (US$ Bn)
TABLE 68 India Reusable Oil Absorbents Market By End Use, 2016-2028 (US$ Bn)
TABLE 69 South Korea Reusable Oil Absorbents Market By Type, 2016-2028 (US$ Bn)
TABLE 70 South Korea Reusable Oil Absorbents Market By Material, 2016-2028 (US$ Bn)
TABLE 71 South Korea Reusable Oil Absorbents Market By Application, 2016-2028 (US$ Bn)
TABLE 72 South Korea Reusable Oil Absorbents Market By End Use, 2016-2028 (US$ Bn)
TABLE 73 South East Asia Reusable Oil Absorbents Market By Type, 2016-2028 (US$ Bn)
TABLE 74 South East Asia Reusable Oil Absorbents Market By Material, 2016-2028 (US$ Bn)
TABLE 75 South East Asia Reusable Oil Absorbents Market By Application, 2016-2028 (US$ Bn)
TABLE 76 South East Asia Reusable Oil Absorbents Market By End Use, 2016-2028 (US$ Bn)
TABLE 77 Rest of Asia Pacific Reusable Oil Absorbents Market By Type, 2016-2028 (US$ Bn)
TABLE 78 Rest of Asia Pacific Reusable Oil Absorbents Market By Material, 2016-2028 (US$ Bn)
TABLE 79 Rest of Asia Pacific Reusable Oil Absorbents Market By Application, 2016-2028 (US$ Bn)
TABLE 80 Rest of Asia Pacific Reusable Oil Absorbents Market By End Use, 2016-2028 (US$ Bn)
TABLE 81 Latin America Reusable Oil Absorbents Market By Type, 2016-2028 (US$ Bn)
TABLE 82 Latin America Reusable Oil Absorbents Market By Material, 2016-2028 (US$ Bn)
TABLE 83 Latin America Reusable Oil Absorbents Market By Application, 2016-2028 (US$ Bn)
TABLE 84 Latin America Reusable Oil Absorbents Market By End Use, 2016-2028 (US$ Bn)
TABLE 85 Latin America Reusable Oil Absorbents Market By Country, 2016-2028 (US$ Bn)
TABLE 86 Brazil Reusable Oil Absorbents Market By Type, 2016-2028 (US$ Bn)
TABLE 87 Brazil Reusable Oil Absorbents Market By Material, 2016-2028 (US$ Bn)
TABLE 88 Brazil Reusable Oil Absorbents Market By Application, 2016-2028 (US$ Bn)
TABLE 89 Brazil Reusable Oil Absorbents Market By End Use, 2016-2028 (US$ Bn)
TABLE 90 Mexico Reusable Oil Absorbents Market By Type, 2016-2028 (US$ Bn)
TABLE 91 Mexico Reusable Oil Absorbents Market By Material, 2016-2028 (US$ Bn)
TABLE 92 Mexico Reusable Oil Absorbents Market By Application, 2016-2028 (US$ Bn)
TABLE 93 Mexico Reusable Oil Absorbents Market By End Use, 2016-2028 (US$ Bn)
TABLE 94 Rest of Latin America Reusable Oil Absorbents Market By Type, 2016-2028 (US$ Bn)
TABLE 95 Rest of Latin America Reusable Oil Absorbents Market By Material, 2016-2028 (US$ Bn)
TABLE 96 Rest of Latin America Reusable Oil Absorbents Market By Application, 2016-2028 (US$ Bn)
TABLE 97 Rest of Latin America Reusable Oil Absorbents Market By End Use, 2016-2028 (US$ Bn)
TABLE 98 Middle East and Africa Reusable Oil Absorbents Market By Type, 2016-2028 (US$ Bn)
TABLE 99 Middle East and Africa Reusable Oil Absorbents Market By Material, 2016-2028 (US$ Bn)
TABLE 100 Middle East and Africa Reusable Oil Absorbents Market By Application, 2016-2028 (US$ Bn)
TABLE 101 Middle East and Africa Reusable Oil Absorbents Market By End Use, 2016-2028 (US$ Bn)
TABLE 102 Middle East and Africa Reusable Oil Absorbents Market By Country, 2016-2028 (US$ Bn)
TABLE 103 GCC Countries Reusable Oil Absorbents Market By Type, 2016-2028 (US$ Bn)
TABLE 104 GCC Countries Reusable Oil Absorbents Market By Material, 2016-2028 (US$ Bn)
TABLE 105 GCC Countries Reusable Oil Absorbents Market By Application type, 2016-2028 (US$ Bn)
TABLE 106 GCC Countries Reusable Oil Absorbents Market By End Use, 2016-2028 (US$ Bn)
TABLE 107 South Africa Reusable Oil Absorbents Market By Type, 2016-2028 (US$ Bn)
TABLE 108 South Africa Reusable Oil Absorbents Market By Material, 2016-2028 (US$ Bn)
TABLE 109 South Africa Reusable Oil Absorbents Market By Application, 2016-2028 (US$ Bn)
TABLE 110 South Africa Reusable Oil Absorbents Market By End Use, 2016-2028 (US$ Bn)
TABLE 111 Rest of Middle East and Africa Reusable Oil Absorbents Market By Type, 2016-2028 (US$ Bn)
TABLE 112 Rest of Middle East and Africa Reusable Oil Absorbents Market By Material, 2016-2028 (US$ Bn)
TABLE 113 Rest of Middle East and Africa Reusable Oil Absorbents Market By Application, 2016-2028 (US$ Bn)
TABLE 114 Rest of Middle East and Africa Reusable Oil Absorbents Market By End Use, 2016-2028 (US$ Bn)

Frequently Asked Questions

Which key factors will influence the reusable oil absorbents market growth over 2022-2028?

Increasing industrialization is the major factor in the reusable oil absorbent market growth. The increasing industrial development and rapid globalization are also growing market demand. The increasing demand for Food & beverages, chemicals, Oil & gas and other applications propels the market growth. Furthermore, reusable oil absorbents are cost-effective and can be reused, which is also the growth of this market. Additionally, investments made by the government and various development

What will be the value of the reusable oil absorbents market during 2022-2028?

The global reusable oil absorbents market is anticipated to grow at a substantial CAGR of XX in the upcoming years. The global reusable oil absorbents market was estimated to be worth USD XX million in 2021 and is expected to be worth USD XX million by 2028.

Which region will contribute notably towards the reusable oil absorbents market value?

Asia Pacific region held the majority in the global reusable oil absorbents market in 2021. The increasing population, mostly in such countries as India, china, japan and others. Rapid industrial development and the increasing number of products are expected to increase demand in emerging economies in the Asia Pacific region. The Asia Pacific has seen growth in increasing demand for Absorbent pads, absorbent mats and absorbent rolls. Furthermore, the reusable oil absorbents market in the Asia-Pacific

Which are the significant players leveraging the reusable oil absorbents market growth?

Some of the major players in the market are Closed Loop Recycling, ITU AbsorbTech, Inc, Global Spill Control, Brent Industries, Inc., US Sorbents, Inc., TEXTILE ABSORBENT PRODUCTS CO. LLC, New Pig Corporation, VJ Engineering Solutions Sdn. Bhd., Kimberly-Clark Worldwide, Inc., ZHEJIANG JEENOR NEW MATERIAL CO., LTD, LPT SYSTEMS, Pigmalion Environmental INC., ACME Environmental, Elastec, and Ktech.

Which is the industry’s major reusable oil absorbent market segment?

In 2021, the automotive segment dominated the reusable oil absorbents market due to the industry offering new technology-based products and excellent product delivery and quality. These factors contribute to the automotive segment’s expansion during the forecast period.

Germany Ground Power Unit Market

Published:
Report ID: 36282

Solar Generator Market

Published:
Report ID: 36226

Drilling Fluids Market

Published:
Report ID: 5398

Gas Engines Market

Published:
Report ID: 6044

India Solar Canopy Carport Market

Published:
Report ID: 36081

Intelligent Pigging Services Market

Published:
Report ID: 6909

Drill Bits Market

Published:
Report ID: 5399

Air Compressor Market

Published:
Report ID: 2818

Pipeline Leak Detection Market

Published:
Report ID: 9703

Pressure Pumping Market

Published:
Report ID: 6029

UK Ground Power Unit Market

Published:
Report ID: 35478

Wood Pellets Market

Published:
Report ID: 6376

Purchase Options

$2999
Delivery Format: Excel.
$4999
Designed for the individual purchaser.
$6999
Users located at a single corporate site or regional office.
$7999
Allowed for unlimited sharing globally within one company.
Smallform of Sample request

Have a question?

User Profile

Don’t settle for less – trust Mitul to help you find the best solution.

Report delivery within 24 to 48 hours

– Other Info –

What people say?-

User Review

I am very impressed with the information in this report. The author clearly did their research when they came up with this product and it has already given me a lot of ideas.

Jana Schmidt
CEDAR CX Technologies

– Connect with us –

Phone

+91 6232 49 3207


support

24/7 Research Support


sales@credenceresearch.com

– Research Methodology –

Going beyond the basics: advanced techniques in research methodology

– Trusted By –

Pepshi, LG, Nestle
Motorola, Honeywell, Johnson and johnson
LG Chem, SIEMENS, Pfizer
Unilever, Samsonite, QIAGEN