
Market Overview
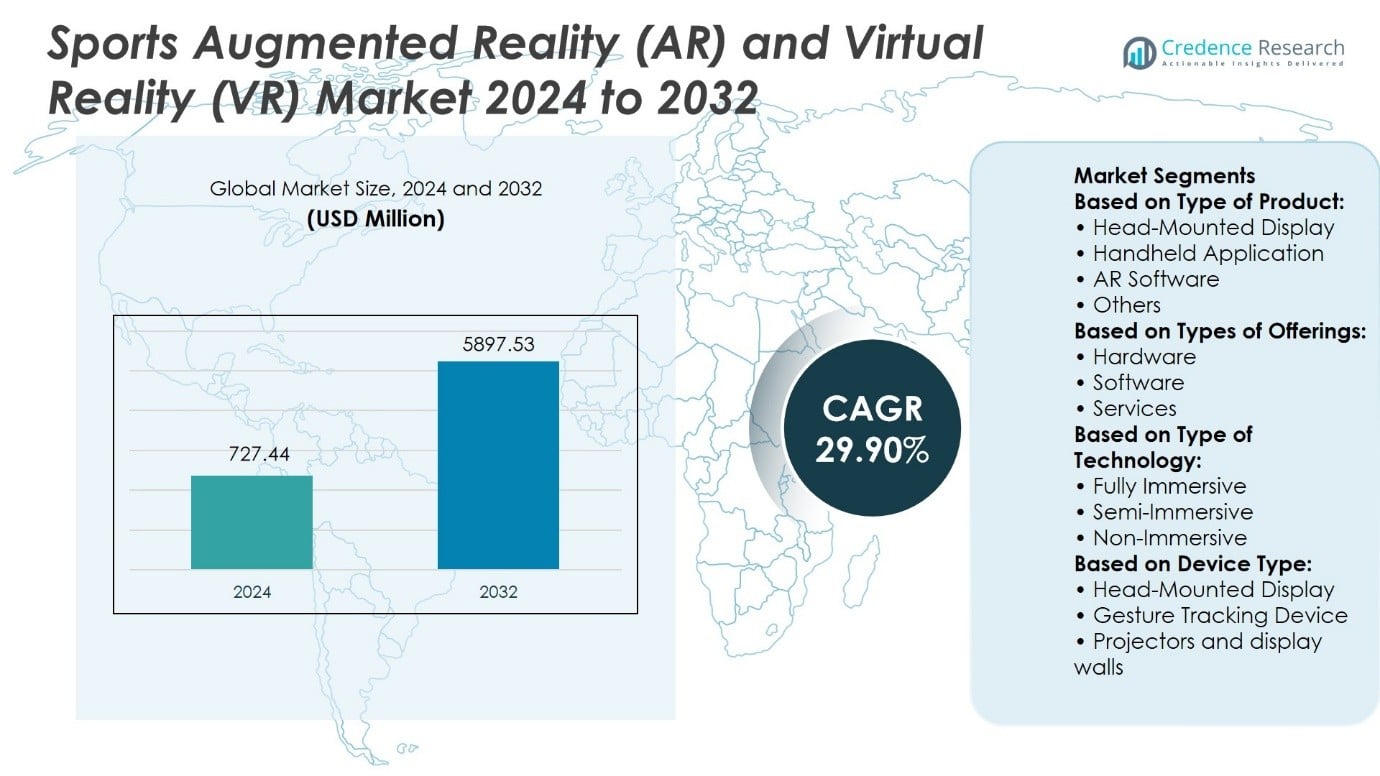
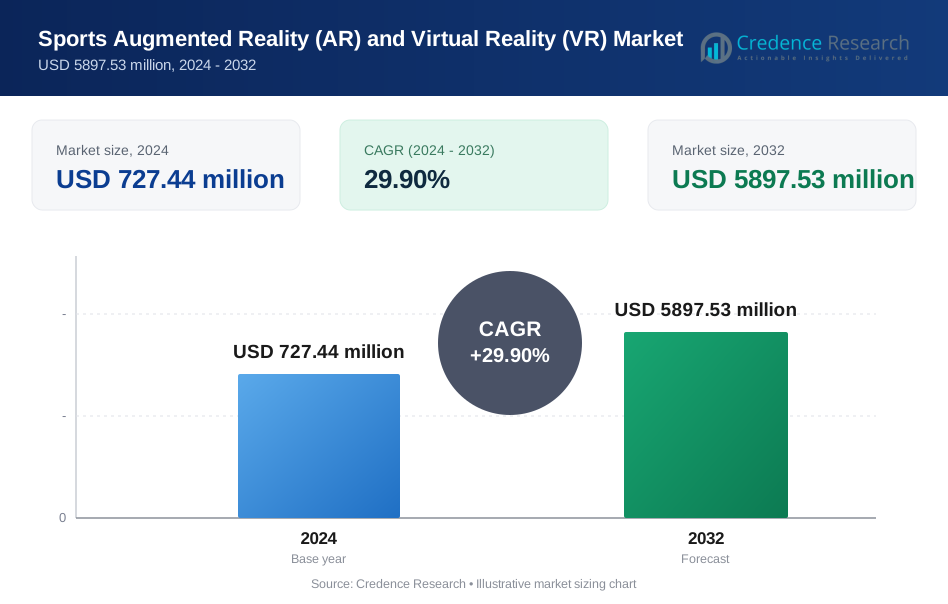
Sports Augmented Reality (AR) and Virtual Reality (VR) Market size was valued at USD 727.44 million in 2024 and is anticipated to reach USD 5897.53 million by 2032, at a CAGR of 29.90% during the forecast period.| REPORT ATTRIBUTE | DETAILS |
|---|---|
| Historical Period | 2020-2024 |
| Base Year | 2024 |
| Forecast Period | 2025-2032 |
| Sports Augmented Reality (AR) and Virtual Reality (VR) Market Size 2024 | USD 727.44 Million |
| Sports Augmented Reality (AR) and Virtual Reality (VR) Market, CAGR | 29.90% |
| Sports Augmented Reality (AR) and Virtual Reality (VR) Market Size 2032 | USD 5897.53 Million |
Market Insights
- The Sports Augmented Reality (AR) and Virtual Reality (VR) Market size was valued at USD 727.44 million in 2024 and is projected to reach USD 5897.53 million by 2032, at a CAGR of 29.90%.
- Market drivers include rising demand for immersive fan engagement, advanced athlete training solutions, and enhanced broadcasting platforms.
- Key trends highlight AR integration in live match coverage, VR applications in esports tournaments, and adoption of cloud-based scalable platforms.
- Competitive analysis shows continuous innovation in hardware, software, and services supported by strong partnerships with sports organizations.
- Market restraints involve high infrastructure costs, limited accessibility in developing regions, and data privacy concerns associated with immersive devices.
- Regional analysis indicates North America leads adoption, Asia-Pacific shows rapid expansion, Europe strengthens with digital investments, while Latin America and the Middle East & Africa provide emerging opportunities.
- Leading companies invest in next-generation devices, interactive content, and advanced analytics to sustain market growth.
Market Drivers
Rising Demand for Immersive Fan Engagement Experiences The Sports Augmented Reality (AR) and Virtual Reality (VR) Market benefits from the growing focus on delivering immersive fan experiences. Stadiums and broadcasters adopt AR overlays and VR headsets to provide real-time data, replays, and personalized viewing angles. It allows fans to engage with sports content beyond traditional screens, creating stronger loyalty. Teams and leagues deploy AR-based apps that enhance live events with interactive statistics and 3D visuals. Sponsors leverage these platforms to deliver targeted promotions that improve brand recall. Broadcasters integrate VR platforms to offer virtual seats, expanding fan access without physical attendance.- For instance, Sony Interactive Entertainment reported that its PlayStation VR headset reached 5 million units sold by January 2020, enabling sports broadcasters to stream immersive basketball and football replays through VR-compatible applications.
- For instance, STRIVR reported conducting 3.6 million XR training sessions across Fortune 1000 enterprises and elite sports teams, and achieving deployment including professional athletic facilities, as part of its immersive training infrastructure.
Market Trends
Increasing Integration of AR and VR in Live Sports Events and Fan Zones The Sports Augmented Reality (AR) and Virtual Reality (VR) Market demonstrates a growing trend of integrating immersive technology into live sports experiences. Event organizers deploy AR-enabled apps that project player statistics, instant replays, and interactive content during matches. It enhances fan zones with VR simulators that replicate real match conditions for audience engagement. Stadiums experiment with AR navigation tools to improve crowd management and accessibility. Sponsors create branded AR experiences that deliver personalized promotions to attendees. Broadcasters also expand adoption of VR feeds to replicate in-stadium perspectives for remote fans.- For instance, the Premier League Player VR title-developed by Rezzil in partnership with the Premier League and launched became immediately accessible to over 40 million active Meta Quest users worldwide.
- For instance, Strivr has achieved significant adoption of Extended Reality (XR) training, with 1.5 million XR training sessions launched and VR/AR headsets deployed across 10,000 locations, including professional sports facilities.
Market Challenges Analysis
High Infrastructure Costs and Limited Accessibility for Mass Adoption The Sports Augmented Reality (AR) and Virtual Reality (VR) Market faces challenges due to the high cost of advanced hardware and supporting infrastructure. Professional-grade VR headsets, motion tracking systems, and AR smart glasses remain expensive for both consumers and sports organizations. It restricts accessibility in emerging economies where disposable income levels are lower. Stadiums and training facilities require substantial investment to integrate AR-enabled navigation, VR simulators, and immersive broadcasting systems. Smaller clubs and regional sports bodies struggle to justify the expense of adoption without immediate returns. The uneven distribution of infrastructure limits the potential for widespread deployment across different tiers of the sports ecosystem. Technical Limitations, User Fatigue, and Data Privacy Concerns The Sports Augmented Reality (AR) and Virtual Reality (VR) Market also encounters technical barriers that hinder consistent user experiences. VR headsets can cause discomfort and fatigue after extended use, reducing long-term engagement among fans and athletes. It creates concerns around motion sickness and visual strain that require ongoing technological refinement. AR devices depend on stable connectivity and high-resolution graphics, which can be difficult to sustain in large stadium environments. Sports organizations also face challenges related to data privacy, as AR and VR platforms capture sensitive biometric and behavioral information. Regulatory frameworks for handling such data remain underdeveloped, creating risks for stakeholders who integrate immersive technologies into sports operations.Market Opportunities
Expansion of Immersive Fan Engagement and Remote Viewing Experiences The Sports Augmented Reality (AR) and Virtual Reality (VR) Market presents significant opportunities through enhanced fan engagement models. Broadcasters and event organizers can create virtual stadiums that replicate live match environments with interactive features. It allows fans who cannot attend games to experience events with premium views and real-time overlays. AR-based applications can enrich live broadcasts with detailed performance metrics and player insights, strengthening audience loyalty. Brands and sponsors can design interactive campaigns that drive measurable engagement through immersive content. The integration of VR seating experiences provides revenue diversification while extending access to global audiences. Advancement of Athlete Training, Coaching, and Sports Science Applications The Sports Augmented Reality (AR) and Virtual Reality (VR) Market also offers growth potential in training and performance development. Professional teams and academies can deploy VR simulators that replicate competitive scenarios, helping athletes refine tactical decision-making. It enhances coaching effectiveness by providing AR smart glasses that overlay instructions during practice sessions. Sports science programs can leverage AR platforms to analyze biomechanics with precise data capture. Rehabilitation centers adopt VR-based tools to accelerate injury recovery while monitoring progress with measurable outcomes. These opportunities highlight the role of immersive technologies in building long-term value across both professional and grassroots sports.Market Segmentation Analysis:
By Type of Product The Sports Augmented Reality (AR) and Virtual Reality (VR) Market divides into head-mounted displays, handheld applications, AR software, and other specialized tools. Head-mounted displays dominate due to their ability to deliver immersive experiences for both fans and athletes. It supports training simulations, tactical visualizations, and virtual seat experiences. Handheld applications gain attention in fan engagement, offering portable solutions for replays, statistics, and interactive overlays. AR software drives adoption through analytics, data visualization, and interactive fan platforms. Other product categories, including smart glasses and integrated systems, contribute by addressing niche requirements in both performance monitoring and event operations.- For instance, Sony confirmed in May 2023 that cumulative sales of its PlayStation VR headsets reached 5 million units worldwide, establishing a solid installed base for immersive sports simulations and interactive fan experiences.
- For instance, Meta Platforms reported in 2023 that cumulative sales of its Quest headsets exceeded 20.0 million units globally, highlighting the scale of hardware adoption that underpins immersive AR/VR applications across sports training and fan engagement.
Segments:
Based on Type of Product:- Head-Mounted Display
- Handheld Application
- AR Software
- Others
- Hardware
- Software
- Services
- Fully Immersive
- Semi-Immersive
- Non-Immersive
- Head-Mounted Display
- Gesture Tracking Device
- Projectors and display walls
- North America
- U.S.
- Canada
- Mexico
- Europe
- UK
- France
- Germany
- Italy
- Spain
- Russia
- Belgium
- Netherlands
- Austria
- Sweden
- Poland
- Denmark
- Switzerland
- Rest of Europe
- Asia Pacific
- China
- Japan
- South Korea
- India
- Australia
- Thailand
- Indonesia
- Vietnam
- Malaysia
- Philippines
- Taiwan
- Rest of Asia Pacific
- Latin America
- Brazil
- Argentina
- Peru
- Chile
- Colombia
- Rest of Latin America
- Middle East
- UAE
- KSA
- Israel
- Turkey
- Iran
- Rest of Middle East
- Africa
- Egypt
- Nigeria
- Algeria
- Morocco
- Rest of Africa
Regional Analysis
North America North America leads the Sports Augmented Reality (AR) and Virtual Reality (VR) Market with 35% share, reflecting strong adoption of immersive technologies across professional sports leagues. The region has advanced stadium infrastructure that integrates AR overlays, VR-based fan experiences, and real-time interactive features. Broadcasters use AR graphics to enrich live coverage, while VR headsets deliver virtual seat experiences for fans unable to attend physically. Sports franchises invest heavily in VR-based athlete training platforms that replicate competitive scenarios and enhance decision-making skills. Universities and training centers also integrate AR smart glasses to support performance analysis and injury prevention. Government and private sector collaboration further strengthens the region’s leadership in immersive sports technology. Asia-Pacific Asia-Pacific accounts for 32% share of the Sports Augmented Reality (AR) and Virtual Reality (VR) Market, driven by rapid technology adoption and expanding esports ecosystems. Countries such as China, Japan, South Korea, and India invest in AR/VR applications for broadcasting, fan engagement, and athlete training. Strong manufacturing capacity ensures faster production and deployment of devices like VR headsets and AR-enabled glasses. The region benefits from large urban populations and high smartphone penetration, which accelerate AR-based mobile sports applications. Esports events across Asia-Pacific often integrate AR/VR experiences, attracting younger audiences and global sponsorship. Governments also support smart sports infrastructure, positioning the region as a hub for scalable AR/VR adoption in sports. Europe Europe contributes 22% share to the Sports Augmented Reality (AR) and Virtual Reality (VR) Market, reflecting consistent integration of immersive technologies into professional sports. Broadcasters across the region use AR overlays to provide real-time match statistics and tactical insights. VR-based broadcasting expands remote viewing opportunities, offering fans immersive perspectives without traveling to stadiums. Sports clubs invest in VR-driven training modules that simulate live match conditions and enhance tactical awareness. National training academies and federations adopt AR smart glasses for performance feedback, further expanding the technology’s role in sports development. The region’s regulatory frameworks around data privacy also encourage safe and structured use of immersive tools. Latin America Latin America holds 6% share of the Sports Augmented Reality (AR) and Virtual Reality (VR) Market, showing gradual adoption supported by improving digital infrastructure. Broadcasters experiment with AR-driven fan experiences during football tournaments and regional sports events. Growing internet penetration and affordable VR devices create opportunities for both fan engagement and grassroots training programs. Esports organizations across Brazil and Mexico also integrate VR platforms, which expand immersive participation. Governments begin to explore AR/VR use cases in stadium design and sports education. Although adoption levels remain lower than in developed markets, rising consumer awareness creates strong potential for future growth. Middle East & Africa The Middle East & Africa account for 5% share of the Sports Augmented Reality (AR) and Virtual Reality (VR) Market, with increasing momentum driven by government-backed sports initiatives. Countries such as the United Arab Emirates and Saudi Arabia invest in smart stadium projects that include AR navigation and VR broadcasting. Regional sports bodies adopt VR training systems to enhance player readiness in football and athletics. AR-enabled fan experiences during international tournaments also improve engagement levels. Expanding esports activity, particularly in the Gulf region, supports the gradual adoption of immersive platforms. While infrastructure and cost barriers remain, ongoing investments in digital transformation create a favorable outlook for growth.Key Player Analysis
- Oculus (Meta)
- HTC Vive
- Sony PlayStation VR
- Microsoft HoloLens
- Google Cardboard
- Magic Leap
- Samsung Gear VR
- Unity Technologies
- Apple (with rumored AR/VR products)
- Vuzix
Competitive Analysis
The Sports Augmented Reality (AR) and Virtual Reality (VR) Market features such as EON Reality, Oculus (Meta Platforms), Sony Interactive Entertainment, HTC Corporation, Panasonic Corporation, Samsung Electronics, and Microsoft Corporation. The Sports Augmented Reality (AR) and Virtual Reality (VR) Market demonstrates a highly competitive environment shaped by rapid innovation and continuous investment in immersive technologies. Companies focus on developing advanced headsets, AR-enabled applications, and VR platforms that enhance both fan engagement and athlete performance. Competition centers on product differentiation, with emphasis on high-resolution displays, lightweight designs, extended battery life, and seamless integration with sports broadcasting systems. Service providers expand their reach by offering tailored training simulators, interactive fan zones, and cloud-based platforms for scalable adoption. Strategic collaborations with sports leagues, broadcasters, and technology partners strengthen market positioning. The competitive intensity drives ongoing advancements that accelerate global adoption of AR and VR across live sports, esports, training facilities, and digital broadcasting.Recent Developments
- In August 2025, Meta Quest introduced advanced three-dimensional motion capture and hand gesture controls, allowing more interactive and realistic sports VR experiences. Meta is also investing in cloud-based VR rendering for higher fidelity simulations accessible without heavy hardware.
- In June 2024, Apple announced the availability of Vision Pro in new countries and regions. Consumers in Mainland China, Japan, Singapore, and Hong Kong could pre-order the device on June 13, 2024, with mass availability beginning June 28, 2024. Customers in Australia, Germany, France, Canada, and the U.K. were also allowed to pre-order.
- In February 2024, Sony Corporation announced its plans to include PC compatibility in the PlayStation VR2 model. Currently, the company is testing its compatibility with PC, and in the future, this will allow PS VR2 players access to more VR games via their PC.
- In November 2023, Tech Mahindra, a leading provider of digital transformation, consulting, and business re-engineering services, entered into a collaboration with Amazon Web Services (AWS) to build a sports cloud platform.
Market Concentration & Characteristics
The Sports Augmented Reality (AR) and Virtual Reality (VR) Market reflects a moderately concentrated structure characterized by a mix of established technology providers and emerging innovators. It demonstrates strong entry barriers due to the high costs of hardware development, software integration, and content creation tailored for sports. The market emphasizes continuous innovation in headsets, AR applications, and immersive platforms that cater to both fan engagement and athlete performance. It relies on strategic collaborations with broadcasters, sports leagues, and training institutions to expand adoption. The industry displays fast product cycles, with frequent upgrades in display quality, processing power, and user experience features. It also shows high reliance on ecosystem integration, where hardware, software, and services must function seamlessly to deliver value. The concentration highlights a competitive landscape shaped by advanced R&D capabilities, strong financial resources, and partnerships that ensure consistent deployment of immersive technologies across global sports applications.Report Coverage
The research report offers an in-depth analysis based on Type of Product, Types of Offerings, Type of Technology, Device Type and Geography. It details leading market players, providing an overview of their business, product offerings, investments, revenue streams, and key applications. Additionally, the report includes insights into the competitive environment, SWOT analysis, current market trends, as well as the primary drivers and constraints. Furthermore, it discusses various factors that have driven market expansion in recent years. The report also explores market dynamics, regulatory scenarios, and technological advancements that are shaping the industry. It assesses the impact of external factors and global economic changes on market growth. Lastly, it provides strategic recommendations for new entrants and established companies to navigate the complexities of the market.Future Outlook
- The Sports Augmented Reality (AR) and Virtual Reality (VR) Market will expand with deeper integration of immersive content in live broadcasting.
- It will strengthen athlete training through advanced VR simulators and AR-based performance analytics.
- Fan engagement will evolve with virtual stadium experiences and personalized AR applications.
- It will see wider adoption in esports with VR-driven tournaments and AR overlays for interactive viewing.
- Hardware innovation will focus on lighter headsets, longer battery life, and higher resolution displays.
- It will benefit from cloud-based platforms that support scalable AR and VR sports applications.
- Data-driven insights from AR and VR tools will enhance coaching and sports science programs.
- It will attract new sponsorship models through immersive advertising and branded fan experiences.
- Educational institutions and academies will integrate AR and VR into training curriculums.
- It will grow across emerging regions as infrastructure improves and immersive devices become more affordable.
Request a Free Sample
Fill in your details and we'll send you a free sample report.
- Sample data tables & charts
- Research methodology
Need a Custom Version of This Report?
Tailor the scope, geography, or segments to your exact requirements.
- Custom geography or segment scope
- Direct access to our analyst team
Frequently Asked Questions
What is the current market size for Sports Augmented Reality (AR) and Virtual Reality (VR) Market, and what is its projected size in 2032?
At what Compound Annual Growth Rate is the Sports Augmented Reality (AR) and Virtual Reality (VR) Market projected to grow between 2025 and 2032?
Which Sports Augmented Reality (AR) and Virtual Reality (VR) Market segment held the largest share in 2024?
What are the primary factors fueling the growth of Sports Augmented Reality (AR) and Virtual Reality (VR) Market?
Who are the leading companies in the Sports Augmented Reality (AR) and Virtual Reality (VR) Market?
Which region commanded the largest share of the Sports Augmented Reality (AR) and Virtual Reality (VR) Market in 2024?
Table of Content
Chapter 1. Report Introduction
- 1.1 Report Description & Purpose
- 1.1.1 Report Title & Market Definition
- 1.1.2 Unique Selling Propositions (USP) & Key Differentiators
- 1.1.3 Value Proposition for Stakeholders
- 1.2 Research Objectives
- 1.2.1 Market Sizing Objectives (Volume & Revenue) (Volume Where Applicable)
- 1.2.2 Segmentation Objectives
- 1.2.3 Competitive Intelligence Objectives
- 1.2.4 Forecast & Scenario Objectives
- 1.3 Report Scope
- 1.3.1 Sports Augmented Reality (AR) and Virtual Reality (VR) Scope – Segments & Subsegments Covered
- 1.3.2 Geographic Scope – Regions & Countries Covered
- 1.3.3 Historical Period, Base Year & Forecast Period (2024; forecast to 2032)
- 1.3.4 Inclusions & Exclusions
- 1.4 Industry Classification & Applicable Codes
- 1.5 Currency, Measurement Units & Valuation Basis
- 1.6 Target Stakeholders
- 1.7 Limitations & Assumptions
Chapter 2. Executive Summary
- 2.1 Global Sports Augmented Reality (AR) and Virtual Reality (VR) Market Snapshot
- 2.1.1 Market Size – Historical (2024) & Forecast (2024-2032) (2024: USD 727.44 million → 2032: USD 5897.53 million)
- 2.1.2 Volume & Revenue – Global Totals (Volume Where Applicable)
- 2.1.3 Key Market Highlights – Top Five Facts
- 2.2 Sports Augmented Reality (AR) and Virtual Reality (VR) Market Segmentation Snapshot
- 2.2.1 Market Split by Region – 2024 vs. 2032
- 2.3 Competitive Snapshot
- 2.3.1 Top 10 Players by Revenue Share – 2024
- 2.3.2 Top 10 Players by Volume Share – 2024 (Volume Where Applicable)
- 2.3.3 Recent Strategic Developments (18-Month Summary)
- 2.4 Key Investment Highlights & Strategic Conclusions
Chapter 3. Sports Augmented Reality (AR) and Virtual Reality (VR) Market Dynamics & Industry Analysis
- 3.1 Market Overview & Context
- 3.1.1 Sports Augmented Reality (AR) and Virtual Reality (VR) Market Position in the Broader Industry Value Chain
- 3.1.2 Demand Structure & Purchasing Dynamics
- 3.1.3 Market Maturity & Development Stage by Region
- 3.2 Sports Augmented Reality (AR) and Virtual Reality (VR) Market Drivers
- 3.3 Sports Augmented Reality (AR) and Virtual Reality (VR) Market Restraints & Challenges
- 3.4 Sports Augmented Reality (AR) and Virtual Reality (VR) Market Opportunities
- 3.5 Porter's Five Forces Analysis
- 3.5.1 Threat of New Entrants
- 3.5.2 Bargaining Power of Suppliers
- 3.5.3 Bargaining Power of Buyers
- 3.5.4 Threat of Substitutes
- 3.5.5 Competitive Rivalry – Intensity Assessment
- 3.6 Sports Augmented Reality (AR) and Virtual Reality (VR) Value Chain Analysis
- 3.6.1 Upstream – Key Inputs, Resources & Suppliers
- 3.6.1.1 Key Input/Resource 1
- 3.6.1.2 Key Input/Resource 2
- 3.6.1.3 Key Input/Resource 3
- 3.6.2 Midstream – Core Operations & Value Creation
- 3.6.2.1 Operating Model & Process Overview
- 3.6.2.2 Key Operating Locations & Capabilities by Company
- 3.6.3 Downstream – Market Channels & End Users
- 3.6.3.1 Direct Sales & Customer Engagement Channels
- 3.6.3.2 Indirect Sales, Intermediaries & Partner Channels
- 3.6.4 Value Chain Profitability Analysis
- 3.6.1 Upstream – Key Inputs, Resources & Suppliers
- 3.7 PESTEL Analysis
- 3.7.1 Political Factors
- 3.7.2 Economic Factors
- 3.7.3 Social Factors
- 3.7.4 Technological Factors
- 3.7.5 Environmental Factors
- 3.7.6 Legal Factors
- 3.8 Sports Augmented Reality (AR) and Virtual Reality (VR) Supply Chain Analysis
- 3.8.1 Critical Input & Resource Availability Risk Assessment
- 3.8.2 Supplier & Operational Concentration Risk (Geographic Exposure)
- 3.8.3 Supply & Service Disruption Impact Analysis
- 3.9 Regulatory & Policy Landscape
Note: The regulatory and policy landscape section covers regulations based on their applicability to the market, Sports Augmented Reality (AR) and Virtual Reality (VR) category, geography, and scope of the study. Only regulatory frameworks with a material impact on operations, compliance, trade, sustainability, or market access are analyzed in detail.
Chapter 4. Key Investment Pockets & Opportunity Analysis
- 4.1 Sports Augmented Reality (AR) and Virtual Reality (VR) Market Attractiveness Analysis
- 4.1.1 By Region – Investment Attractiveness Matrix (Market Size × CAGR)
- 4.2 Absolute Revenue Growth Opportunity
- 4.2.1 By Region – Absolute Revenue Growth Through 2032
- 4.3 Incremental Demand Opportunity
- 4.3.1 By Region – Incremental Demand Through 2032
- 4.3.2 Segment – Incremental Demand
- 4.4 Emerging Submarket Opportunity Deep Dive (Subject to Applicability)
- 4.5 Priority Market Opportunity Scorecards
- 4.5.1 United States
- 4.5.2 Europe
- 4.5.3 Asia
- 4.5.4 Middle East & Africa
Note: Priority market opportunity scorecards reflect the geographic scope and strategic relevance of the study. Listed markets are indicative and may be adapted to the industry.
Chapter 5. Sports Augmented Reality (AR) and Virtual Reality (VR) Cross-Border Trade & Market Access Analysis
- 5.1 International Trade & Cross-Border Activity Overview
- 5.1.1 Global Export Value by Country (2024)
- 5.1.2 Global Export Volume by Country (2024) (Volume Where Applicable)
- 5.1.3 Global Import Value by Country (2024)
- 5.1.4 Global Import Volume by Country (2024) (Volume Where Applicable)
- 5.1.5 Net Trade Balance by Country (2024)
- 5.2 Export Analysis – Segment
- 5.2.1 Category 1 (Applicable Classification Code)
- 5.2.2 Category 2 (Applicable Classification Code)
- 5.2.3 Category 3 (Applicable Classification Code)
- 5.2.4 Category 4 (Applicable Classification Code)
- 5.2.5 Category 5 (Applicable Classification Code)
- 5.3 Import Analysis – Segment
- 5.3.1 Category 1 (Applicable Classification Code)
- 5.3.2 Category 2 (Applicable Classification Code)
- 5.3.3 Category 3 (Applicable Classification Code)
- 5.3.4 Category 4 (Applicable Classification Code)
- 5.3.5 Category 5 (Applicable Classification Code)
- 5.4 Cross-Border Pricing & Transaction Benchmarks
- 5.4.1 Export Pricing – Segment & Country
- 5.4.2 Import Pricing – Segment & Source Country
- 5.4.3 Price Trends (2024)
- 5.5 Key Cross-Border Trade & Delivery Routes
- 5.5.1 Cross-Border Trade/Delivery Route 1
- 5.5.2 Cross-Border Trade/Delivery Route 2
- 5.5.3 Cross-Border Trade/Delivery Route 3
- 5.5.4 Cross-Border Trade/Delivery Route 4
- 5.5.5 Cross-Border Trade/Delivery Route 5
- 5.6 Trade Policy & Market Access Impact Assessment
- 5.6.1 Tariff & Non-Tariff Barriers
- 5.6.2 Regional Trade & Economic Integration Frameworks
- 5.6.3 Bilateral & Multilateral Trade Agreements
- 5.6.4 Cross-Border Operating, Licensing & Localization Requirements
Note: This chapter applies where cross-border trade or delivery is relevant to Sports Augmented Reality (AR) and Virtual Reality (VR). Goods, services, and digital offerings are assessed using applicable classifications and transaction measures. Import-export volumes, trade balances, and route analyses are included only where meaningful to the market.
Chapter 6. Competitive Landscape & Company Benchmarking
- 6.1 Sports Augmented Reality (AR) and Virtual Reality (VR) Market Concentration & Structure
- 6.1.1 Herfindahl-Hirschman Index (HHI) – vs. 2024
- 6.1.2 Leading, Mid-Sized & Emerging Player Structure
- 6.1.3 Global, Regional & Local Player Dynamics
- 6.2 Sports Augmented Reality (AR) and Virtual Reality (VR) Market Share Analysis – 2024
- 6.2.1 Global Revenue Share by Company
- 6.2.2 Global Volume Share by Company (Volume Where Applicable)
- 6.2.3 Regional Revenue Share
- 6.2.4 Market Share Evolution ( vs. 2024)
- 6.2.5 Company Market Share by Key Segment
- 6.2.6 Company Market Share by Customer Group
- 6.3 Operating Scale, Capacity & Infrastructure Analysis
- 6.3.1 Global Operating Scale & Supply Capacity
- 6.3.2 Resource Utilization & Operating Efficiency
- 6.3.3 Output, Service Delivery & Activity Metrics
- 6.3.4 Operating Footprint & Infrastructure Map
- 6.3.5 Planned Operational & Capacity Expansion
- 6.4 Sports Augmented Reality (AR) and Virtual Reality (VR) Competitive Benchmarking Matrix
- 6.4.1 Revenue, Growth, Profitability & Operating Metric Comparison
- 6.4.2 Channel Revenue Mix
- 6.4.3 Geographic Revenue Exposure
- 6.4.4 R&D Intensity
- 6.4.5 Sustainability Maturity
- 6.5 Strategic Developments in Sports Augmented Reality (AR) and Virtual Reality (VR) (Last 24 Months)
- 6.5.1 Mergers, Acquisitions & Divestments
- 6.5.2 New Products, Services & Solutions in Sports Augmented Reality (AR) and Virtual Reality (VR)
- 6.5.3 Operational & Infrastructure Expansions
- 6.5.4 Strategic Alliances, Joint Ventures & Partnerships
- 6.5.5 Distribution Expansion & Market Entry
- 6.5.6 Sustainability & ESG Initiatives
- 6.6 Competitive Strategy Mapping
- 6.6.1 Leader, Challenger, Follower & Niche Classification
- 6.6.2 Pricing Strategy Comparison
- 6.6.3 Channel Strategy Matrix
Note: Strategic developments are included based on their materiality and the availability of reliable information.
Chapter 7. Global Sports Augmented Reality (AR) and Virtual Reality (VR) Market – By Sales & Delivery Channel
- 7.1 Segment Overview
- 7.1.1 Volume & Revenue Split by Channel (2024 & 2032) (Volume Where Applicable)
- 7.1.2 Channel Mix Evolution (2024-2032)
Chapter 8. Regional Market Analysis – Global Overview
- 8.1 Global Regional Overview
- 8.1.1 Regional Volume Share (Volume Where Applicable)
- 8.1.2 Regional Revenue Share
- 8.1.3 Regional Volume by Region (Volume Where Applicable)
- 8.1.4 Regional Revenue by Region
- 8.1.5 Regional Forecast Through 2032
- 8.2 Cross-Regional Segment Analysis
- 8.2.1 By Sales & Delivery Channel
- 8.2.2 By Competitive Positioning & Price Tier
Chapter 9. North America Sports Augmented Reality (AR) and Virtual Reality (VR) Market
- 9.1 United States
- 9.2 Canada
- 9.3 Mexico
Chapter 10. Europe Sports Augmented Reality (AR) and Virtual Reality (VR) Market
- 10.1 Germany
- 10.2 France
- 10.3 Italy
- 10.4 United Kingdom
- 10.5 Spain
- 10.6 Poland
- 10.7 Russia
- 10.8 Netherlands
- 10.9 Belgium
- 10.10 Sweden
- 10.11 Denmark
- 10.12 Norway
- 10.13 Rest of Europe
Chapter 11. Asia Pacific Sports Augmented Reality (AR) and Virtual Reality (VR) Market
- 11.1 China
- 11.2 India
- 11.3 Japan
- 11.4 South Korea
- 11.5 Thailand
- 11.6 Indonesia
- 11.7 Vietnam
- 11.8 Malaysia
- 11.9 Australia
- 11.10 Rest of Asia Pacific
Chapter 12. Latin America Sports Augmented Reality (AR) and Virtual Reality (VR) Market
- 12.1 Brazil
- 12.2 Argentina
- 12.3 Colombia
- 12.4 Chile
- 12.5 Rest of Latin America
Chapter 13. Middle East Sports Augmented Reality (AR) and Virtual Reality (VR) Market
- 13.1 Saudi Arabia
- 13.2 United Arab Emirates
- 13.3 Turkey
- 13.4 Israel
- 13.5 Iran
- 13.6 Rest of the Middle East
Chapter 14. Africa Sports Augmented Reality (AR) and Virtual Reality (VR) Market
- 14.1 South Africa
- 14.2 Egypt
- 14.3 Nigeria
- 14.4 Morocco
- 14.5 Rest of Africa
Chapter 15. Sports Augmented Reality (AR) and Virtual Reality (VR) Company Profiles
- 15.1 [Company 01]
- 15.1.1 Company Overview
- 15.1.2 Key Management Personnel
- 15.1.3 Products & Services Portfolio
- 15.1.4 Financial Performance
- 15.1.5 Key Market Focus & Geographic Presence
- 15.1.6 Recent Developments & Strategic Initiatives
Note: The company profile list is preliminary and may change based on research findings, market developments, data availability, and client requirements.
Chapter 16. Appendices
- Appendix A – List of Abbreviations & Acronyms
- Appendix B – Industry Classification Code Reference – Full Series
- Appendix C – Supply, Output & Operating Capacity Data Tables
- Appendix D – End-Use & Demand Base Tables
- Appendix E – Demand, Adoption & Usage Assumptions
- Appendix F – Pricing & Revenue Metric Reference Tables
- Appendix G – Company Operations & Infrastructure Database
- Appendix H – Cross-Border Trade & Activity Data Tables (Where Applicable)
- Appendix I – Regulatory Summary Tables
- Appendix J – Primary Research Participant List (Anonymized)
- Appendix K – Primary Research Questionnaire Framework
- Appendix L – Data Sources & Bibliography
- Appendix M – Market Size Divergence & Source Comparison
Chapter 17. Research Methodology
- 17.1 Research Framework & Philosophy
- 17.2 Secondary Research – Sources, Hierarchy & Data Extraction
- 17.3 Data Modeling – Bottom-Up & Top-Down Market Sizing
- 17.4 Primary Research – Stakeholder Framework, LOI & Sample Sizes
- 17.5 Forecast Methodology – Regression, Scenario & Sensitivity Analysis
- 17.6 Quality Control – Four-Layer Validation Framework
- 17.7 Limitations & Standard Assumptions
- 17.8 Disclaimer
