CHAPTER NO. 1 : INTRODUCTION………………………………. 52
1.1. Report Description ……………………………………………………. 52
Purpose of the Report…………………………………………..52
USP & Key Offerings……………………………………………..52
1.2. Key Benefits for Stakeholders……………………………………… 53
1.3. Target Audience ……………………………………………………….. 53
CHAPTER NO. 2 : EXECUTIVE SUMMARY……………………… 54
CHAPTER NO. 3 : SPORTS HOSPITALITY MARKET FORCES &
INDUSTRY PULSE …………………………….. 56
3.1. Foundations of Change – Market Overview……………………. 56
3.1. Rising Demand for Premium, Experience-Based Offerings…. 58
3.2. Globalization of Major Sporting Events and Growing Youth
Engagement Driving Demand for Premium Sports Hospitality
59
3.3. Corporate Investment in Brand Engagement and Networking
60
3.4. Growth of Major Sporting Events and Infrastructure ……….. 61
3.5. High Cost of Hospitality Packages Limits Accessibility ………. 63
3.6. Economic Uncertainty and Global Disruptions………………… 63
3.7. Operational and Logistical Challenges…………………………… 64
3.8. Startups and Emerging Markets: Catalysts for NextGeneration Sports Hospitality……………………………………… 66
3.9. Tech-Driven Personalization and New Event Formats:
Unlocking the Next Wave of Sports Hospitality Growth……. 68
3.10. Market Equilibrium – Porter’s Five Forces……………………… 69
3.11. Ecosystem Dynamics – Value Chain Analysis ………………….. 74
3.12. Macro Forces – PESTEL Breakdown………………………………. 76
3.13. Assessment of Future Purchasers and Services: Analysis….. 81
CHAPTER NO. 4 : COMPETITION ANALYSIS ………………….. 86
4.1. Company Market Share Analysis………………………………….. 86
4.1.1. Global Sports Hospitality Market Company Revenue Market
Share of Key Companies…………………………………………….. 86
4.2. Strategic Developments …………………………………………….. 88
4.2.1. Acquisitions & Mergers ……………………………………………… 88
4.2.2. Partnership 90
4.2.3. Strategic Plan 92
4.3. Competitive Dashboard……………………………………………… 93
4.4. Company Assessment Metrics, 2024 …………………………….. 94
CHAPTER NO. 5 : GLOBAL MARKET ANALYSIS, INSIGHTS &
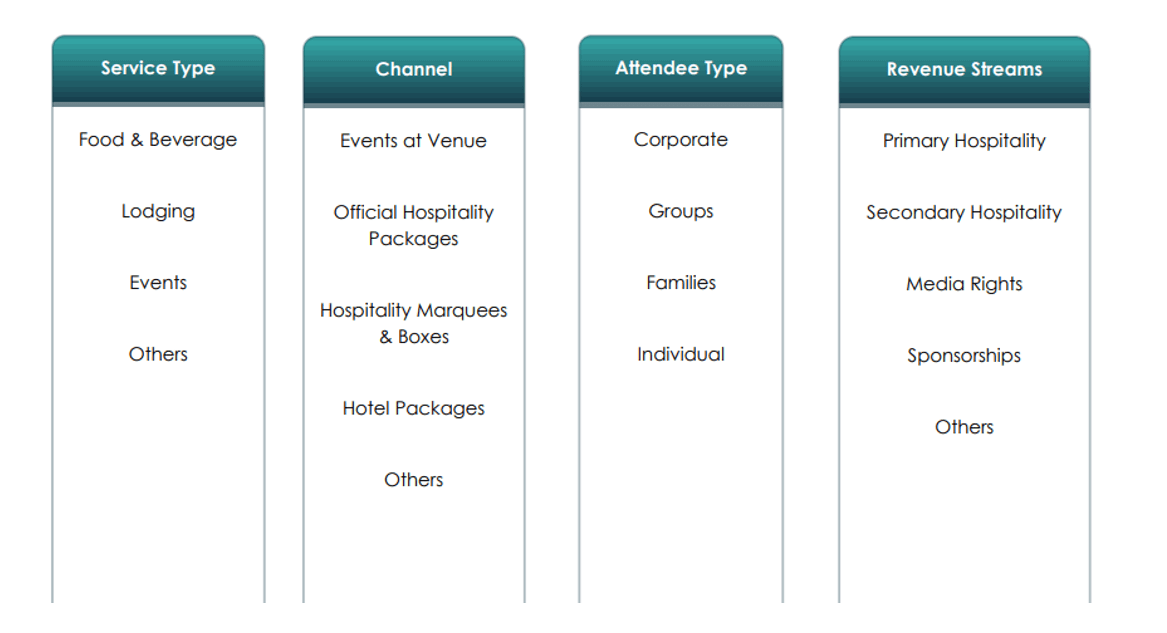
FORECAST, BY SERVICE TYPE……………… 96
CHAPTER NO. 6 : GLOBAL MARKET ANALYSIS, INSIGHTS &
FORECAST, BY CHANNEL…………………. 101
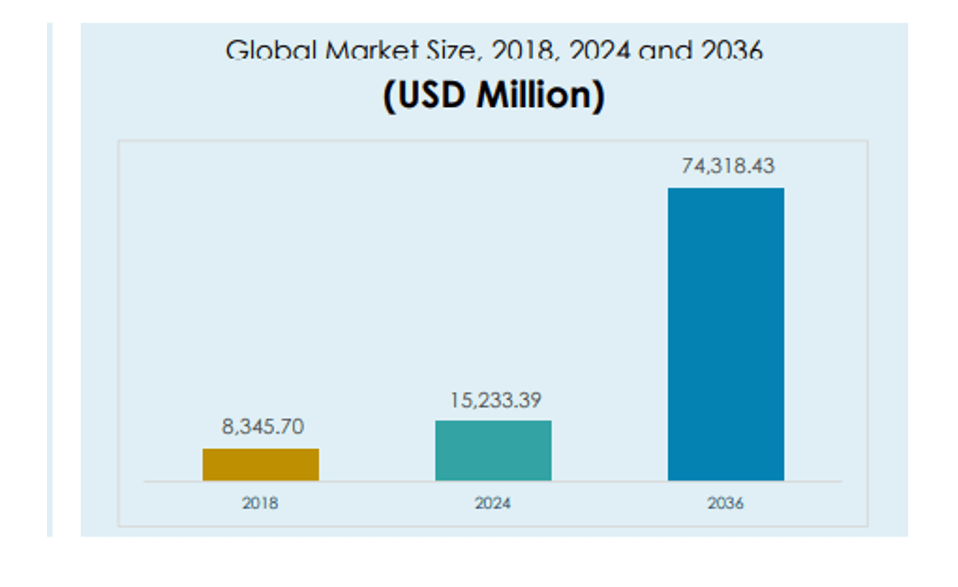
GLOBAL SPORTS HOSPITALITY MARKET, 2018 – 2036
CHAPTER NO. 7 : GLOBAL MARKET ANALYSIS, INSIGHTS &
FORECAST, BY ATTENDEE TYPE ………… 107
CHAPTER NO. 8 : GLOBAL MARKET ANALYSIS, INSIGHTS &
FORECAST, BY REVENUE STREAMS……. 112
CHAPTER NO. 9 : GLOBAL MARKET ANALYSIS, INSIGHTS &
FORECAST, BY REGION …………………… 118
CHAPTER NO. 10 : NORTH AMERICA MARKET ANALYSIS,
INSIGHTS & FORECAST, BY COUNTRY… 124
10.1. North America Market Analysis, Insights & Forecast, by
Service Type 127
10.2. North America Market Analysis, Insights & Forecast, by
Channel 129
10.3. North America Market Analysis, Insights & Forecast, by
Attendee Type131
10.4. North America Market Analysis, Insights & Forecast, by
Revenue Streams ……………………………………………………. 133
10.5. U.S. Market Analysis, Insights & Forecast, by Service Type. 135
10.6. U.S. Market Analysis, Insights & Forecast, by Channel ……. 137
10.7. U.S. Market Analysis, Insights & Forecast, by Attendee Type
139
10.8. U.S. Market Analysis, Insights & Forecast, by Revenue Streams
141
10.9. Canada Market Analysis, Insights & Forecast, by Service Type
143
10.10. Canada Market Analysis, Insights & Forecast, by Channel .. 145
10.11. Canada Market Analysis, Insights & Forecast, by Attendee
Type 147
10.12. Canada Market Analysis, Insights & Forecast, by Revenue
Streams 149
10.13. Mexico Market Analysis, Insights & Forecast, by Service Type
151
10.14. Mexico Market Analysis, Insights & Forecast, by Channel …153
10.15. Mexico Market Analysis, Insights & Forecast, by Attendee
Type 155
10.16. Mexico Market Analysis, Insights & Forecast, by Revenue
Streams 157
CHAPTER NO. 11 : EUROPE MARKET ANALYSIS, INSIGHTS &
FORECAST, BY COUNTRY ………………… 159
11.1. Europe Market Analysis, Insights & Forecast, by Service Type
163
11.2. Europe Market Analysis, Insights & Forecast, by Channel …165
11.3. Europe Market Analysis, Insights & Forecast, by Attendee
Type 168
11.4. Europe Market Analysis, Insights & Forecast, by Revenue
Streams 170
11.5. Germany Market Analysis, Insights & Forecast, by Service
Type 172
11.6. Germany Market Analysis, Insights & Forecast, by Channel 174
11.7. Germany Market Analysis, Insights & Forecast, by Attendee
Type 176
11.8. Germany Market Analysis, Insights & Forecast, by Revenue
Streams 178
11.9. UK Market Analysis, Insights & Forecast, by Service Type .. 180
11.10. UK Market Analysis, Insights & Forecast, by Channel……… 182
11.11. UK Market Analysis, Insights & Forecast, by Attendee Type184
11.12. UK Market Analysis, Insights & Forecast, by Revenue Streams
186
11.13. France Market Analysis, Insights & Forecast, by Service Type
188
11.14. France Market Analysis, Insights & Forecast, by Channel … 190
11.15. France Market Analysis, Insights & Forecast, by Attendee Type
192
11.16. France Market Analysis, Insights & Forecast, by Revenue
Streams 194
11.17. Italy Market Analysis, Insights & Forecast, by Service Type 196
11.18. Italy Market Analysis, Insights & Forecast, by Channel……. 198
11.19. Italy Market Analysis, Insights & Forecast, by Attendee Type
200
11.20. Italy Market Analysis, Insights & Forecast, by Revenue
Streams 202
11.21. Spain Market Analysis, Insights & Forecast, by Service Type
204
11.22. Spain Market Analysis, Insights & Forecast, by Channel….. 206
11.23. Spain Market Analysis, Insights & Forecast, by Attendee Type
208
11.24. Spain Market Analysis, Insights & Forecast, by Revenue
Streams 210
11.25. Russia Market Analysis, Insights & Forecast, by Service Type
212
11.26. Russia Market Analysis, Insights & Forecast, by Channel ….214
11.27. Russia Market Analysis, Insights & Forecast, by Attendee Type
216
11.28. Russia Market Analysis, Insights & Forecast, by Revenue
Streams 218
11.29. Benelux Market Analysis, Insights & Forecast, by Service Type
220
11.30. Benelux Market Analysis, Insights & Forecast, by Channel..222
11.31. Benelux Market Analysis, Insights & Forecast, by Attendee
Type 224
11.32. Benelux Market Analysis, Insights & Forecast, by Revenue
Streams 226
11.33. Sweden Market Analysis, Insights & Forecast, by Service Type
228
11.34. Sweden Market Analysis, Insights & Forecast, by Channel ..230
11.35. Sweden Market Analysis, Insights & Forecast, by Attendee
Type 232
11.36. Sweden Market Analysis, Insights & Forecast, by Revenue
Streams 234
11.37. Austria Market Analysis, Insights & Forecast, by Service Type
236
11.38. Austria Market Analysis, Insights & Forecast, by Channel …238
11.39. Austria Market Analysis, Insights & Forecast, by Attendee
Type 241
11.40. Austria Market Analysis, Insights & Forecast, by Revenue
Streams 243
11.41. Denmark Market Analysis, Insights & Forecast, by Service
Type 245
11.42. Denmark Market Analysis, Insights & Forecast, by Channel 247
11.43. Denmark Market Analysis, Insights & Forecast, by Attendee
Type 249
11.44. Denmark Market Analysis, Insights & Forecast, by Revenue
Streams 251
11.45. Poland Market Analysis, Insights & Forecast, by Service Type
253
11.46. Poland Market Analysis, Insights & Forecast, by Channel… 255
11.47. Poland Market Analysis, Insights & Forecast, by Attendee
Type 257
11.48. Poland Market Analysis, Insights & Forecast, by Revenue
Streams 259
11.49. Portugal Market Analysis, Insights & Forecast, by Service Type
261
11.50. Portugal Market Analysis, Insights & Forecast, by Channel 263
11.51. Portugal Market Analysis, Insights & Forecast, by Attendee
Type 265
11.52. Portugal Market Analysis, Insights & Forecast, by Revenue
Streams 267
11.53. Rest of Europe Market Analysis, Insights & Forecast, by
Service Type 269
11.54. Rest of Europe Market Analysis, Insights & Forecast, by
Channel 271
11.55. Rest of Europe Market Analysis, Insights & Forecast, by
Attendee Type273
11.56. Rest of Europe Market Analysis, Insights & Forecast, by
Revenue Streams ……………………………………………………..275
CHAPTER NO. 12 : ASIA PACIFIC MARKET ANALYSIS, INSIGHTS
& FORECAST, BY COUNTRY……………… 277
12.1. Asia Pacific Market Analysis, Insights & Forecast, by Service
Type 281
12.2. Asia Pacific Market Analysis, Insights & Forecast, by Channel
283
12.3. Asia Pacific Market Analysis, Insights & Forecast, by Attendee
Type 285
12.4. Asia Pacific Market Analysis, Insights & Forecast, by Revenue
Streams 287
12.5. China Market Analysis, Insights & Forecast, by Service Type
289
12.6. China Market Analysis, Insights & Forecast, by Channel……291
12.7. China Market Analysis, Insights & Forecast, by Attendee Type
293
12.8. China Market Analysis, Insights & Forecast, by Revenue
Streams 295
12.9. Japan Market Analysis, Insights & Forecast, by Service Type
297
12.10. Japan Market Analysis, Insights & Forecast, by Channel …..299
12.11. Japan Market Analysis, Insights & Forecast, by Attendee Type
301
12.12. Japan Market Analysis, Insights & Forecast, by Revenue
Streams 303
12.13. South Korea Market Analysis, Insights & Forecast, by Service
Type 305
12.14. South Korea Market Analysis, Insights & Forecast, by Channel
307
12.15. South Korea Market Analysis, Insights & Forecast, by
Attendee Type309
12.16. South Korea Market Analysis, Insights & Forecast, by Revenue
Streams 311
12.17. India Market Analysis, Insights & Forecast, by Service Type313
12.18. India Market Analysis, Insights & Forecast, by Channel…… 315
12.19. India Market Analysis, Insights & Forecast, by Attendee Type
317
12.20. India Market Analysis, Insights & Forecast, by Revenue
Streams 319
12.21. Australia Market Analysis, Insights & Forecast, by Service
Type 321
12.22. Australia Market Analysis, Insights & Forecast, by Channel 323
12.23. Australia Market Analysis, Insights & Forecast, by Attendee
Type 325
12.24. Australia Market Analysis, Insights & Forecast, by Revenue
Streams 327
12.25. Thailand Market Analysis, Insights & Forecast, by Service Type
329
12.26. Thailand Market Analysis, Insights & Forecast, by Channel .331
12.27. Thailand Market Analysis, Insights & Forecast, by Attendee
Type 333
12.28. Thailand Market Analysis, Insights & Forecast, by Revenue
Streams 335
12.29. Indonesia Market Analysis, Insights & Forecast, by Service
Type 337
12.30. Indonesia Market Analysis, Insights & Forecast, by Channel
339
12.31. Indonesia Market Analysis, Insights & Forecast, by Attendee
Type 341
12.32. Indonesia Market Analysis, Insights & Forecast, by Revenue
Streams 343
12.33. Vietnam Market Analysis, Insights & Forecast, by Service Type
345
12.34. Vietnam Market Analysis, Insights & Forecast, by Channel .347
12.35. Vietnam Market Analysis, Insights & Forecast, by Attendee
Type 349
12.36. Vietnam Market Analysis, Insights & Forecast, by Revenue
Streams 351
12.37. Malaysia Market Analysis, Insights & Forecast, by Service
Type 353
12.38. Malaysia Market Analysis, Insights & Forecast, by Channel 355
12.39. Malaysia Market Analysis, Insights & Forecast, by Attendee
Type 357
12.40. Malaysia Market Analysis, Insights & Forecast, by Revenue
Streams 359
12.41. Singapore Market Analysis, Insights & Forecast, by Service
Type 361
12.42. Singapore Market Analysis, Insights & Forecast, by Channel
363
12.43. Singapore Market Analysis, Insights & Forecast, by Attendee
Type 365
12.44. Singapore Market Analysis, Insights & Forecast, by Revenue
Streams 367
12.45. Philippines Market Analysis, Insights & Forecast, by Service
Type 369
12.46. Philippines Market Analysis, Insights & Forecast, by Channel
371
12.47. Philippines Market Analysis, Insights & Forecast, by Attendee
Type 373
12.48. Philippines Market Analysis, Insights & Forecast, by Revenue
Streams 375
12.49. Taiwan Market Analysis, Insights & Forecast, by Service Type
377
12.50. Taiwan Market Analysis, Insights & Forecast, by Channel .. 379
12.51. Taiwan Market Analysis, Insights & Forecast, by Attendee
Type 381
12.52. Taiwan Market Analysis, Insights & Forecast, by Revenue
Streams 383
12.53. Rest of Asia Pacific Market Analysis, Insights & Forecast, by
Service Type 385
12.54. Rest of Asia Pacific Market Analysis, Insights & Forecast, by
Channel 387
12.55. Rest of Asia Pacific Market Analysis, Insights & Forecast, by
Attendee Type389
12.56. Rest of Asia Pacific Market Analysis, Insights & Forecast, by
Revenue Streams ……………………………………………………..391
CHAPTER NO. 13 : LATIN AMERICA MARKET ANALYSIS,
INSIGHTS & FORECAST, BY COUNTRY… 393
13.1. Latin America Market Analysis, Insights & Forecast, by Service
Type 397
13.2. Latin America Market Analysis, Insights & Forecast, by
Channel 399
13.3. Latin America Market Analysis, Insights & Forecast, by
Attendee Type401
13.4. Latin America Market Analysis, Insights & Forecast, by
Revenue Streams ……………………………………………………..403
13.5. Brazil Market Analysis, Insights & Forecast, by Service Type
405
13.6. Brazil Market Analysis, Insights & Forecast, by Channel……407
13.7. Brazil Market Analysis, Insights & Forecast, by Attendee Type
409
13.8. Brazil Market Analysis, Insights & Forecast, by Revenue
Streams 411
13.9. Argentina Market Analysis, Insights & Forecast, by Service
Type 413
13.10. Argentina Market Analysis, Insights & Forecast, by Channel
415
13.11. Argentina Market Analysis, Insights & Forecast, by Attendee
Type 417
13.12. Argentina Market Analysis, Insights & Forecast, by Revenue
Streams 419
13.13. Peru Market Analysis, Insights & Forecast, by Service Type 421
13.14. Peru Market Analysis, Insights & Forecast, by Channel …… 423
13.15. Peru Market Analysis, Insights & Forecast, by Attendee Type
425
13.16. Peru Market Analysis, Insights & Forecast, by Revenue
Streams 427
13.17. Chile Market Analysis, Insights & Forecast, by Service Type 429
13.18. Chile Market Analysis, Insights & Forecast, by Channel…… 431
13.19. Chile Market Analysis, Insights & Forecast, by Attendee Type
433
13.20. Chile Market Analysis, Insights & Forecast, by Revenue
Streams 435
13.21. Colombia Market Analysis, Insights & Forecast, by Service
Type 437
13.22. Colombia Market Analysis, Insights & Forecast, by Channel439
13.23. Colombia Market Analysis, Insights & Forecast, by Attendee
Type 441
13.24. Colombia Market Analysis, Insights & Forecast, by Revenue
Streams 443
13.25. Rest of Latin America Market Analysis, Insights & Forecast, by
Service Type 445
13.26. Rest of Latin America Market Analysis, Insights & Forecast, by
Channel 447
13.27. Rest of Latin America Market Analysis, Insights & Forecast, by
Attendee Type449
13.28. Rest of Latin America Market Analysis, Insights & Forecast, by
Revenue Streams ……………………………………………………..451
CHAPTER NO. 14 : MIDDLE EAST MARKET ANALYSIS,
INSIGHTS & FORECAST, BY COUNTRY… 453
14.1. Middle East Market Analysis, Insights & Forecast, by Service
Type 457
14.2. Middle East Market Analysis, Insights & Forecast, by Channel
459
14.3. Middle East Market Analysis, Insights & Forecast, by Attendee
Type 462
14.4. Middle East Market Analysis, Insights & Forecast, by Revenue
Streams 464
14.5. Turkey Market Analysis, Insights & Forecast, by Service Type
466
14.6. Turkey Market Analysis, Insights & Forecast, by Channel….468
14.7. Turkey Market Analysis, Insights & Forecast, by Attendee
Type 470
14.8. Turkey Market Analysis, Insights & Forecast, by Revenue
Streams 472
14.9. GCC Market Analysis, Insights & Forecast, by Service Type .474
14.10. GCC Market Analysis, Insights & Forecast, by Channel……..476
14.11. GCC Market Analysis, Insights & Forecast, by Attendee Type
478
14.12. GCC Market Analysis, Insights & Forecast, by Revenue
Streams 480
14.13. Israel Market Analysis, Insights & Forecast, by Service Type
482
14.14. Israel Market Analysis, Insights & Forecast, by Channel ….. 484
14.15. Israel Market Analysis, Insights & Forecast, by Attendee Type
486
14.16. Israel Market Analysis, Insights & Forecast, by Revenue
Streams 488
14.17. Rest of Middle East Market Analysis, Insights & Forecast, by
Service Type 490
14.18. Rest of Middle East Market Analysis, Insights & Forecast, by
Channel 492
14.19. Rest of Middle East Market Analysis, Insights & Forecast, by
Attendee Type494
14.20. Rest of Middle East Market Analysis, Insights & Forecast, by
Revenue Streams ……………………………………………………. 496
CHAPTER NO. 15 : AFRICA MARKET ANALYSIS, INSIGHTS &
FORECAST, BY COUNTRY…………………. 498
15.1. Africa Market Analysis, Insights & Forecast, by Service Type
502
15.2. Africa Market Analysis, Insights & Forecast, by Channel …. 504
15.3. Africa Market Analysis, Insights & Forecast, by Attendee Type
507
15.4. Africa Market Analysis, Insights & Forecast, by Revenue
Streams 509
15.5. South Africa Market Analysis, Insights & Forecast, by Service
Type 511
15.6. South Africa Market Analysis, Insights & Forecast, by Channel
513
15.7. South Africa Market Analysis, Insights & Forecast, by
Attendee Type515
15.8. South Africa Market Analysis, Insights & Forecast, by Revenue
Streams 517
15.9. Egypt Market Analysis, Insights & Forecast, by Service Type
519
15.10. Egypt Market Analysis, Insights & Forecast, by Channel……521
15.11. Egypt Market Analysis, Insights & Forecast, by Attendee Type
523
15.12. Egypt Market Analysis, Insights & Forecast, by Revenue
Streams 525
15.13. Nigeria Market Analysis, Insights & Forecast, by Service Type
527
15.14. Nigeria Market Analysis, Insights & Forecast, by Channel …529
15.15. Nigeria Market Analysis, Insights & Forecast, by Attendee
Type 531
15.16. Nigeria Market Analysis, Insights & Forecast, by Revenue
Streams 533
15.17. Algeria Market Analysis, Insights & Forecast, by Service Type
535
15.18. Algeria Market Analysis, Insights & Forecast, by Channel …537
15.19. Algeria Market Analysis, Insights & Forecast, by Attendee
Type 539
15.20. Algeria Market Analysis, Insights & Forecast, by Revenue
Streams 541
15.21. Morocco Market Analysis, Insights & Forecast, by Service Type
543
15.22. Morocco Market Analysis, Insights & Forecast, by Channel 545
15.23. Morocco Market Analysis, Insights & Forecast, by Attendee
Type 547
15.24. Morocco Market Analysis, Insights & Forecast, by Revenue
Streams 549
15.25. Rest of Africa Market Analysis, Insights & Forecast, by Service
Type 551
15.26. Rest of Africa Market Analysis, Insights & Forecast, by
Channel 553
15.27. Rest of Africa Market Analysis, Insights & Forecast, by
Attendee Type555
15.28. Rest of Africa Market Analysis, Insights & Forecast, by
Revenue Streams ……………………………………………………. 557
CHAPTER NO. 16 : COMPANY PROFILE ……………………….. 559
16.1. Keith Prowse 559
16.2. Sodexo Live! 563
16.3. RK Sports Hospitality ……………………………………………….. 566
16.4. Legends 568
16.5. BYROM 571
16.6. Wasserman 574
16.7. DTB Sports Hospitality and Event Management Ltd…………577
16.8. QuintEvents- Liberty Media Corporation……………………….580
16.9. Compass Group PLC…………………………………………………..582
16.10. Delaware North ……………………………………………………….585
16.11. KNT-CT HOLDINGS CO., LTD. (KNT Sports) ……………………..587
16.12. On Location Events, LLC (Endeavour) ……………………………590
16.13. ATPI Limited 594
List of Figures
FIG NO. 1. Sports Hospitality Market Revenue Share, By Service Type,
2024 & 2036………………………………………………………………96
FIG NO. 2. Market Attractiveness Analysis, By Service Type…………….97
FIG NO. 3. Incremental Revenue Growth Opportunity by Service Type,
2024 – 2036 ……………………………………………………………….98
FIG NO. 4. Sports Hospitality Market Revenue Share, By Channel, 2024
& 2036…………………………………………………………………….101
FIG NO. 5. Market Attractiveness Analysis, Channel……………………..102
FIG NO. 6. Incremental Revenue Growth Opportunity by Channel,
2024 – 2036 ……………………………………………………………..103
FIG NO. 7. Sports Hospitality Market Revenue Share, By Attendee
Type, 2024 & 2036 ……………………………………………………107
FIG NO. 8. Market Attractiveness Analysis, By Attendee Type ……….108
FIG NO. 9. Incremental Revenue Growth Opportunity by Attendee
Type, 2024 – 2036……………………………………………………..109
FIG NO. 10. Sports Hospitality Market Revenue Share, By Revenue
Streams, 2024 & 2036……………………………………………….112
FIG NO. 11. Market Attractiveness Analysis, By Revenue Streams……113
FIG NO. 12. Incremental Revenue Growth Opportunity by Revenue
Streams, 2024 – 2036 ………………………………………………..114
FIG NO. 13. Sports Hospitality Market Revenue Share, By Region, 2024
& 2036…………………………………………………………………….118
FIG NO. 14. Market Attractiveness Analysis, By Region…………………..119
FIG NO. 15. Incremental Revenue Growth Opportunity by Region, 2024
– 2036 ……………………………………………………………………..120
FIG NO. 16. Sports Hospitality Market Revenue Share, By Country, 2024
& 2036…………………………………………………………………….124
FIG NO. 17. Sports Hospitality Market Revenue Share, By Country, 2024
& 2036 …………………………………………………………………… 159
FIG NO. 18. Sports Hospitality Market Revenue Share, By Country, 2024
& 2036 …………………………………………………………………… 277
FIG NO. 19. Sports Hospitality Market Revenue Share, By Country, 2024
& 2036 …………………………………………………………………… 393
FIG NO. 20. Sports Hospitality Market Revenue Share, By Country, 2024
& 2036 …………………………………………………………………… 453
FIG NO. 21. Sports Hospitality Market Revenue Share, By Country, 2024
& 2036 …………………………………………………………………… 498
List of Tables
TABLE NO. 1. : Global Sports Hospitality Market Revenue, By Service Type,
2018 – 2024 (USD Million)………………………………………….. 99
TABLE NO. 2. : Global Sports Hospitality Market Revenue, By Service Type,
2025 – 2030 (USD Million)………………………………………….. 99
TABLE NO. 3. : Global Sports Hospitality Market Revenue, By Service Type,
2031 – 2036 (USD Million)………………………………………… 100
TABLE NO. 4. : Global Sports Hospitality Market Revenue, By Channel,
2018 – 2024 (USD Million)………………………………………… 104
TABLE NO. 5. : Global Sports Hospitality Market Revenue, By Channel,
2025 – 2030 (USD Million)………………………………………… 105
TABLE NO. 6. : Global Sports Hospitality Market Revenue, By Channel,
2031 – 2036 (USD Million)………………………………………… 106
TABLE NO. 7. : Global Sports Hospitality Market Revenue, By Attendee
Type, 2018 – 2024 (USD Million) ……………………………….. 110
TABLE NO. 8. : Global Sports Hospitality Market Revenue, By Attendee
Type, 2025 – 2030 (USD Million)…………………………………111
TABLE NO. 9. : Global Sports Hospitality Market Revenue, By Attendee
Type, 2031 – 2036 (USD Million)…………………………………111
TABLE NO. 10. : Global Sports Hospitality Market Revenue, By Revenue
Streams, 2018 – 2024 (USD Million) ……………………………115
TABLE NO. 11. : Global Sports Hospitality Market Revenue, By Revenue
Streams, 2025 – 2030 (USD Million) ……………………………116
TABLE NO. 12. : Global Sports Hospitality Market Revenue, By Revenue
Streams, 2031 – 2036 (USD Million) ……………………………117
TABLE NO. 13. : Global Sports Hospitality Market Revenue, By Region, 2018
– 2024 (USD Million) …………………………………………………121
TABLE NO. 14. : Global Sports Hospitality Market Revenue, By Region, 2025
– 2030 (USD Million) …………………………………………………122
TABLE NO. 15. : Global Sports Hospitality Market Revenue, By Region, 2031
– 2036 (USD Million) …………………………………………………123
TABLE NO. 16. : North America Sports Hospitality Market Revenue, By
Country, 2018 – 2024 (USD Million) ……………………………125
TABLE NO. 17. : North America Sports Hospitality Market Revenue, By
Country, 2025– 2030 (USD Million) …………………………….125
TABLE NO. 18. : North America Sports Hospitality Market Revenue, By
Country, 2031 – 2036 (USD Million) ……………………………126
TABLE NO. 19. : North America Sports Hospitality Market Revenue, By
Service Type, 2018 – 2024 (USD Million) ……………………..127
TABLE NO. 20. : North America Sports Hospitality Market Revenue, By
Service Type, 2025 – 2030 (USD Million) ……………………..127
TABLE NO. 21. : North America Sports Hospitality Market Revenue, By
Service Type, 2031 – 2036 (USD Million) ……………………..128
TABLE NO. 22. : North America Sports Hospitality Market Revenue, By
Channel, 2018 – 2024 (USD Million)…………………………… 129
TABLE NO. 23. : North America Sports Hospitality Market Revenue, By
Channel, 2025 – 2030 (USD Million)…………………………… 129
TABLE NO. 24. : North America Sports Hospitality Market Revenue, By
Channel, 2031 – 2036 (USD Million)…………………………… 130
TABLE NO. 25. : North America Sports Hospitality Market Revenue, By
Attendee Type, 2018 – 2024 (USD Million) …………………. 131
TABLE NO. 26. : North America Sports Hospitality Market Revenue, By
Attendee Type, 2025 – 2030 (USD Million) …………………. 131
TABLE NO. 27. : North America Sports Hospitality Market Revenue, By
Attendee Type, 2031 – 2036 (USD Million) …………………. 132
TABLE NO. 28. : North America Sports Hospitality Market Revenue, By
Revenue Streams, 2025 – 2030 (USD Million)……………… 133
TABLE NO. 29. : North America Sports Hospitality Market Revenue, By
Revenue Streams, 2018 – 2024 (USD Million)……………… 133
TABLE NO. 30. : North America Sports Hospitality Market Revenue, By
Revenue Streams, 2031 – 2036 (USD Million)……………… 134
TABLE NO. 31. : U.S. Sports Hospitality Market Revenue, By Service Type,
2018 – 2024 (USD Million)………………………………………… 135
TABLE NO. 32. : U.S. Sports Hospitality Market Revenue, By Service Type,
2025 – 2030 (USD Million)………………………………………… 135
TABLE NO. 33. : U.S. Sports Hospitality Market Revenue, By Service Type,
2031 – 2036 (USD Million)………………………………………… 136
TABLE NO. 34. : U.S. Sports Hospitality Market Revenue, By Channel, 2018 –
2024 (USD Million)…………………………………………………… 137
TABLE NO. 35. : U.S. Sports Hospitality Market Revenue, By Channel, 2025 –
2030 (USD Million)…………………………………………………… 137
TABLE NO. 36. : U.S. Sports Hospitality Market Revenue, By Channel, 2031 –
2036 (USD Million) ……………………………………………………138
TABLE NO. 37. : U.S. Sports Hospitality Market Revenue, By Attendee Type,
2018 – 2024 (USD Million) …………………………………………139
TABLE NO. 38. : U.S. Sports Hospitality Market Revenue, By Attendee Type,
2025 – 2030 (USD Million) …………………………………………139
TABLE NO. 39. : U.S. Sports Hospitality Market Revenue, By Attendee Type,
2031 – 2036 (USD Million) …………………………………………140
TABLE NO. 40. : U.S. Sports Hospitality Market Revenue, By Revenue
Streams, 2025 – 2030 (USD Million) ……………………………141
TABLE NO. 41. : U.S. Sports Hospitality Market Revenue, By Revenue
Streams, 2018 – 2024 (USD Million) ……………………………141
TABLE NO. 42. : U.S. Sports Hospitality Market Revenue, By Revenue
Streams, 2031 – 2036 (USD Million) ……………………………142
TABLE NO. 43. : Canada Sports Hospitality Market Revenue, By Service Type,
2018 – 2024 (USD Million) …………………………………………143
TABLE NO. 44. : Canada Sports Hospitality Market Revenue, By Service Type,
2025 – 2030 (USD Million) …………………………………………143
TABLE NO. 45. : Canada Sports Hospitality Market Revenue, By Service Type,
2031 – 2036 (USD Million) …………………………………………144
TABLE NO. 46. : Canada Sports Hospitality Market Revenue, By Channel,
2018 – 2024 (USD Million) …………………………………………145
TABLE NO. 47. : Canada Sports Hospitality Market Revenue, By Channel,
2025 – 2030 (USD Million) …………………………………………145
TABLE NO. 48. : Canada Sports Hospitality Market Revenue, By Channel,
2031 – 2036 (USD Million) …………………………………………146
TABLE NO. 49. : Canada Sports Hospitality Market Revenue, By Attendee
Type, 2018 – 2024 (USD Million)…………………………………147
TABLE NO. 50. : Canada Sports Hospitality Market Revenue, By Attendee
Type, 2025 – 2030 (USD Million) ……………………………….. 147
TABLE NO. 51. : Canada Sports Hospitality Market Revenue, By Attendee
Type, 2031 – 2036 (USD Million) ……………………………….. 148
TABLE NO. 52. : Canada Sports Hospitality Market Revenue, By Revenue
Streams, 2025 – 2030 (USD Million)…………………………… 149
TABLE NO. 53. : Canada Sports Hospitality Market Revenue, By Revenue
Streams, 2018 – 2024 (USD Million)…………………………… 149
TABLE NO. 54. : Canada Sports Hospitality Market Revenue, By Revenue
Streams, 2031 – 2036 (USD Million)…………………………… 150
TABLE NO. 55. : Mexico Sports Hospitality Market Revenue, By Service Type,
2018 – 2024 (USD Million)………………………………………… 151
TABLE NO. 56. : Mexico Sports Hospitality Market Revenue, By Service Type,
2025 – 2030 (USD Million)………………………………………… 151
TABLE NO. 57. : Mexico Sports Hospitality Market Revenue, By Service Type,
2031 – 2036 (USD Million)………………………………………… 152
TABLE NO. 58. : Mexico Sports Hospitality Market Revenue, By Channel,
2018 – 2024 (USD Million)………………………………………… 153
TABLE NO. 59. : Mexico Sports Hospitality Market Revenue, By Channel,
2025 – 2030 (USD Million)………………………………………… 153
TABLE NO. 60. : Mexico Sports Hospitality Market Revenue, By Channel,
2031 – 2036 (USD Million)………………………………………… 154
TABLE NO. 61. : Mexico Sports Hospitality Market Revenue, By Attendee
Type, 2018 – 2024 (USD Million) ……………………………….. 155
TABLE NO. 62. : Mexico Sports Hospitality Market Revenue, By Attendee
Type, 2025 – 2030 (USD Million) ……………………………….. 155
TABLE NO. 63. : Mexico Sports Hospitality Market Revenue, By Attendee
Type, 2031 – 2036 (USD Million) ……………………………….. 156
TABLE NO. 64. : Mexico Sports Hospitality Market Revenue, By Revenue
Streams, 2025 – 2030 (USD Million) ……………………………157
TABLE NO. 65. : Mexico Sports Hospitality Market Revenue, By Revenue
Streams, 2018 – 2024 (USD Million) ……………………………157
TABLE NO. 66. : Mexico Sports Hospitality Market Revenue, By Revenue
Streams, 2031 – 2036 (USD Million) ……………………………158
TABLE NO. 67. : Europe Sports Hospitality Market Revenue, By Country,
2018 – 2024 (USD Million) …………………………………………160
TABLE NO. 68. : Europe Sports Hospitality Market Revenue, By Country,
2025 – 2030 (USD Million) …………………………………………161
TABLE NO. 69. : Asia Pacific Sports Hospitality Market Revenue, By Country,
2031 – 2036 (USD Million) …………………………………………162
TABLE NO. 70. : Europe Sports Hospitality Market Revenue, By Service Type,
2018 – 2024 (USD Million) …………………………………………163
TABLE NO. 71. : Europe Sports Hospitality Market Revenue, By Service Type,
2025 – 2030 (USD Million) …………………………………………163
TABLE NO. 72. : Europe Sports Hospitality Market Revenue, By Service Type,
2031 – 2036 (USD Million) …………………………………………164
TABLE NO. 73. : Europe Sports Hospitality Market Revenue, By Channel,
2018 – 2024 (USD Million) …………………………………………165
TABLE NO. 74. : Europe Sports Hospitality Market Revenue, By Channel,
2025 – 2030 (USD Million) …………………………………………166
TABLE NO. 75. : Europe Sports Hospitality Market Revenue, By Channel,
2031 – 2036 (USD Million) …………………………………………166
TABLE NO. 76. : Europe Sports Hospitality Market Revenue, By Attendee
Type, 2018 – 2024 (USD Million)…………………………………168
TABLE NO. 77. : Europe Sports Hospitality Market Revenue, By Attendee
Type, 2025 – 2030 (USD Million)…………………………………168
TABLE NO. 78. : Europe Sports Hospitality Market Revenue, By Attendee
Type, 2031 – 2036 (USD Million) ……………………………….. 169
TABLE NO. 79. : Europe Sports Hospitality Market Revenue, By Revenue
Streams, 2025 – 2030 (USD Million)…………………………… 170
TABLE NO. 80. : Europe Sports Hospitality Market Revenue, By Revenue
Streams, 2018 – 2024 (USD Million)…………………………… 170
TABLE NO. 81. : Europe Sports Hospitality Market Revenue, By Revenue
Streams, 2031 – 2036 (USD Million)…………………………… 171
TABLE NO. 82. : Germany Sports Hospitality Market Revenue, By Service
Type, 2018 – 2024 (USD Million) ……………………………….. 172
TABLE NO. 83. : Germany Sports Hospitality Market Revenue, By Service
Type, 2025 – 2030 (USD Million) ……………………………….. 172
TABLE NO. 84. : Germany Sports Hospitality Market Revenue, By Service
Type, 2031 – 2036 (USD Million) ……………………………….. 173
TABLE NO. 85. : Germany Sports Hospitality Market Revenue, By Channel,
2018 – 2024 (USD Million)………………………………………… 174
TABLE NO. 86. : Germany Sports Hospitality Market Revenue, By Channel,
2025 – 2030 (USD Million)………………………………………… 174
TABLE NO. 87. : Germany Sports Hospitality Market Revenue, By Channel,
2031 – 2036 (USD Million)………………………………………… 175
TABLE NO. 88. : Germany Sports Hospitality Market Revenue, By Attendee
Type, 2018 – 2024 (USD Million) ……………………………….. 176
TABLE NO. 89. : Germany Sports Hospitality Market Revenue, By Attendee
Type, 2025 – 2030 (USD Million) ……………………………….. 176
TABLE NO. 90. : Germany Sports Hospitality Market Revenue, By Attendee
Type, 2031 – 2036 (USD Million) ……………………………….. 177
TABLE NO. 91. : Germany Sports Hospitality Market Revenue, By Revenue
Streams, 2025 – 2030 (USD Million)…………………………… 178
TABLE NO. 92. : Germany Sports Hospitality Market Revenue, By Revenue
Streams, 2018 – 2024 (USD Million) ……………………………178
TABLE NO. 93. : Germany Sports Hospitality Market Revenue, By Revenue
Streams, 2031 – 2036 (USD Million) ……………………………179
TABLE NO. 94. : UK Sports Hospitality Market Revenue, By Service Type,
2018 – 2024 (USD Million) …………………………………………180
TABLE NO. 95. : UK Sports Hospitality Market Revenue, By Service Type,
2025 – 2030 (USD Million) …………………………………………180
TABLE NO. 96. : UK Sports Hospitality Market Revenue, By Service Type,
2031 – 2036 (USD Million) …………………………………………181
TABLE NO. 97. : UK Sports Hospitality Market Revenue, By Channel, 2018 –
2024 (USD Million) ……………………………………………………182
TABLE NO. 98. : UK Sports Hospitality Market Revenue, By Channel, 2025 –
2030 (USD Million) ……………………………………………………182
TABLE NO. 99. : UK Sports Hospitality Market Revenue, By Channel, 2031 –
2036 (USD Million) ……………………………………………………183
TABLE NO. 100. : UK Sports Hospitality Market Revenue, By Attendee Type,
2018 – 2024 (USD Million) …………………………………………184
TABLE NO. 101. : UK Sports Hospitality Market Revenue, By Attendee Type,
2025 – 2030 (USD Million) …………………………………………184
TABLE NO. 102. : UK Sports Hospitality Market Revenue, By Attendee Type,
2031 – 2036 (USD Million) …………………………………………185
TABLE NO. 103. : UK Sports Hospitality Market Revenue, By Revenue
Streams, 2025 – 2030 (USD Million) ……………………………186
TABLE NO. 104. : UK Sports Hospitality Market Revenue, By Revenue
Streams, 2018 – 2024 (USD Million) ……………………………186
TABLE NO. 105. : UK Sports Hospitality Market Revenue, By Revenue
Streams, 2031 – 2036 (USD Million) ……………………………187
TABLE NO. 106. : France Sports Hospitality Market Revenue, By Service Type,
2018 – 2024 (USD Million)………………………………………… 188
TABLE NO. 107. : France Sports Hospitality Market Revenue, By Service Type,
2025 – 2030 (USD Million)………………………………………… 188
TABLE NO. 108. : France Sports Hospitality Market Revenue, By Service Type,
2031 – 2036 (USD Million)………………………………………… 189
TABLE NO. 109. : France Sports Hospitality Market Revenue, By Channel,
2018 – 2024 (USD Million)………………………………………… 190
TABLE NO. 110. : France Sports Hospitality Market Revenue, By Channel,
2025 – 2030 (USD Million)………………………………………… 190
TABLE NO. 111. : France Sports Hospitality Market Revenue, By Channel,
2031 – 2036 (USD Million)………………………………………… 191
TABLE NO. 112. : France Sports Hospitality Market Revenue, By Attendee
Type, 2018 – 2024 (USD Million) ……………………………….. 192
TABLE NO. 113. : France Sports Hospitality Market Revenue, By Attendee
Type, 2025 – 2030 (USD Million) ……………………………….. 192
TABLE NO. 114. : France Sports Hospitality Market Revenue, By Attendee
Type, 2031 – 2036 (USD Million) ……………………………….. 193
TABLE NO. 115. : France Sports Hospitality Market Revenue, By Revenue
Streams, 2025 – 2030 (USD Million)…………………………… 194
TABLE NO. 116. : France Sports Hospitality Market Revenue, By Revenue
Streams, 2018 – 2024 (USD Million)…………………………… 194
TABLE NO. 117. : France Sports Hospitality Market Revenue, By Revenue
Streams, 2031 – 2036 (USD Million)…………………………… 195
TABLE NO. 118. : Italy Sports Hospitality Market Revenue, By Service Type,
2018 – 2024 (USD Million)………………………………………… 196
TABLE NO. 119. : Italy Sports Hospitality Market Revenue, By Service Type,
2025 – 2030 (USD Million)………………………………………… 196
TABLE NO. 120. : Italy Sports Hospitality Market Revenue, By Service Type,
2031 – 2036 (USD Million) …………………………………………197
TABLE NO. 121. : Italy Sports Hospitality Market Revenue, By Channel, 2018 –
2024 (USD Million) ……………………………………………………198
TABLE NO. 122. : Italy Sports Hospitality Market Revenue, By Channel, 2025 –
2030 (USD Million) ……………………………………………………198
TABLE NO. 123. : Italy Sports Hospitality Market Revenue, By Channel, 2031 –
2036 (USD Million) ……………………………………………………199
TABLE NO. 124. : Italy Sports Hospitality Market Revenue, By Attendee Type,
2018 – 2024 (USD Million) …………………………………………200
TABLE NO. 125. : Italy Sports Hospitality Market Revenue, By Attendee Type,
2025 – 2030 (USD Million) …………………………………………200
TABLE NO. 126. : Italy Sports Hospitality Market Revenue, By Attendee Type,
2031 – 2036 (USD Million) …………………………………………201
TABLE NO. 127. : Italy Sports Hospitality Market Revenue, By Revenue
Streams, 2025 – 2030 (USD Million) ……………………………202
TABLE NO. 128. : Italy Sports Hospitality Market Revenue, By Revenue
Streams, 2018 – 2024 (USD Million) ……………………………202
TABLE NO. 129. : Italy Sports Hospitality Market Revenue, By Revenue
Streams, 2031 – 2036 (USD Million) ……………………………203
TABLE NO. 130. : Spain Sports Hospitality Market Revenue, By Service Type,
2018 – 2024 (USD Million) …………………………………………204
TABLE NO. 131. : Spain Sports Hospitality Market Revenue, By Service Type,
2025 – 2030 (USD Million) …………………………………………204
TABLE NO. 132. : Spain Sports Hospitality Market Revenue, By Service Type,
2031 – 2036 (USD Million) …………………………………………205
TABLE NO. 133. : Spain Sports Hospitality Market Revenue, By Channel, 2018
– 2024 (USD Million) …………………………………………………206
TABLE NO. 134. : Spain Sports Hospitality Market Revenue, By Channel, 2025
– 2030 (USD Million)………………………………………………… 206
TABLE NO. 135. : Spain Sports Hospitality Market Revenue, By Channel, 2031
– 2036 (USD Million)………………………………………………… 207
TABLE NO. 136. : Spain Sports Hospitality Market Revenue, By Attendee
Type, 2018 – 2024 (USD Million) ……………………………….. 208
TABLE NO. 137. : Spain Sports Hospitality Market Revenue, By Attendee
Type, 2025 – 2030 (USD Million) ……………………………….. 208
TABLE NO. 138. : Spain Sports Hospitality Market Revenue, By Attendee
Type, 2031 – 2036 (USD Million) ……………………………….. 209
TABLE NO. 139. : Spain Sports Hospitality Market Revenue, By Revenue
Streams, 2025 – 2030 (USD Million)…………………………… 210
TABLE NO. 140. : Spain Sports Hospitality Market Revenue, By Revenue
Streams, 2018 – 2024 (USD Million)…………………………… 210
TABLE NO. 141. : Spain Sports Hospitality Market Revenue, By Revenue
Streams, 2031 – 2036 (USD Million)…………………………… 211
TABLE NO. 142. : Russia Sports Hospitality Market Revenue, By Service Type,
2018 – 2024 (USD Million)………………………………………… 212
TABLE NO. 143. : Russia Sports Hospitality Market Revenue, By Service Type,
2025 – 2030 (USD Million)………………………………………… 212
TABLE NO. 144. : Russia Sports Hospitality Market Revenue, By Service Type,
2031 – 2036 (USD Million)………………………………………… 213
TABLE NO. 145. : Russia Sports Hospitality Market Revenue, By Channel, 2018
– 2024 (USD Million)………………………………………………… 214
TABLE NO. 146. : Russia Sports Hospitality Market Revenue, By Channel, 2025
– 2030 (USD Million)………………………………………………… 214
TABLE NO. 147. : Russia Sports Hospitality Market Revenue, By Channel, 2031
– 2036 (USD Million)………………………………………………… 215
TABLE NO. 148. : Russia Sports Hospitality Market Revenue, By Attendee
Type, 2018 – 2024 (USD Million)…………………………………216
TABLE NO. 149. : Russia Sports Hospitality Market Revenue, By Attendee
Type, 2025 – 2030 (USD Million)…………………………………216
TABLE NO. 150. : Russia Sports Hospitality Market Revenue, By Attendee
Type, 2031 – 2036 (USD Million)…………………………………217
TABLE NO. 151. : Russia Sports Hospitality Market Revenue, By Revenue
Streams, 2025 – 2030 (USD Million) ……………………………218
TABLE NO. 152. : Russia Sports Hospitality Market Revenue, By Revenue
Streams, 2018 – 2024 (USD Million) ……………………………218
TABLE NO. 153. : Russia Sports Hospitality Market Revenue, By Revenue
Streams, 2031 – 2036 (USD Million) ……………………………219
TABLE NO. 154. : Benelux Sports Hospitality Market Revenue, By Service
Type, 2018 – 2024 (USD Million)…………………………………220
TABLE NO. 155. : Benelux Sports Hospitality Market Revenue, By Service
Type, 2025 – 2030 (USD Million)…………………………………220
TABLE NO. 156. : Benelux Sports Hospitality Market Revenue, By Service
Type, 2031 – 2036 (USD Million)…………………………………221
TABLE NO. 157. : Benelux Sports Hospitality Market Revenue, By Channel,
2018 – 2024 (USD Million) …………………………………………222
TABLE NO. 158. : Benelux Sports Hospitality Market Revenue, By Channel,
2025 – 2030 (USD Million) …………………………………………222
TABLE NO. 159. : Benelux Sports Hospitality Market Revenue, By Channel,
2031 – 2036 (USD Million) …………………………………………223
TABLE NO. 160. : Benelux Sports Hospitality Market Revenue, By Attendee
Type, 2018 – 2024 (USD Million)…………………………………224
TABLE NO. 161. : Benelux Sports Hospitality Market Revenue, By Attendee
Type, 2025 – 2030 (USD Million)…………………………………224
TABLE NO. 162. : Benelux Sports Hospitality Market Revenue, By Attendee
Type, 2031 – 2036 (USD Million) ……………………………….. 225
TABLE NO. 163. : Benelux Sports Hospitality Market Revenue, By Revenue
Streams, 2025 – 2030 (USD Million)…………………………… 226
TABLE NO. 164. : Benelux Sports Hospitality Market Revenue, By Revenue
Streams, 2018 – 2024 (USD Million)…………………………… 226
TABLE NO. 165. : Benelux Sports Hospitality Market Revenue, By Revenue
Streams, 2031 – 2036 (USD Million)…………………………… 227
TABLE NO. 166. : Sweden Sports Hospitality Market Revenue, By Service
Type, 2018 – 2024 (USD Million) ……………………………….. 228
TABLE NO. 167. : Sweden Sports Hospitality Market Revenue, By Service
Type, 2025 – 2030 (USD Million) ……………………………….. 228
TABLE NO. 168. : Sweden Sports Hospitality Market Revenue, By Service
Type, 2031 – 2036 (USD Million) ……………………………….. 229
TABLE NO. 169. : Sweden Sports Hospitality Market Revenue, By Channel,
2018 – 2024 (USD Million)………………………………………… 230
TABLE NO. 170. : Sweden Sports Hospitality Market Revenue, By Channel,
2025 – 2030 (USD Million)………………………………………… 230
TABLE NO. 171. : Sweden Sports Hospitality Market Revenue, By Channel,
2031 – 2036 (USD Million)………………………………………… 231
TABLE NO. 172. : Sweden Sports Hospitality Market Revenue, By Attendee
Type, 2018 – 2024 (USD Million) ……………………………….. 232
TABLE NO. 173. : Sweden Sports Hospitality Market Revenue, By Attendee
Type, 2025 – 2030 (USD Million) ……………………………….. 232
TABLE NO. 174. : Sweden Sports Hospitality Market Revenue, By Attendee
Type, 2031 – 2036 (USD Million) ……………………………….. 233
TABLE NO. 175. : Sweden Sports Hospitality Market Revenue, By Revenue
Streams, 2025 – 2030 (USD Million)…………………………… 234
TABLE NO. 176. : Sweden Sports Hospitality Market Revenue, By Revenue
Streams, 2018 – 2024 (USD Million) ……………………………234
TABLE NO. 177. : Sweden Sports Hospitality Market Revenue, By Revenue
Streams, 2025 – 2030 (USD Million) ……………………………234
TABLE NO. 178. : Sweden Sports Hospitality Market Revenue, By Revenue
Streams, 2031 – 2036 (USD Million) ……………………………235
TABLE NO. 179. : Austria Sports Hospitality Market Revenue, By Service Type,
2018 – 2024 (USD Million) …………………………………………236
TABLE NO. 180. : Austria Sports Hospitality Market Revenue, By Service Type,
2025 – 2030 (USD Million) …………………………………………236
TABLE NO. 181. : Austria Sports Hospitality Market Revenue, By Service Type,
2031 – 2036 (USD Million) …………………………………………237
TABLE NO. 182. : Austria Sports Hospitality Market Revenue, By Channel,
2018 – 2024 (USD Million) …………………………………………238
TABLE NO. 183. : Austria Sports Hospitality Market Revenue, By Channel,
2025 – 2030 (USD Million) …………………………………………239
TABLE NO. 184. : Austria Sports Hospitality Market Revenue, By Channel,
2031 – 2036 (USD Million) …………………………………………240
TABLE NO. 185. : Austria Sports Hospitality Market Revenue, By Attendee
Type, 2018 – 2024 (USD Million)…………………………………241
TABLE NO. 186. : Austria Sports Hospitality Market Revenue, By Attendee
Type, 2025 – 2030 (USD Million)…………………………………241
TABLE NO. 187. : Austria Sports Hospitality Market Revenue, By Attendee
Type, 2031 – 2036 (USD Million)…………………………………242
TABLE NO. 188. : Austria Sports Hospitality Market Revenue, By Revenue
Streams, 2025 – 2030 (USD Million) ……………………………243
TABLE NO. 189. : Austria Sports Hospitality Market Revenue, By Revenue
Streams, 2018 – 2024 (USD Million) ……………………………243
TABLE NO. 190. : Austria Sports Hospitality Market Revenue, By Revenue
Streams, 2031 – 2036 (USD Million)…………………………… 244
TABLE NO. 191. : Denmark Sports Hospitality Market Revenue, By Service
Type, 2018 – 2024 (USD Million) ……………………………….. 245
TABLE NO. 192. : Denmark Sports Hospitality Market Revenue, By Service
Type, 2025 – 2030 (USD Million) ……………………………….. 245
TABLE NO. 193. : Denmark Sports Hospitality Market Revenue, By Service
Type, 2031 – 2036 (USD Million) ……………………………….. 246
TABLE NO. 194. : Denmark Sports Hospitality Market Revenue, By Channel,
2018 – 2024 (USD Million)………………………………………… 247
TABLE NO. 195. : Denmark Sports Hospitality Market Revenue, By Channel,
2025 – 2030 (USD Million)………………………………………… 247
TABLE NO. 196. : Denmark Sports Hospitality Market Revenue, By Channel,
2031 – 2036 (USD Million)………………………………………… 248
TABLE NO. 197. : Denmark Sports Hospitality Market Revenue, By Attendee
Type, 2018 – 2024 (USD Million) ……………………………….. 249
TABLE NO. 198. : Denmark Sports Hospitality Market Revenue, By Attendee
Type, 2025 – 2030 (USD Million) ……………………………….. 249
TABLE NO. 199. : Denmark Sports Hospitality Market Revenue, By Attendee
Type, 2031 – 2036 (USD Million) ……………………………….. 250
TABLE NO. 200. : Denmark Sports Hospitality Market Revenue, By Revenue
Streams, 2025 – 2030 (USD Million)…………………………… 251
TABLE NO. 201. : Denmark Sports Hospitality Market Revenue, By Revenue
Streams, 2018 – 2024 (USD Million)…………………………… 251
TABLE NO. 202. : Sweden Sports Hospitality Market Revenue, By Revenue
Streams, 2031 – 2036 (USD Million)…………………………… 252
TABLE NO. 203. : Poland Sports Hospitality Market Revenue, By Service Type,
2018 – 2024 (USD Million)………………………………………… 253
TABLE NO. 204. : Poland Sports Hospitality Market Revenue, By Service Type,
2025 – 2030 (USD Million) …………………………………………253
TABLE NO. 205. : Poland Sports Hospitality Market Revenue, By Service Type,
2031 – 2036 (USD Million) …………………………………………254
TABLE NO. 206. : Poland Sports Hospitality Market Revenue, By Channel,
2018 – 2024 (USD Million) …………………………………………255
TABLE NO. 207. : Poland Sports Hospitality Market Revenue, By Channel,
2025 – 2030 (USD Million) …………………………………………255
TABLE NO. 208. : Poland Sports Hospitality Market Revenue, By Channel,
2031 – 2036 (USD Million) …………………………………………256
TABLE NO. 209. : Poland Sports Hospitality Market Revenue, By Attendee
Type, 2018 – 2024 (USD Million)…………………………………257
TABLE NO. 210. : Poland Sports Hospitality Market Revenue, By Attendee
Type, 2025 – 2030 (USD Million)…………………………………257
TABLE NO. 211. : Poland Sports Hospitality Market Revenue, By Attendee
Type, 2031 – 2036 (USD Million)…………………………………258
TABLE NO. 212. : Poland Sports Hospitality Market Revenue, By Revenue
Streams, 2025 – 2030 (USD Million) ……………………………259
TABLE NO. 213. : Poland Sports Hospitality Market Revenue, By Revenue
Streams, 2018 – 2024 (USD Million) ……………………………259
TABLE NO. 214. : Poland Sports Hospitality Market Revenue, By Revenue
Streams, 2031 – 2036 (USD Million) ……………………………260
TABLE NO. 215. : Portugal Sports Hospitality Market Revenue, By Service
Type, 2018 – 2024 (USD Million)…………………………………261
TABLE NO. 216. : Portugal Sports Hospitality Market Revenue, By Service
Type, 2025 – 2030 (USD Million)…………………………………261
TABLE NO. 217. : Portugal Sports Hospitality Market Revenue, By Service
Type, 2031 – 2036 (USD Million)…………………………………262
TABLE NO. 218. : Portugal Sports Hospitality Market Revenue, By Channel,
2018 – 2024 (USD Million)………………………………………… 263
TABLE NO. 219. : Portugal Sports Hospitality Market Revenue, By Channel,
2025 – 2030 (USD Million)………………………………………… 263
TABLE NO. 220. : Portugal Sports Hospitality Market Revenue, By Channel,
2031 – 2036 (USD Million)………………………………………… 264
TABLE NO. 221. : Portugal Sports Hospitality Market Revenue, By Attendee
Type, 2018 – 2024 (USD Million) ……………………………….. 265
TABLE NO. 222. : Portugal Sports Hospitality Market Revenue, By Attendee
Type, 2025 – 2030 (USD Million) ……………………………….. 265
TABLE NO. 223. : Portugal Sports Hospitality Market Revenue, By Attendee
Type, 2031 – 2036 (USD Million) ……………………………….. 266
TABLE NO. 224. : Portugal Sports Hospitality Market Revenue, By Revenue
Streams, 2025 – 2030 (USD Million)…………………………… 267
TABLE NO. 225. : Portugal Sports Hospitality Market Revenue, By Revenue
Streams, 2018 – 2024 (USD Million)…………………………… 267
TABLE NO. 226. : Denmark Sports Hospitality Market Revenue, By Revenue
Streams, 2031 – 2036 (USD Million)…………………………… 268
TABLE NO. 227. : Rest of Europe Sports Hospitality Market Revenue, By
Service Type, 2018 – 2024 (USD Million)…………………….. 269
TABLE NO. 228. : Rest of Europe Sports Hospitality Market Revenue, By
Service Type, 2025 – 2030 (USD Million)…………………….. 269
TABLE NO. 229. : Rest of Europe Sports Hospitality Market Revenue, By
Service Type, 2031 – 2036 (USD Million)…………………….. 270
TABLE NO. 230. : Rest of Europe Sports Hospitality Market Revenue, By
Channel, 2018 – 2024 (USD Million)…………………………… 271
TABLE NO. 231. : Rest of Europe Sports Hospitality Market Revenue, By
Channel, 2025 – 2030 (USD Million)…………………………… 271
TABLE NO. 232. : Rest of Europe Sports Hospitality Market Revenue, By
Channel, 2031 – 2036 (USD Million) ……………………………272
TABLE NO. 233. : Rest of Europe Sports Hospitality Market Revenue, By
Attendee Type, 2018 – 2024 (USD Million)…………………..273
TABLE NO. 234. : Rest of Europe Sports Hospitality Market Revenue, By
Attendee Type, 2025 – 2030 (USD Million)…………………..273
TABLE NO. 235. : Rest of Europe Sports Hospitality Market Revenue, By
Attendee Type, 2031 – 2036 (USD Million)…………………..274
TABLE NO. 236. : Rest of Europe Sports Hospitality Market Revenue, By
Revenue Streams, 2025 – 2030 (USD Million) ………………275
TABLE NO. 237. : Rest of Europe Sports Hospitality Market Revenue, By
Revenue Streams, 2018 – 2024 (USD Million) ………………275
TABLE NO. 238. : Rest of Europe Sports Hospitality Market Revenue, By
Revenue Streams, 2031 – 2036 (USD Million) ………………276
TABLE NO. 239. : Asia Pacific Sports Hospitality Market Revenue, By Country,
2018 – 2024 (USD Million) …………………………………………278
TABLE NO. 240. : Asia Pacific Sports Hospitality Market Revenue, By Country,
2025 – 2030 (USD Million) …………………………………………279
TABLE NO. 241. : Asia Pacific Sports Hospitality Market Revenue, By Country,
2031 – 2036 (USD Million) …………………………………………280
TABLE NO. 242. : Asia Pacific Sports Hospitality Market Revenue, By Service
Type, 2018 – 2024 (USD Million)…………………………………281
TABLE NO. 243. : Asia Pacific Sports Hospitality Market Revenue, By Service
Type, 2025 – 2030 (USD Million)…………………………………281
TABLE NO. 244. : Asia Pacific Sports Hospitality Market Revenue, By Service
Type, 2031 – 2036 (USD Million)…………………………………282
TABLE NO. 245. : Asia Pacific Sports Hospitality Market Revenue, By Channel,
2018 – 2024 (USD Million) …………………………………………283
TABLE NO. 246. : Asia Pacific Sports Hospitality Market Revenue, By Channel,
2025 – 2030 (USD Million)………………………………………… 283
TABLE NO. 247. : Asia Pacific Sports Hospitality Market Revenue, By Channel,
2031 – 2036 (USD Million)………………………………………… 284
TABLE NO. 248. : Asia Pacific Sports Hospitality Market Revenue, By Attendee
Type, 2018 – 2024 (USD Million) ……………………………….. 285
TABLE NO. 249. : Asia Pacific Sports Hospitality Market Revenue, By Attendee
Type, 2025 – 2030 (USD Million) ……………………………….. 285
TABLE NO. 250. : Asia Pacific Sports Hospitality Market Revenue, By Attendee
Type, 2031 – 2036 (USD Million) ……………………………….. 286
TABLE NO. 251. : Asia Pacific Sports Hospitality Market Revenue, By Revenue
Streams, 2025 – 2030 (USD Million)…………………………… 287
TABLE NO. 252. : Asia Pacific Sports Hospitality Market Revenue, By Revenue
Streams, 2018 – 2024 (USD Million)…………………………… 287
TABLE NO. 253. : Asia Pacific Sports Hospitality Market Revenue, By Revenue
Streams, 2031 – 2036 (USD Million)…………………………… 288
TABLE NO. 254. : China Sports Hospitality Market Revenue, By Service Type,
2018 – 2024 (USD Million)………………………………………… 289
TABLE NO. 255. : China Sports Hospitality Market Revenue, By Service Type,
2025 – 2030 (USD Million)………………………………………… 289
TABLE NO. 256. : China Sports Hospitality Market Revenue, By Service Type,
2031 – 2036 (USD Million)………………………………………… 290
TABLE NO. 257. : China Sports Hospitality Market Revenue, By Channel, 2018
– 2024 (USD Million)………………………………………………… 291
TABLE NO. 258. : China Sports Hospitality Market Revenue, By Channel, 2025
– 2030 (USD Million)………………………………………………… 291
TABLE NO. 259. : China Sports Hospitality Market Revenue, By Channel, 2031
– 2036 (USD Million)………………………………………………… 292
TABLE NO. 260. : China Sports Hospitality Market Revenue, By Attendee
Type, 2018 – 2024 (USD Million)…………………………………293
TABLE NO. 261. : China Sports Hospitality Market Revenue, By Attendee
Type, 2025 – 2030 (USD Million)…………………………………293
TABLE NO. 262. : China Sports Hospitality Market Revenue, By Attendee
Type, 2031 – 2036 (USD Million)…………………………………294
TABLE NO. 263. : China Sports Hospitality Market Revenue, By Revenue
Streams, 2025 – 2030 (USD Million) ……………………………295
TABLE NO. 264. : China Sports Hospitality Market Revenue, By Revenue
Streams, 2018 – 2024 (USD Million) ……………………………295
TABLE NO. 265. : China Sports Hospitality Market Revenue, By Revenue
Streams, 2031 – 2036 (USD Million) ……………………………296
TABLE NO. 266. : Japan Sports Hospitality Market Revenue, By Service Type,
2018 – 2024 (USD Million) …………………………………………297
TABLE NO. 267. : Japan Sports Hospitality Market Revenue, By Service Type,
2025 – 2030 (USD Million) …………………………………………297
TABLE NO. 268. : Japan Sports Hospitality Market Revenue, By Service Type,
2031 – 2036 (USD Million) …………………………………………298
TABLE NO. 269. : Japan Sports Hospitality Market Revenue, By Channel, 2018
– 2024 (USD Million) …………………………………………………299
TABLE NO. 270. : Japan Sports Hospitality Market Revenue, By Channel, 2025
– 2030 (USD Million) …………………………………………………299
TABLE NO. 271. : Japan Sports Hospitality Market Revenue, By Channel, 2031
– 2036 (USD Million) …………………………………………………300
TABLE NO. 272. : Japan Sports Hospitality Market Revenue, By Attendee
Type, 2018 – 2024 (USD Million)…………………………………301
TABLE NO. 273. : Japan Sports Hospitality Market Revenue, By Attendee
Type, 2025 – 2030 (USD Million)…………………………………301
TABLE NO. 274. : Japan Sports Hospitality Market Revenue, By Attendee
Type, 2031 – 2036 (USD Million) ……………………………….. 302
TABLE NO. 275. : Japan Sports Hospitality Market Revenue, By Revenue
Streams, 2025 – 2030 (USD Million)…………………………… 303
TABLE NO. 276. : Japan Sports Hospitality Market Revenue, By Revenue
Streams, 2018 – 2024 (USD Million)…………………………… 303
TABLE NO. 277. : Japan Sports Hospitality Market Revenue, By Revenue
Streams, 2031 – 2036 (USD Million)…………………………… 304
TABLE NO. 278. : South Korea Sports Hospitality Market Revenue, By Service
Type, 2018 – 2024 (USD Million) ……………………………….. 305
TABLE NO. 279. : South Korea Sports Hospitality Market Revenue, By Service
Type, 2025 – 2030 (USD Million) ……………………………….. 305
TABLE NO. 280. : South Korea Sports Hospitality Market Revenue, By Service
Type, 2031 – 2036 (USD Million) ……………………………….. 306
TABLE NO. 281. : South Korea Sports Hospitality Market Revenue, By
Channel, 2018 – 2024 (USD Million)…………………………… 307
TABLE NO. 282. : South Korea Sports Hospitality Market Revenue, By
Channel, 2025 – 2030 (USD Million)…………………………… 307
TABLE NO. 283. : South Korea Sports Hospitality Market Revenue, By
Channel, 2031 – 2036 (USD Million)…………………………… 308
TABLE NO. 284. : South Korea Sports Hospitality Market Revenue, By
Attendee Type, 2018 – 2024 (USD Million) …………………. 309
TABLE NO. 285. : South Korea Sports Hospitality Market Revenue, By
Attendee Type, 2025 – 2030 (USD Million) …………………. 309
TABLE NO. 286. : South Korea Sports Hospitality Market Revenue, By
Attendee Type, 2031 – 2036 (USD Million) …………………. 310
TABLE NO. 287. : South Korea Sports Hospitality Market Revenue, By
Revenue Streams, 2025 – 2030 (USD Million)……………… 311
TABLE NO. 288. : South Korea Sports Hospitality Market Revenue, By
Revenue Streams, 2018 – 2024 (USD Million) ………………311
TABLE NO. 289. : South Korea Sports Hospitality Market Revenue, By
Revenue Streams, 2031 – 2036 (USD Million) ………………312
TABLE NO. 290. : India Sports Hospitality Market Revenue, By Service Type,
2018 – 2024 (USD Million) …………………………………………313
TABLE NO. 291. : India Sports Hospitality Market Revenue, By Service Type,
2025 – 2030 (USD Million) …………………………………………313
TABLE NO. 292. : India Sports Hospitality Market Revenue, By Service Type,
2031 – 2036 (USD Million) …………………………………………314
TABLE NO. 293. : India Sports Hospitality Market Revenue, By Channel, 2018
– 2024 (USD Million) …………………………………………………315
TABLE NO. 294. : India Sports Hospitality Market Revenue, By Channel, 2025
– 2030 (USD Million) …………………………………………………315
TABLE NO. 295. : India Sports Hospitality Market Revenue, By Channel, 2031
– 2036 (USD Million) …………………………………………………316
TABLE NO. 296. : India Sports Hospitality Market Revenue, By Attendee Type,
2018 – 2024 (USD Million) …………………………………………317
TABLE NO. 297. : India Sports Hospitality Market Revenue, By Attendee Type,
2025 – 2030 (USD Million) …………………………………………317
TABLE NO. 298. : India Sports Hospitality Market Revenue, By Attendee Type,
2031 – 2036 (USD Million) …………………………………………318
TABLE NO. 299. : India Sports Hospitality Market Revenue, By Revenue
Streams, 2025 – 2030 (USD Million) ……………………………319
TABLE NO. 300. : India Sports Hospitality Market Revenue, By Revenue
Streams, 2018 – 2024 (USD Million) ……………………………319
TABLE NO. 301. : India Sports Hospitality Market Revenue, By Revenue
Streams, 2031 – 2036 (USD Million) ……………………………320
TABLE NO. 302. : Australia Sports Hospitality Market Revenue, By Service
Type, 2018 – 2024 (USD Million) ……………………………….. 321
TABLE NO. 303. : Australia Sports Hospitality Market Revenue, By Service
Type, 2025 – 2030 (USD Million) ……………………………….. 321
TABLE NO. 304. : Australia Sports Hospitality Market Revenue, By Service
Type, 2031 – 2036 (USD Million) ……………………………….. 322
TABLE NO. 305. : Australia Sports Hospitality Market Revenue, By Channel,
2018 – 2024 (USD Million)………………………………………… 323
TABLE NO. 306. : Australia Sports Hospitality Market Revenue, By Channel,
2025 – 2030 (USD Million)………………………………………… 323
TABLE NO. 307. : Australia Sports Hospitality Market Revenue, By Channel,
2031 – 2036 (USD Million)………………………………………… 324
TABLE NO. 308. : Australia Sports Hospitality Market Revenue, By Attendee
Type, 2018 – 2024 (USD Million) ……………………………….. 325
TABLE NO. 309. : Australia Sports Hospitality Market Revenue, By Attendee
Type, 2025 – 2030 (USD Million) ……………………………….. 325
TABLE NO. 310. : Australia Sports Hospitality Market Revenue, By Attendee
Type, 2031 – 2036 (USD Million) ……………………………….. 326
TABLE NO. 311. : Australia Sports Hospitality Market Revenue, By Revenue
Streams, 2025 – 2030 (USD Million)…………………………… 327
TABLE NO. 312. : Australia Sports Hospitality Market Revenue, By Revenue
Streams, 2018 – 2024 (USD Million)…………………………… 327
TABLE NO. 313. : Australia Sports Hospitality Market Revenue, By Revenue
Streams, 2031 – 2036 (USD Million)…………………………… 328
TABLE NO. 314. : Thailand Sports Hospitality Market Revenue, By Service
Type, 2018 – 2024 (USD Million) ……………………………….. 329
TABLE NO. 315. : Thailand Sports Hospitality Market Revenue, By Service
Type, 2025 – 2030 (USD Million) ……………………………….. 329
TABLE NO. 316. : Thailand Sports Hospitality Market Revenue, By Service
Type, 2031 – 2036 (USD Million)…………………………………330
TABLE NO. 317. : Thailand Sports Hospitality Market Revenue, By Channel,
2018 – 2024 (USD Million) …………………………………………331
TABLE NO. 318. : Thailand Sports Hospitality Market Revenue, By Channel,
2025 – 2030 (USD Million) …………………………………………331
TABLE NO. 319. : Thailand Sports Hospitality Market Revenue, By Channel,
2031 – 2036 (USD Million) …………………………………………332
TABLE NO. 320. : Thailand Sports Hospitality Market Revenue, By Attendee
Type, 2018 – 2024 (USD Million)…………………………………333
TABLE NO. 321. : Thailand Sports Hospitality Market Revenue, By Attendee
Type, 2025 – 2030 (USD Million)…………………………………333
TABLE NO. 322. : Thailand Sports Hospitality Market Revenue, By Attendee
Type, 2031 – 2036 (USD Million)…………………………………334
TABLE NO. 323. : Thailand Sports Hospitality Market Revenue, By Revenue
Streams, 2025 – 2030 (USD Million) ……………………………335
TABLE NO. 324. : Thailand Sports Hospitality Market Revenue, By Revenue
Streams, 2018 – 2024 (USD Million) ……………………………335
TABLE NO. 325. : Thailand Sports Hospitality Market Revenue, By Revenue
Streams, 2031 – 2036 (USD Million) ……………………………336
TABLE NO. 326. : Indonesia Sports Hospitality Market Revenue, By Service
Type, 2018 – 2024 (USD Million)…………………………………337
TABLE NO. 327. : Indonesia Sports Hospitality Market Revenue, By Service
Type, 2025 – 2030 (USD Million)…………………………………337
TABLE NO. 328. : Indonesia Sports Hospitality Market Revenue, By Service
Type, 2031 – 2036 (USD Million)…………………………………338
TABLE NO. 329. : Indonesia Sports Hospitality Market Revenue, By Channel,
2018 – 2024 (USD Million) …………………………………………339
TABLE NO. 330. : Indonesia Sports Hospitality Market Revenue, By Channel,
2025 – 2030 (USD Million)………………………………………… 339
TABLE NO. 331. : Indonesia Sports Hospitality Market Revenue, By Channel,
2031 – 2036 (USD Million)………………………………………… 340
TABLE NO. 332. : Indonesia Sports Hospitality Market Revenue, By Attendee
Type, 2018 – 2024 (USD Million) ……………………………….. 341
TABLE NO. 333. : Indonesia Sports Hospitality Market Revenue, By Attendee
Type, 2025 – 2030 (USD Million) ……………………………….. 341
TABLE NO. 334. : Indonesia Sports Hospitality Market Revenue, By Attendee
Type, 2031 – 2036 (USD Million) ……………………………….. 342
TABLE NO. 335. : Indonesia Sports Hospitality Market Revenue, By Revenue
Streams, 2025 – 2030 (USD Million)…………………………… 343
TABLE NO. 336. : Indonesia Sports Hospitality Market Revenue, By Revenue
Streams, 2018 – 2024 (USD Million)…………………………… 343
TABLE NO. 337. : Indonesia Sports Hospitality Market Revenue, By Revenue
Streams, 2031 – 2036 (USD Million)…………………………… 344
TABLE NO. 338. : Vietnam Sports Hospitality Market Revenue, By Service
Type, 2018 – 2024 (USD Million) ……………………………….. 345
TABLE NO. 339. : Vietnam Sports Hospitality Market Revenue, By Service
Type, 2025 – 2030 (USD Million) ……………………………….. 345
TABLE NO. 340. : Vietnam Sports Hospitality Market Revenue, By Service
Type, 2031 – 2036 (USD Million) ……………………………….. 346
TABLE NO. 341. : Vietnam Sports Hospitality Market Revenue, By Channel,
2018 – 2024 (USD Million)………………………………………… 347
TABLE NO. 342. : Vietnam Sports Hospitality Market Revenue, By Channel,
2025 – 2030 (USD Million)………………………………………… 347
TABLE NO. 343. : Vietnam Sports Hospitality Market Revenue, By Channel,
2031 – 2036 (USD Million)………………………………………… 348
TABLE NO. 344. : Vietnam Sports Hospitality Market Revenue, By Attendee
Type, 2018 – 2024 (USD Million)…………………………………349
TABLE NO. 345. : Vietnam Sports Hospitality Market Revenue, By Attendee
Type, 2025 – 2030 (USD Million)…………………………………349
TABLE NO. 346. : Vietnam Sports Hospitality Market Revenue, By Attendee
Type, 2031 – 2036 (USD Million)…………………………………350
TABLE NO. 347. : Vietnam Sports Hospitality Market Revenue, By Revenue
Streams, 2025 – 2030 (USD Million) ……………………………351
TABLE NO. 348. : Vietnam Sports Hospitality Market Revenue, By Revenue
Streams, 2018 – 2024 (USD Million) ……………………………351
TABLE NO. 349. : Vietnam Sports Hospitality Market Revenue, By Revenue
Streams, 2031 – 2036 (USD Million) ……………………………352
TABLE NO. 350. : Malaysia Sports Hospitality Market Revenue, By Service
Type, 2018 – 2024 (USD Million)…………………………………353
TABLE NO. 351. : Malaysia Sports Hospitality Market Revenue, By Service
Type, 2025 – 2030 (USD Million)…………………………………353
TABLE NO. 352. : Malaysia Sports Hospitality Market Revenue, By Service
Type, 2031 – 2036 (USD Million)…………………………………354
TABLE NO. 353. : Malaysia Sports Hospitality Market Revenue, By Channel,
2018 – 2024 (USD Million) …………………………………………355
TABLE NO. 354. : Malaysia Sports Hospitality Market Revenue, By Channel,
2025 – 2030 (USD Million) …………………………………………355
TABLE NO. 355. : Malaysia Sports Hospitality Market Revenue, By Channel,
2031 – 2036 (USD Million) …………………………………………356
TABLE NO. 356. : Malaysia Sports Hospitality Market Revenue, By Attendee
Type, 2018 – 2024 (USD Million)…………………………………357
TABLE NO. 357. : Malaysia Sports Hospitality Market Revenue, By Attendee
Type, 2025 – 2030 (USD Million)…………………………………357
TABLE NO. 358. : Malaysia Sports Hospitality Market Revenue, By Attendee
Type, 2031 – 2036 (USD Million) ……………………………….. 358
TABLE NO. 359. : Malaysia Sports Hospitality Market Revenue, By Revenue
Streams, 2025 – 2030 (USD Million)…………………………… 359
TABLE NO. 360. : Malaysia Sports Hospitality Market Revenue, By Revenue
Streams, 2018 – 2024 (USD Million)…………………………… 359
TABLE NO. 361. : Malaysia Sports Hospitality Market Revenue, By Revenue
Streams, 2031 – 2036 (USD Million)…………………………… 360
TABLE NO. 362. : Singapore Sports Hospitality Market Revenue, By Service
Type, 2018 – 2024 (USD Million) ……………………………….. 361
TABLE NO. 363. : Singapore Sports Hospitality Market Revenue, By Service
Type, 2025 – 2030 (USD Million) ……………………………….. 361
TABLE NO. 364. : Singapore Sports Hospitality Market Revenue, By Service
Type, 2031 – 2036 (USD Million) ……………………………….. 362
TABLE NO. 365. : Singapore Sports Hospitality Market Revenue, By Channel,
2018 – 2024 (USD Million)………………………………………… 363
TABLE NO. 366. : Singapore Sports Hospitality Market Revenue, By Channel,
2025 – 2030 (USD Million)………………………………………… 363
TABLE NO. 367. : Singapore Sports Hospitality Market Revenue, By Channel,
2031 – 2036 (USD Million)………………………………………… 364
TABLE NO. 368. : Singapore Sports Hospitality Market Revenue, By Attendee
Type, 2018 – 2024 (USD Million) ……………………………….. 365
TABLE NO. 369. : Singapore Sports Hospitality Market Revenue, By Attendee
Type, 2025 – 2030 (USD Million) ……………………………….. 365
TABLE NO. 370. : Singapore Sports Hospitality Market Revenue, By Attendee
Type, 2031 – 2036 (USD Million) ……………………………….. 366
TABLE NO. 371. : Singapore Sports Hospitality Market Revenue, By Revenue
Streams, 2025 – 2030 (USD Million)…………………………… 367
TABLE NO. 372. : Singapore Sports Hospitality Market Revenue, By Revenue
Streams, 2018 – 2024 (USD Million) ……………………………367
TABLE NO. 373. : Singapore Sports Hospitality Market Revenue, By Revenue
Streams, 2031 – 2036 (USD Million) ……………………………368
TABLE NO. 374. : Philippines Sports Hospitality Market Revenue, By Service
Type, 2018 – 2024 (USD Million)…………………………………369
TABLE NO. 375. : Philippines Sports Hospitality Market Revenue, By Service
Type, 2025 – 2030 (USD Million)…………………………………369
TABLE NO. 376. : Philippines Sports Hospitality Market Revenue, By Service
Type, 2031 – 2036 (USD Million)…………………………………370
TABLE NO. 377. : Philippines Sports Hospitality Market Revenue, By Channel,
2018 – 2024 (USD Million) …………………………………………371
TABLE NO. 378. : Philippines Sports Hospitality Market Revenue, By Channel,
2025 – 2030 (USD Million) …………………………………………371
TABLE NO. 379. : Philippines Sports Hospitality Market Revenue, By Channel,
2031 – 2036 (USD Million) …………………………………………372
TABLE NO. 380. : Philippines Sports Hospitality Market Revenue, By Attendee
Type, 2018 – 2024 (USD Million)…………………………………373
TABLE NO. 381. : Philippines Sports Hospitality Market Revenue, By Attendee
Type, 2025 – 2030 (USD Million)…………………………………373
TABLE NO. 382. : Philippines Sports Hospitality Market Revenue, By Attendee
Type, 2031 – 2036 (USD Million)…………………………………374
TABLE NO. 383. : Philippines Sports Hospitality Market Revenue, By Revenue
Streams, 2025 – 2030 (USD Million) ……………………………375
TABLE NO. 384. : Philippines Sports Hospitality Market Revenue, By Revenue
Streams, 2018 – 2024 (USD Million) ……………………………375
TABLE NO. 385. : Philippines Sports Hospitality Market Revenue, By Revenue
Streams, 2031 – 2036 (USD Million) ……………………………376
TABLE NO. 386. : Taiwan Sports Hospitality Market Revenue, By Service Type,
2018 – 2024 (USD Million)………………………………………… 377
TABLE NO. 387. : Taiwan Sports Hospitality Market Revenue, By Service Type,
2025 – 2030 (USD Million)………………………………………… 377
TABLE NO. 388. : Taiwan Sports Hospitality Market Revenue, By Service Type,
2031 – 2036 (USD Million)………………………………………… 378
TABLE NO. 389. : Taiwan Sports Hospitality Market Revenue, By Channel,
2018 – 2024 (USD Million)………………………………………… 379
TABLE NO. 390. : Taiwan Sports Hospitality Market Revenue, By Channel,
2025 – 2030 (USD Million)………………………………………… 379
TABLE NO. 391. : Taiwan Sports Hospitality Market Revenue, By Channel,
2031 – 2036 (USD Million)………………………………………… 380
TABLE NO. 392. : Taiwan Sports Hospitality Market Revenue, By Attendee
Type, 2018 – 2024 (USD Million) ……………………………….. 381
TABLE NO. 393. : Taiwan Sports Hospitality Market Revenue, By Attendee
Type, 2025 – 2030 (USD Million) ……………………………….. 381
TABLE NO. 394. : Taiwan Sports Hospitality Market Revenue, By Attendee
Type, 2031 – 2036 (USD Million) ……………………………….. 382
TABLE NO. 395. : Taiwan Sports Hospitality Market Revenue, By Revenue
Streams, 2025 – 2030 (USD Million)…………………………… 383
TABLE NO. 396. : Taiwan Sports Hospitality Market Revenue, By Revenue
Streams, 2018 – 2024 (USD Million)…………………………… 383
TABLE NO. 397. : Taiwan Sports Hospitality Market Revenue, By Revenue
Streams, 2031 – 2036 (USD Million)…………………………… 384
TABLE NO. 398. : Rest of Asia Pacific Sports Hospitality Market Revenue, By
Service Type, 2018 – 2024 (USD Million)…………………….. 385
TABLE NO. 399. : Rest of Asia Pacific Sports Hospitality Market Revenue, By
Service Type, 2025 – 2030 (USD Million)…………………….. 385
TABLE NO. 400. : Rest of Asia Pacific Sports Hospitality Market Revenue, By
Service Type, 2031 – 2036 (USD Million) ……………………..386
TABLE NO. 401. : Rest of Asia Pacific Sports Hospitality Market Revenue, By
Channel, 2018 – 2024 (USD Million) ……………………………387
TABLE NO. 402. : Rest of Asia Pacific Sports Hospitality Market Revenue, By
Channel, 2025 – 2030 (USD Million) ……………………………387
TABLE NO. 403. : Rest of Asia Pacific Sports Hospitality Market Revenue, By
Channel, 2031 – 2036 (USD Million) ……………………………388
TABLE NO. 404. : Rest of Asia Pacific Sports Hospitality Market Revenue, By
Attendee Type, 2018 – 2024 (USD Million)…………………..389
TABLE NO. 405. : Rest of Asia Pacific Sports Hospitality Market Revenue, By
Attendee Type, 2025 – 2030 (USD Million)…………………..389
TABLE NO. 406. : Rest of Asia Pacific Sports Hospitality Market Revenue, By
Attendee Type, 2031 – 2036 (USD Million)…………………..390
TABLE NO. 407. : Rest of Asia Pacific Sports Hospitality Market Revenue, By
Revenue Streams, 2025 – 2030 (USD Million) ………………391
TABLE NO. 408. : Rest of Asia Pacific Sports Hospitality Market Revenue, By
Revenue Streams, 2018 – 2024 (USD Million) ………………391
TABLE NO. 409. : Rest of Asia Pacific Sports Hospitality Market Revenue, By
Revenue Streams, 2031 – 2036 (USD Million) ………………392
TABLE NO. 410. : Latin America Sports Hospitality Market Revenue, By
Country, 2018 – 2024 (USD Million) ……………………………394
TABLE NO. 411. : Latin America Sports Hospitality Market Revenue, By
Country, 2025 – 2030 (USD Million) ……………………………395
TABLE NO. 412. : Latin America Sports Hospitality Market Revenue, By
Country, 2031 – 2036 (USD Million) ……………………………396
TABLE NO. 413. : Latin America Sports Hospitality Market Revenue, By
Service Type, 2018 – 2024 (USD Million) ……………………..397
TABLE NO. 414. : Latin America Sports Hospitality Market Revenue, By
Service Type, 2025 – 2030 (USD Million)…………………….. 397
TABLE NO. 415. : Latin America Sports Hospitality Market Revenue, By
Service Type, 2031 – 2036 (USD Million)…………………….. 398
TABLE NO. 416. : Latin America Sports Hospitality Market Revenue, By
Channel, 2025 – 2030 (USD Million)…………………………… 399
TABLE NO. 417. : Latin America Sports Hospitality Market Revenue, By
Service Type, 2018 – 2024 (USD Million)…………………….. 399
TABLE NO. 418. : Latin America Sports Hospitality Market Revenue, By
Channel, 2031 – 2036 (USD Million)…………………………… 400
TABLE NO. 419. : Latin America Sports Hospitality Market Revenue, By
Attendee Type, 2018 – 2024 (USD Million) …………………. 401
TABLE NO. 420. : Latin America Sports Hospitality Market Revenue, By
Attendee Type, 2025 – 2030 (USD Million) …………………. 401
TABLE NO. 421. : Latin America Sports Hospitality Market Revenue, By
Attendee Type, 2031 – 2036 (USD Million) …………………. 402
TABLE NO. 422. : Latin America Sports Hospitality Market Revenue, By
Revenue Streams, 2025 – 2030 (USD Million)……………… 403
TABLE NO. 423. : Latin America Sports Hospitality Market Revenue, By
Revenue Streams, 2018 – 2024 (USD Million)……………… 403
TABLE NO. 424. : Latin America Sports Hospitality Market Revenue, By
Revenue Streams, 2031 – 2036 (USD Million)……………… 404
TABLE NO. 425. : Brazil Sports Hospitality Market Revenue, By Service Type,
2018 – 2024 (USD Million)………………………………………… 405
TABLE NO. 426. : Brazil Sports Hospitality Market Revenue, By Service Type,
2025 – 2030 (USD Million)………………………………………… 405
TABLE NO. 427. : Brazil Sports Hospitality Market Revenue, By Service Type,
2031 – 2036 (USD Million)………………………………………… 406
TABLE NO. 428. : Brazil Sports Hospitality Market Revenue, By Channel, 2018
– 2024 (USD Million) …………………………………………………407
TABLE NO. 429. : Brazil Sports Hospitality Market Revenue, By Channel, 2025
– 2030 (USD Million) …………………………………………………407
TABLE NO. 430. : Brazil Sports Hospitality Market Revenue, By Channel, 2031
– 2036 (USD Million) …………………………………………………408
TABLE NO. 431. : Brazil Sports Hospitality Market Revenue, By Attendee
Type, 2018 – 2024 (USD Million)…………………………………409
TABLE NO. 432. : Brazil Sports Hospitality Market Revenue, By Attendee
Type, 2025 – 2030 (USD Million)…………………………………409
TABLE NO. 433. : Brazil Sports Hospitality Market Revenue, By Attendee
Type, 2031 – 2036 (USD Million)…………………………………410
TABLE NO. 434. : Brazil Sports Hospitality Market Revenue, By Revenue
Streams, 2025 – 2030 (USD Million) ……………………………411
TABLE NO. 435. : Brazil Sports Hospitality Market Revenue, By Revenue
Streams, 2018 – 2024 (USD Million) ……………………………411
TABLE NO. 436. : Brazil Sports Hospitality Market Revenue, By Revenue
Streams, 2031 – 2036 (USD Million) ……………………………412
TABLE NO. 437. : Argentina Sports Hospitality Market Revenue, By Service
Type, 2018 – 2024 (USD Million)…………………………………413
TABLE NO. 438. : Argentina Sports Hospitality Market Revenue, By Service
Type, 2025 – 2030 (USD Million)…………………………………413
TABLE NO. 439. : Argentina Sports Hospitality Market Revenue, By Service
Type, 2031 – 2036 (USD Million)…………………………………414
TABLE NO. 440. : Argentina Sports Hospitality Market Revenue, By Channel,
2018 – 2024 (USD Million) …………………………………………415
TABLE NO. 441. : Argentina Sports Hospitality Market Revenue, By Channel,
2025 – 2030 (USD Million) …………………………………………415
TABLE NO. 442. : Argentina Sports Hospitality Market Revenue, By Channel,
2031 – 2036 (USD Million)………………………………………… 416
TABLE NO. 443. : Argentina Sports Hospitality Market Revenue, By Attendee
Type, 2018 – 2024 (USD Million) ……………………………….. 417
TABLE NO. 444. : Argentina Sports Hospitality Market Revenue, By Attendee
Type, 2025 – 2030 (USD Million) ……………………………….. 417
TABLE NO. 445. : Argentina Sports Hospitality Market Revenue, By Attendee
Type, 2031 – 2036 (USD Million) ……………………………….. 418
TABLE NO. 446. : Argentina Sports Hospitality Market Revenue, By Revenue
Streams, 2025 – 2030 (USD Million)…………………………… 419
TABLE NO. 447. : Argentina Sports Hospitality Market Revenue, By Revenue
Streams, 2018 – 2024 (USD Million)…………………………… 419
TABLE NO. 448. : Argentina Sports Hospitality Market Revenue, By Revenue
Streams, 2031 – 2036 (USD Million)…………………………… 420
TABLE NO. 449. : Peru Sports Hospitality Market Revenue, By Service Type,
2018 – 2024 (USD Million)………………………………………… 421
TABLE NO. 450. : Peru Sports Hospitality Market Revenue, By Service Type,
2025 – 2030 (USD Million)………………………………………… 421
TABLE NO. 451. : Peru Sports Hospitality Market Revenue, By Service Type,
2031 – 2036 (USD Million)………………………………………… 422
TABLE NO. 452. : Peru Sports Hospitality Market Revenue, By Channel, 2018
– 2024 (USD Million)………………………………………………… 423
TABLE NO. 453. : Peru Sports Hospitality Market Revenue, By Channel, 2025
– 2030 (USD Million)………………………………………………… 423
TABLE NO. 454. : Peru Sports Hospitality Market Revenue, By Channel, 2031
– 2036 (USD Million)………………………………………………… 424
TABLE NO. 455. : Peru Sports Hospitality Market Revenue, By Attendee Type,
2018 – 2024 (USD Million)………………………………………… 425
TABLE NO. 456. : Peru Sports Hospitality Market Revenue, By Attendee Type,
2025 – 2030 (USD Million) …………………………………………425
TABLE NO. 457. : Peru Sports Hospitality Market Revenue, By Attendee Type,
2031 – 2036 (USD Million) …………………………………………426
TABLE NO. 458. : Peru Sports Hospitality Market Revenue, By Revenue
Streams, 2025 – 2030 (USD Million) ……………………………427
TABLE NO. 459. : Peru Sports Hospitality Market Revenue, By Revenue
Streams, 2018 – 2024 (USD Million) ……………………………427
TABLE NO. 460. : Peru Sports Hospitality Market Revenue, By Revenue
Streams, 2031 – 2036 (USD Million) ……………………………428
TABLE NO. 461. : Chile Sports Hospitality Market Revenue, By Service Type,
2018 – 2024 (USD Million) …………………………………………429
TABLE NO. 462. : Chile Sports Hospitality Market Revenue, By Service Type,
2025 – 2030 (USD Million) …………………………………………429
TABLE NO. 463. : Chile Sports Hospitality Market Revenue, By Service Type,
2031 – 2036 (USD Million) …………………………………………430
TABLE NO. 464. : Chile Sports Hospitality Market Revenue, By Channel, 2018
– 2024 (USD Million) …………………………………………………431
TABLE NO. 465. : Chile Sports Hospitality Market Revenue, By Channel, 2025
– 2030 (USD Million) …………………………………………………431
TABLE NO. 466. : Chile Sports Hospitality Market Revenue, By Channel, 2031
– 2036 (USD Million) …………………………………………………432
TABLE NO. 467. : Chile Sports Hospitality Market Revenue, By Attendee Type,
2018 – 2024 (USD Million) …………………………………………433
TABLE NO. 468. : Chile Sports Hospitality Market Revenue, By Attendee Type,
2025 – 2030 (USD Million) …………………………………………433
TABLE NO. 469. : Chile Sports Hospitality Market Revenue, By Attendee Type,
2031 – 2036 (USD Million) …………………………………………434
TABLE NO. 470. : Chile Sports Hospitality Market Revenue, By Revenue
Streams, 2025 – 2030 (USD Million)…………………………… 435
TABLE NO. 471. : Chile Sports Hospitality Market Revenue, By Revenue
Streams, 2018 – 2024 (USD Million)…………………………… 435
TABLE NO. 472. : Chile Sports Hospitality Market Revenue, By Revenue
Streams, 2031 – 2036 (USD Million)…………………………… 436
TABLE NO. 473. : Colombia Sports Hospitality Market Revenue, By Service
Type, 2018 – 2024 (USD Million) ……………………………….. 437
TABLE NO. 474. : Colombia Sports Hospitality Market Revenue, By Service
Type, 2025 – 2030 (USD Million) ……………………………….. 437
TABLE NO. 475. : Colombia Sports Hospitality Market Revenue, By Service
Type, 2031 – 2036 (USD Million) ……………………………….. 438
TABLE NO. 476. : Colombia Sports Hospitality Market Revenue, By Channel,
2018 – 2024 (USD Million)………………………………………… 439
TABLE NO. 477. : Colombia Sports Hospitality Market Revenue, By Channel,
2025 – 2030 (USD Million)………………………………………… 439
TABLE NO. 478. : Colombia Sports Hospitality Market Revenue, By Channel,
2031 – 2036 (USD Million)………………………………………… 440
TABLE NO. 479. : Colombia Sports Hospitality Market Revenue, By Attendee
Type, 2018 – 2024 (USD Million) ……………………………….. 441
TABLE NO. 480. : Colombia Sports Hospitality Market Revenue, By Attendee
Type, 2025 – 2030 (USD Million) ……………………………….. 441
TABLE NO. 481. : Colombia Sports Hospitality Market Revenue, By Attendee
Type, 2031 – 2036 (USD Million) ……………………………….. 442
TABLE NO. 482. : Colombia Sports Hospitality Market Revenue, By Revenue
Streams, 2025 – 2030 (USD Million)…………………………… 443
TABLE NO. 483. : Colombia Sports Hospitality Market Revenue, By Revenue
Streams, 2018 – 2024 (USD Million)…………………………… 443
TABLE NO. 484. : Colombia Sports Hospitality Market Revenue, By Revenue
Streams, 2031 – 2036 (USD Million) ……………………………444
TABLE NO. 485. : Rest of Latin America Sports Hospitality Market Revenue,
By Service Type, 2018 – 2024 (USD Million) …………………445
TABLE NO. 486. : Rest of Latin America Sports Hospitality Market Revenue,
By Service Type, 2025 – 2030 (USD Million) …………………445
TABLE NO. 487. : Rest of Latin America Sports Hospitality Market Revenue,
By Service Type, 2031 – 2036 (USD Million) …………………446
TABLE NO. 488. : Rest of Latin America Sports Hospitality Market Revenue,
By Channel, 2018 – 2024 (USD Million) ……………………….447
TABLE NO. 489. : Rest of Latin America Sports Hospitality Market Revenue,
By Channel, 2025 – 2030 (USD Million) ……………………….447
TABLE NO. 490. : Rest of Latin America Sports Hospitality Market Revenue,
By Channel, 2031 – 2036 (USD Million) ……………………….448
TABLE NO. 491. : Rest of Latin America Sports Hospitality Market Revenue,
By Attendee Type, 2018 – 2024 (USD Million)………………449
TABLE NO. 492. : Rest of Latin America Sports Hospitality Market Revenue,
By Attendee Type, 2025 – 2030 (USD Million)………………449
TABLE NO. 493. : Rest of Latin America Sports Hospitality Market Revenue,
By Attendee Type, 2031 – 2036 (USD Million)………………450
TABLE NO. 494. : Rest of Latin America Sports Hospitality Market Revenue,
By Revenue Streams, 2025 – 2030 (USD Million)…………..451
TABLE NO. 495. : Rest of Latin America Sports Hospitality Market Revenue,
By Revenue Streams, 2018 – 2024 (USD Million)…………..451
TABLE NO. 496. : Rest of Latin America Sports Hospitality Market Revenue,
By Revenue Streams, 2031 – 2036 (USD Million)…………..452
TABLE NO. 497. : Middle East Sports Hospitality Market Revenue, By Country,
2018 – 2024 (USD Million) …………………………………………454
TABLE NO. 498. : Middle East Sports Hospitality Market Revenue, By Country,
2025 – 2030 (USD Million)………………………………………… 455
TABLE NO. 499. : Middle East Sports Hospitality Market Revenue, By Country,
2031 – 2036 (USD Million)………………………………………… 456
TABLE NO. 500. : Middle East Sports Hospitality Market Revenue, By Service
Type, 2018 – 2024 (USD Million) ……………………………….. 457
TABLE NO. 501. : Middle East Sports Hospitality Market Revenue, By Service
Type, 2025 – 2030 (USD Million) ……………………………….. 457
TABLE NO. 502. : Middle East Sports Hospitality Market Revenue, By Service
Type, 2031 – 2036 (USD Million) ……………………………….. 458
TABLE NO. 503. : Middle East Sports Hospitality Market Revenue, By
Attendee Type, 2018 – 2024 (USD Million) …………………. 459
TABLE NO. 504. : Middle East Sports Hospitality Market Revenue, By Channel,
2025 – 2030 (USD Million)………………………………………… 460
TABLE NO. 505. : Middle East Sports Hospitality Market Revenue, By Channel,
2031 – 2036 (USD Million)………………………………………… 461
TABLE NO. 506. : Middle East Sports Hospitality Market Revenue, By
Attendee Type, 2018 – 2024 (USD Million) …………………. 462
TABLE NO. 507. : Middle East Sports Hospitality Market Revenue, By
Attendee Type, 2025 – 2030 (USD Million) …………………. 462
TABLE NO. 508. : Middle East Sports Hospitality Market Revenue, By
Attendee Type, 2031 – 2036 (USD Million) …………………. 463
TABLE NO. 509. : Middle East Sports Hospitality Market Revenue, By Revenue
Streams, 2025 – 2030 (USD Million)…………………………… 464
TABLE NO. 510. : Middle East Sports Hospitality Market Revenue, By Revenue
Streams, 2018 – 2024 (USD Million)…………………………… 464
TABLE NO. 511. : Middle East Sports Hospitality Market Revenue, By Revenue
Streams, 2031 – 2036 (USD Million)…………………………… 465
TABLE NO. 512. : Turkey Sports Hospitality Market Revenue, By Service Type,
2018 – 2024 (USD Million) …………………………………………466
TABLE NO. 513. : Turkey Sports Hospitality Market Revenue, By Service Type,
2025 – 2030 (USD Million) …………………………………………466
TABLE NO. 514. : Turkey Sports Hospitality Market Revenue, By Service Type,
2031 – 2036 (USD Million) …………………………………………467
TABLE NO. 515. : Turkey Sports Hospitality Market Revenue, By Channel,
2018 – 2024 (USD Million) …………………………………………468
TABLE NO. 516. : Turkey Sports Hospitality Market Revenue, By Channel,
2025 – 2030 (USD Million) …………………………………………468
TABLE NO. 517. : Turkey Sports Hospitality Market Revenue, By Channel,
2031 – 2036 (USD Million) …………………………………………469
TABLE NO. 518. : Turkey Sports Hospitality Market Revenue, By Attendee
Type, 2018 – 2024 (USD Million)…………………………………470
TABLE NO. 519. : Turkey Sports Hospitality Market Revenue, By Attendee
Type, 2025 – 2030 (USD Million)…………………………………470
TABLE NO. 520. : Turkey Sports Hospitality Market Revenue, By Attendee
Type, 2031 – 2036 (USD Million)…………………………………471
TABLE NO. 521. : Turkey Sports Hospitality Market Revenue, By Revenue
Streams, 2025 – 2030 (USD Million) ……………………………472
TABLE NO. 522. : Turkey Sports Hospitality Market Revenue, By Revenue
Streams, 2018 – 2024 (USD Million) ……………………………472
TABLE NO. 523. : Turkey Sports Hospitality Market Revenue, By Revenue
Streams, 2031 – 2036 (USD Million) ……………………………473
TABLE NO. 524. : GCC Sports Hospitality Market Revenue, By Service Type,
2018 – 2024 (USD Million) …………………………………………474
TABLE NO. 525. : GCC Sports Hospitality Market Revenue, By Service Type,
2025 – 2030 (USD Million) …………………………………………474
TABLE NO. 526. : GCC Sports Hospitality Market Revenue, By Service Type,
2031 – 2036 (USD Million)………………………………………… 475
TABLE NO. 527. : GCC Sports Hospitality Market Revenue, By Channel, 2018 –
2024 (USD Million)…………………………………………………… 476
TABLE NO. 528. : GCC Sports Hospitality Market Revenue, By Channel, 2025 –
2030 (USD Million)…………………………………………………… 476
TABLE NO. 529. : GCC Sports Hospitality Market Revenue, By Channel, 2031 –
2036 (USD Million)…………………………………………………… 477
TABLE NO. 530. : GCC Sports Hospitality Market Revenue, By Attendee Type,
2018 – 2024 (USD Million)………………………………………… 478
TABLE NO. 531. : GCC Sports Hospitality Market Revenue, By Attendee Type,
2025 – 2030 (USD Million)………………………………………… 478
TABLE NO. 532. : GCC Sports Hospitality Market Revenue, By Attendee Type,
2031 – 2036 (USD Million)………………………………………… 479
TABLE NO. 533. : GCC Sports Hospitality Market Revenue, By Revenue
Streams, 2025 – 2030 (USD Million)…………………………… 480
TABLE NO. 534. : GCC Sports Hospitality Market Revenue, By Revenue
Streams, 2018 – 2024 (USD Million)…………………………… 480
TABLE NO. 535. : GCC Sports Hospitality Market Revenue, By Revenue
Streams, 2031 – 2036 (USD Million)…………………………… 481
TABLE NO. 536. : Israel Sports Hospitality Market Revenue, By Service Type,
2018 – 2024 (USD Million)………………………………………… 482
TABLE NO. 537. : Israel Sports Hospitality Market Revenue, By Service Type,
2025 – 2030 (USD Million)………………………………………… 482
TABLE NO. 538. : Israel Sports Hospitality Market Revenue, By Service Type,
2031 – 2036 (USD Million)………………………………………… 483
TABLE NO. 539. : Israel Sports Hospitality Market Revenue, By Channel, 2018
– 2024 (USD Million)………………………………………………… 484
TABLE NO. 540. : Israel Sports Hospitality Market Revenue, By Channel, 2025
– 2030 (USD Million) …………………………………………………484
TABLE NO. 541. : Israel Sports Hospitality Market Revenue, By Channel, 2031
– 2036 (USD Million) …………………………………………………485
TABLE NO. 542. : Israel Sports Hospitality Market Revenue, By Attendee
Type, 2018 – 2024 (USD Million)…………………………………486
TABLE NO. 543. : Israel Sports Hospitality Market Revenue, By Attendee
Type, 2025 – 2030 (USD Million)…………………………………486
TABLE NO. 544. : Israel Sports Hospitality Market Revenue, By Attendee
Type, 2031 – 2036 (USD Million)…………………………………487
TABLE NO. 545. : Israel Sports Hospitality Market Revenue, By Revenue
Streams, 2025 – 2030 (USD Million) ……………………………488
TABLE NO. 546. : Israel Sports Hospitality Market Revenue, By Revenue
Streams, 2018 – 2024 (USD Million) ……………………………488
TABLE NO. 547. : Israel Sports Hospitality Market Revenue, By Revenue
Streams, 2031 – 2036 (USD Million) ……………………………489
TABLE NO. 548. : Rest of Middle East Sports Hospitality Market Revenue, By
Service Type, 2018 – 2024 (USD Million) ……………………..490
TABLE NO. 549. : Rest of Middle East Sports Hospitality Market Revenue, By
Service Type, 2025 – 2030 (USD Million) ……………………..490
TABLE NO. 550. : Rest of Middle East Sports Hospitality Market Revenue, By
Service Type, 2031 – 2036 (USD Million) ……………………..491
TABLE NO. 551. : Rest of Middle East Sports Hospitality Market Revenue, By
Channel, 2018 – 2024 (USD Million) ……………………………492
TABLE NO. 552. : Rest of Middle East Sports Hospitality Market Revenue, By
Channel, 2025 – 2030 (USD Million) ……………………………492
TABLE NO. 553. : Rest of Middle East Sports Hospitality Market Revenue, By
Channel, 2031 – 2036 (USD Million) ……………………………493
TABLE NO. 554. : Rest of Middle East Sports Hospitality Market Revenue, By
Attendee Type, 2018 – 2024 (USD Million) …………………. 494
TABLE NO. 555. : Rest of Middle East Sports Hospitality Market Revenue, By
Attendee Type, 2025 – 2030 (USD Million) …………………. 494
TABLE NO. 556. : Rest of Middle East Sports Hospitality Market Revenue, By
Attendee Type, 2031 – 2036 (USD Million) …………………. 495
TABLE NO. 557. : Rest of Middle East Sports Hospitality Market Revenue, By
Revenue Streams, 2025 – 2030 (USD Million)……………… 496
TABLE NO. 558. : Rest of Middle East Sports Hospitality Market Revenue, By
Revenue Streams, 2018 – 2024 (USD Million)……………… 496
TABLE NO. 559. : Rest of Middle East Sports Hospitality Market Revenue, By
Revenue Streams, 2031 – 2036 (USD Million)……………… 497
TABLE NO. 560. : Africa Sports Hospitality Market Revenue, By Country, 2018
– 2024 (USD Million)………………………………………………… 499
TABLE NO. 561. : Africa Sports Hospitality Market Revenue, By Country, 2025
– 2030 (USD Million)………………………………………………… 500
TABLE NO. 562. : Africa Sports Hospitality Market Revenue, By Country, 2031
– 2036 (USD Million)………………………………………………… 501
TABLE NO. 563. : Africa Sports Hospitality Market Revenue, By Service Type,
2018 – 2024 (USD Million)………………………………………… 502
TABLE NO. 564. : Africa Sports Hospitality Market Revenue, By Service Type,
2025 – 2030 (USD Million)………………………………………… 502
TABLE NO. 565. : Africa Sports Hospitality Market Revenue, By Service Type,
2031 – 2036 (USD Million)………………………………………… 503
TABLE NO. 566. : Africa Sports Hospitality Market Revenue, By Service Type,
2018 – 2024 (USD Million)………………………………………… 504
TABLE NO. 567. : Africa Sports Hospitality Market Revenue, By Channel, 2025
– 2030 (USD Million)………………………………………………… 505
TABLE NO. 568. : Africa Sports Hospitality Market Revenue, By Channel, 2031
– 2036 (USD Million) …………………………………………………506
TABLE NO. 569. : Africa Sports Hospitality Market Revenue, By Attendee
Type, 2018 – 2024 (USD Million)…………………………………507
TABLE NO. 570. : Africa Sports Hospitality Market Revenue, By Attendee
Type, 2025 – 2030 (USD Million)…………………………………507
TABLE NO. 571. : Africa Sports Hospitality Market Revenue, By Attendee
Type, 2031 – 2036 (USD Million)…………………………………508
TABLE NO. 572. : Africa Sports Hospitality Market Revenue, By Revenue
Streams, 2025 – 2030 (USD Million) ……………………………509
TABLE NO. 573. : Africa Sports Hospitality Market Revenue, By Revenue
Streams, 2018 – 2024 (USD Million) ……………………………509
TABLE NO. 574. : Africa Sports Hospitality Market Revenue, By Revenue
Streams, 2031 – 2036 (USD Million) ……………………………510
TABLE NO. 575. : South Africa Sports Hospitality Market Revenue, By Service
Type, 2018 – 2024 (USD Million)…………………………………511
TABLE NO. 576. : South Africa Sports Hospitality Market Revenue, By Service
Type, 2025 – 2030 (USD Million)…………………………………511
TABLE NO. 577. : South Africa Sports Hospitality Market Revenue, By Service
Type, 2031 – 2036 (USD Million)…………………………………512
TABLE NO. 578. : South Africa Sports Hospitality Market Revenue, By
Channel, 2018 – 2024 (USD Million) ……………………………513
TABLE NO. 579. : South Africa Sports Hospitality Market Revenue, By
Channel, 2025 – 2030 (USD Million) ……………………………513
TABLE NO. 580. : South Africa Sports Hospitality Market Revenue, By
Channel, 2031 – 2036 (USD Million) ……………………………514
TABLE NO. 581. : South Africa Sports Hospitality Market Revenue, By
Attendee Type, 2018 – 2024 (USD Million)…………………..515
TABLE NO. 582. : South Africa Sports Hospitality Market Revenue, By
Attendee Type, 2025 – 2030 (USD Million) …………………. 515
TABLE NO. 583. : South Africa Sports Hospitality Market Revenue, By
Attendee Type, 2031 – 2036 (USD Million) …………………. 516
TABLE NO. 584. : South Africa Sports Hospitality Market Revenue, By
Revenue Streams, 2025 – 2030 (USD Million)……………… 517
TABLE NO. 585. : South Africa Sports Hospitality Market Revenue, By
Revenue Streams, 2018 – 2024 (USD Million)……………… 517
TABLE NO. 586. : South Africa Sports Hospitality Market Revenue, By
Revenue Streams, 2031 – 2036 (USD Million)……………… 518
TABLE NO. 587. : Egypt Sports Hospitality Market Revenue, By Service Type,
2018 – 2024 (USD Million)………………………………………… 519
TABLE NO. 588. : Egypt Sports Hospitality Market Revenue, By Service Type,
2025 – 2030 (USD Million)………………………………………… 519
TABLE NO. 589. : Egypt Sports Hospitality Market Revenue, By Service Type,
2031 – 2036 (USD Million)………………………………………… 520
TABLE NO. 590. : Egypt Sports Hospitality Market Revenue, By Channel, 2018
– 2024 (USD Million)………………………………………………… 521
TABLE NO. 591. : Egypt Sports Hospitality Market Revenue, By Channel, 2025
– 2030 (USD Million)………………………………………………… 521
TABLE NO. 592. : Egypt Sports Hospitality Market Revenue, By Channel, 2031
– 2036 (USD Million)………………………………………………… 522
TABLE NO. 593. : Egypt Sports Hospitality Market Revenue, By Attendee
Type, 2018 – 2024 (USD Million) ……………………………….. 523
TABLE NO. 594. : Egypt Sports Hospitality Market Revenue, By Attendee
Type, 2025 – 2030 (USD Million) ……………………………….. 523
TABLE NO. 595. : Egypt Sports Hospitality Market Revenue, By Attendee
Type, 2031 – 2036 (USD Million) ……………………………….. 524
TABLE NO. 596. : Egypt Sports Hospitality Market Revenue, By Revenue
Streams, 2025 – 2030 (USD Million) ……………………………525
TABLE NO. 597. : Egypt Sports Hospitality Market Revenue, By Revenue
Streams, 2018 – 2024 (USD Million) ……………………………525
TABLE NO. 598. : Egypt Sports Hospitality Market Revenue, By Revenue
Streams, 2031 – 2036 (USD Million) ……………………………526
TABLE NO. 599. : Nigeria Sports Hospitality Market Revenue, By Service Type,
2018 – 2024 (USD Million) …………………………………………527
TABLE NO. 600. : Nigeria Sports Hospitality Market Revenue, By Service Type,
2025 – 2030 (USD Million) …………………………………………527
TABLE NO. 601. : Nigeria Sports Hospitality Market Revenue, By Service Type,
2031 – 2036 (USD Million) …………………………………………528
TABLE NO. 602. : Nigeria Sports Hospitality Market Revenue, By Channel,
2018 – 2024 (USD Million) …………………………………………529
TABLE NO. 603. : Nigeria Sports Hospitality Market Revenue, By Channel,
2025 – 2030 (USD Million) …………………………………………529
TABLE NO. 604. : Nigeria Sports Hospitality Market Revenue, By Channel,
2031 – 2036 (USD Million) …………………………………………530
TABLE NO. 605. : Nigeria Sports Hospitality Market Revenue, By Attendee
Type, 2018 – 2024 (USD Million)…………………………………531
TABLE NO. 606. : Nigeria Sports Hospitality Market Revenue, By Attendee
Type, 2025 – 2030 (USD Million)…………………………………531
TABLE NO. 607. : Nigeria Sports Hospitality Market Revenue, By Attendee
Type, 2031 – 2036 (USD Million)…………………………………532
TABLE NO. 608. : Nigeria Sports Hospitality Market Revenue, By Revenue
Streams, 2025 – 2030 (USD Million) ……………………………533
TABLE NO. 609. : Nigeria Sports Hospitality Market Revenue, By Revenue
Streams, 2018 – 2024 (USD Million) ……………………………533
TABLE NO. 610. : Nigeria Sports Hospitality Market Revenue, By Revenue
Streams, 2031 – 2036 (USD Million)…………………………… 534
TABLE NO. 611. : Algeria Sports Hospitality Market Revenue, By Service Type,
2018 – 2024 (USD Million)………………………………………… 535
TABLE NO. 612. : Algeria Sports Hospitality Market Revenue, By Service Type,
2025 – 2030 (USD Million)………………………………………… 535
TABLE NO. 613. : Algeria Sports Hospitality Market Revenue, By Service Type,
2031 – 2036 (USD Million)………………………………………… 536
TABLE NO. 614. : Algeria Sports Hospitality Market Revenue, By Channel,
2018 – 2024 (USD Million)………………………………………… 537
TABLE NO. 615. : Algeria Sports Hospitality Market Revenue, By Channel,
2025 – 2030 (USD Million)………………………………………… 537
TABLE NO. 616. : Algeria Sports Hospitality Market Revenue, By Channel,
2031 – 2036 (USD Million)………………………………………… 538
TABLE NO. 617. : Algeria Sports Hospitality Market Revenue, By Attendee
Type, 2018 – 2024 (USD Million) ……………………………….. 539
TABLE NO. 618. : Algeria Sports Hospitality Market Revenue, By Attendee
Type, 2025 – 2030 (USD Million) ……………………………….. 539
TABLE NO. 619. : Algeria Sports Hospitality Market Revenue, By Attendee
Type, 2031 – 2036 (USD Million) ……………………………….. 540
TABLE NO. 620. : Algeria Sports Hospitality Market Revenue, By Revenue
Streams, 2025 – 2030 (USD Million)…………………………… 541
TABLE NO. 621. : Algeria Sports Hospitality Market Revenue, By Revenue
Streams, 2018 – 2024 (USD Million)…………………………… 541
TABLE NO. 622. : Algeria Sports Hospitality Market Revenue, By Revenue
Streams, 2031 – 2036 (USD Million)…………………………… 542
TABLE NO. 623. : Morocco Sports Hospitality Market Revenue, By Service
Type, 2018 – 2024 (USD Million) ……………………………….. 543
TABLE NO. 624. : Morocco Sports Hospitality Market Revenue, By Service
Type, 2025 – 2030 (USD Million)…………………………………543
TABLE NO. 625. : Morocco Sports Hospitality Market Revenue, By Service
Type, 2031 – 2036 (USD Million)…………………………………544
TABLE NO. 626. : Morocco Sports Hospitality Market Revenue, By Channel,
2018 – 2024 (USD Million) …………………………………………545
TABLE NO. 627. : Morocco Sports Hospitality Market Revenue, By Channel,
2025 – 2030 (USD Million) …………………………………………545
TABLE NO. 628. : Morocco Sports Hospitality Market Revenue, By Channel,
2031 – 2036 (USD Million) …………………………………………546
TABLE NO. 629. : Morocco Sports Hospitality Market Revenue, By Attendee
Type, 2018 – 2024 (USD Million)…………………………………547
TABLE NO. 630. : Morocco Sports Hospitality Market Revenue, By Attendee
Type, 2025 – 2030 (USD Million)…………………………………547
TABLE NO. 631. : Morocco Sports Hospitality Market Revenue, By Attendee
Type, 2031 – 2036 (USD Million)…………………………………548
TABLE NO. 632. : Morocco Sports Hospitality Market Revenue, By Revenue
Streams, 2025 – 2030 (USD Million) ……………………………549
TABLE NO. 633. : Morocco Sports Hospitality Market Revenue, By Revenue
Streams, 2018 – 2024 (USD Million) ……………………………549
TABLE NO. 634. : Morocco Sports Hospitality Market Revenue, By Revenue
Streams, 2031 – 2036 (USD Million) ……………………………550
TABLE NO. 635. : Rest of Africa Sports Hospitality Market Revenue, By Service
Type, 2018 – 2024 (USD Million)…………………………………551
TABLE NO. 636. : Rest of Africa Sports Hospitality Market Revenue, By Service
Type, 2025 – 2030 (USD Million) ……………………………….. 551
TABLE NO. 637. : Rest of Africa Sports Hospitality Market Revenue, By Service
Type, 2031 – 2036 (USD Million) ……………………………….. 552
TABLE NO. 638. : Rest of Africa Sports Hospitality Market Revenue, By
Channel, 2018 – 2024 (USD Million)…………………………… 553
TABLE NO. 639. : Rest of Africa Sports Hospitality Market Revenue, By
Channel, 2025 – 2030 (USD Million)…………………………… 553
TABLE NO. 640. : Rest of Africa Sports Hospitality Market Revenue, By
Channel, 2031 – 2036 (USD Million)…………………………… 554
TABLE NO. 641. : Rest of Africa Sports Hospitality Market Revenue, By
Attendee Type, 2018 – 2024 (USD Million) …………………. 555
TABLE NO. 642. : Rest of Africa Sports Hospitality Market Revenue, By
Attendee Type, 2025 – 2030 (USD Million) …………………. 555
TABLE NO. 643. : Rest of Africa Sports Hospitality Market Revenue, By
Attendee Type, 2031 – 2036 (USD Million) …………………. 556
TABLE NO. 644. : Rest of Africa Sports Hospitality Market Revenue, By
Revenue Streams, 2025 – 2030 (USD Million)……………… 557
TABLE NO. 645. : Rest of Africa Sports Hospitality Market Revenue, By
Revenue Streams, 2018 – 2024 (USD Million)……………… 557
TABLE NO. 646. : Rest of Africa Sports Hospitality Market Revenue, By
Revenue Streams, 2031 – 2036 (USD Million)……………… 558