Market Overview
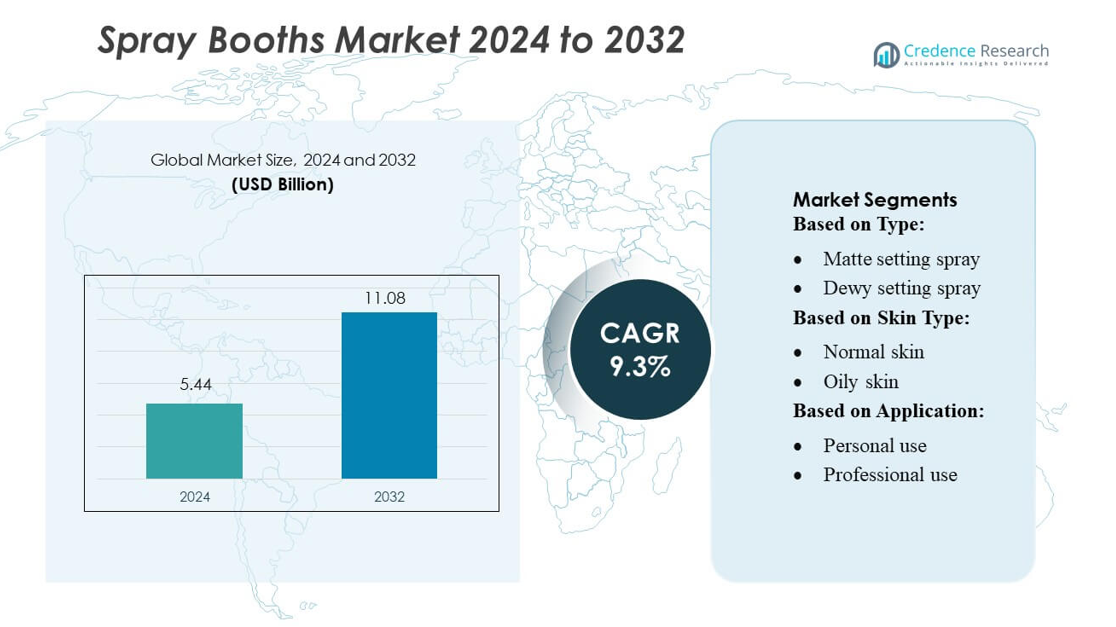
Spray Booths Market size was valued USD 5.44 billion in 2024 and is anticipated to reach USD 11.08 billion by 2032, at a CAGR of 9.3% during the forecast period.
| REPORT ATTRIBUTE |
DETAILS |
| Historical Period |
2020-2023 |
| Base Year |
2024 |
| Forecast Period |
2025-2032 |
| Spray Booths Market Size 2024 |
USD 5.44 billion |
| Spray Booths Market, CAGR |
9.3% |
| Spray Booths Market Size 2032 |
USD 11.08 billion |
The Spray Booths Market features key players such as Honeywell International Inc., Rhino Linings Corporation, Covestro AG, NCFI Polyurethanes, BASF SE, Henry Company, Johns Manville, CertainTeed, LLC (Saint-Gobain), Huntsman International LLC, and RHH Foam Systems. These companies maintain market leadership through continuous innovation, development of eco-friendly and multifunctional spray booths, and expansion across professional and personal application segments. Strategic investments in research and development, automation, and smart technologies enable them to offer high-performance solutions that cater to evolving consumer needs. North America leads the global market, holding approximately 36% share, driven by strong demand from professional makeup studios, high consumer awareness of personal care products, and advanced distribution networks. The combination of technological advancements, product differentiation, and regional dominance positions these players to sustain growth and strengthen their competitive edge in the Spray Booths Market.
Market Insights
- The Spray Booths Market size was valued at USD 5.44 billion in 2024 and is projected to reach USD 11.08 billion by 2032, growing at a CAGR of 9.3% during the forecast period.
- Market growth is driven by rising demand for high-performance and long-lasting makeup products, increasing personal care awareness, and the adoption of multifunctional and eco-friendly spray booths.
- Key trends include technological advancements such as automated and precision-controlled spray booths, integration of smart features, and expansion through e-commerce and professional studios.
- The competitive landscape is dominated by companies focusing on innovation, product differentiation, and strategic investments in R&D, enabling high-performance solutions across personal and professional applications.
- Regionally, North America leads with approximately 36% market share, followed by Asia-Pacific and Europe, while the matte and oil-control setting spray segments hold the largest shares, catering to diverse skin types and professional use.
Access crucial information at unmatched prices!
Request your sample report today & start making informed decisions powered by Credence Research Inc.!
Download Sample
Market Segmentation Analysis:
By Type
In the Spray Booths Market, the matte setting spray segment dominates with an estimated market share of approximately 28–30%. Its widespread adoption is driven by the increasing demand for oil-control finishes and long-lasting makeup, particularly in regions with hot and humid climates. Dewy and hydrating sprays are gaining traction among younger consumers seeking a natural glow, while oil-control and long-lasting sprays cater to professional makeup artists. The “others” category, including illuminating sprays, remains niche but is expanding due to rising interest in specialty and luxury cosmetic products.
- For instance, Honeywell International Inc. leverages its global manufacturing infrastructure (approximately 750 sites and around 102,000 employees) to integrate advanced environmental-control technologies across various industrial applications.
By Skin Type
Within the skin type segment, oily skin products lead the market with an approximate share of 32–34%, fueled by rising concerns over shine control and acne prevention. Consumers with normal and combination skin also contribute to steady growth, driven by the desire for balanced hydration and makeup longevity. Dry skin-targeted sprays are witnessing moderate adoption as formulations increasingly incorporate moisturizing ingredients. Product innovation, particularly in multifunctional sprays that cater to multiple skin types, and the growing awareness of skincare-makeup integration are key factors driving segment expansion.
- For instance, Rhino Hybrid HP 11-50 offers high tensile strength and can be sprayed from a minimal thickness (1/16 inch) up to virtually unlimited thickness, making it suitable for heavy-duty, high-wear industrial applications.
By Application
The personal use segment holds the largest market share at around 60%, driven by the increasing influence of social media, online tutorials, and rising self-care trends among consumers. Professional use in salons, photo shoots, and fashion shows also contributes significantly, with demand fueled by specialized formulations offering high durability and finish consistency. Technological advancements in spray booth design for both personal and professional applications, along with convenient packaging and ease of use, continue to support market growth. The convergence of personal grooming trends and professional adoption ensures broad segment expansion.
Key Growth Drivers
Rising Demand for High-Performance Makeup Products
The increasing consumer preference for long-lasting and flawless makeup drives the Spray Booths Market. Professional makeup artists and everyday users alike seek sprays that ensure durability, oil-control, and skin compatibility. Technological innovations in spray booth design enhance application efficiency and product performance, making it easier to achieve consistent results. The growth of the beauty and cosmetics industry, fueled by social media tutorials and influencer marketing, further accelerates adoption. This rising demand for high-performance sprays is a primary factor propelling market expansion globally.
- For instance, Covestro launched an automated laboratory in 2025 that can run tens of thousands of coating and adhesive formulation tests annually, operating 24/7 with robotic automation and AI-driven data analysis — a significant leap in development speed and precision.
Technological Advancements in Spray Booth Design
Innovation in spray booth equipment, including automated and precision-controlled systems, significantly boosts market growth. Advanced designs reduce product wastage, improve hygiene, and enable uniform application across personal and professional settings. Integration of smart features, such as adjustable mist intensity and targeted spray zones, enhances user experience and efficiency. Manufacturers investing in research and development to create eco-friendly and ergonomic solutions attract both commercial and individual buyers, reinforcing market penetration. Continuous technological evolution remains a key driver of adoption in the Spray Booths Market.
- For instance, NCFI offers rigid spray‑applied foam systems such as its 11‑035 SPF formulation, which exhibits a core density of 2.0 pound‑per‑cubic‑foot and a closed‑cell content greater than 90%.
Growing Personal Care and Beauty Awareness
The surge in consumer awareness regarding skincare and beauty routines supports the Spray Booths Market. Increasing focus on self-care, personalized makeup solutions, and cosmetic hygiene encourages the use of professional-grade sprays at home. The rise of influencer-driven content, tutorials, and virtual makeup trials educates users about the benefits of spray booths, driving preference for high-quality, easy-to-use products. This heightened awareness, combined with lifestyle changes and disposable income growth, directly contributes to higher demand and consistent market expansion across regions.
Key Trends & Opportunities
Sustainable and Eco-Friendly Product Innovation
Manufacturers are increasingly focusing on environmentally friendly sprays and booths, using recyclable materials and low-emission systems. Consumers are drawn to sustainable solutions that minimize chemical exposure and reduce environmental impact. This trend presents opportunities for brands to differentiate themselves by offering eco-conscious products that appeal to ethically minded buyers, fostering brand loyalty. Adoption of biodegradable packaging and refillable spray systems further strengthens market positioning while supporting global sustainability goals, making eco-friendly innovation a critical opportunity for market growth.
- For instance, BASF SE recently expanded its sustainable coatings portfolio by introducing more than 250 biomass‑balanced products across multiple regions and business areas, under its brands such as Glasurit® Eco Balance and R‑M® eSense.
Integration of Multifunctional and Customizable Sprays
There is a rising trend toward multifunctional sprays that combine hydration, oil-control, and long-lasting effects in a single product. Customizable spray booths allow users to adjust settings based on skin type, application area, or desired finish, enhancing precision and user experience. These innovations cater to both personal and professional users, increasing adoption across demographics. The ability to offer tailored solutions opens opportunities for premium pricing, upselling, and brand differentiation, positioning the Spray Booths Market for sustained growth.
- For instance, JM recently announced plans to build a new production line in Winder, Georgia dedicated to its “Climate Pro” blowing‑wool insulation — once operational in mid‑2027, the facility will employ over 350 people and expand JM’s capacity to meet growing demand for high‑performance insulation.
Expansion in Professional and E-Commerce Channels
Professional makeup studios, salons, and online retail platforms are increasingly contributing to market expansion. The growth of e-commerce enables direct-to-consumer sales, faster product launches, and wider reach, particularly in emerging markets. Professional applications in fashion shows, film, and photography continue to drive demand for high-quality spray booths, while online tutorials boost personal usage. Leveraging these channels allows manufacturers to expand geographically, enhance brand visibility, and capture a broader consumer base, creating substantial growth opportunities across both B2B and B2C segments.
Key Challenges
High Cost of Advanced Spray Booths
The adoption of technologically advanced and precision-controlled spray booths is often constrained by high initial investment and maintenance costs. Small-scale salons, individual professionals, and budget-conscious consumers may find it challenging to afford premium systems. Additionally, sophisticated booths require training for proper operation, limiting rapid adoption. Cost-related barriers can slow market penetration, particularly in price-sensitive regions, creating a challenge for manufacturers to balance affordability with advanced features while maintaining profitability.
Regulatory Compliance and Safety Concerns
Spray booths must adhere to stringent regulations concerning chemical emissions, safety standards, and hygiene protocols. Non-compliance can lead to legal liabilities, product recalls, or market restrictions. Varying regulations across regions create additional complexities for global manufacturers. Ensuring safety while maintaining efficiency and product performance requires significant investment in R&D and quality control. These regulatory and safety challenges pose ongoing risks to growth, demanding careful compliance strategies and continuous monitoring to sustain market credibility and consumer trust.
Regional Analysis
North America
North America dominates the Spray Booths Market with an estimated share of 35–37%, driven by strong demand from professional makeup studios, salons, and e-commerce channels. High consumer awareness regarding personal care and premium cosmetic products fuels adoption, while technological advancements in spray booth designs enhance precision and efficiency. The presence of leading manufacturers investing in R&D and innovative solutions further strengthens the market. Additionally, rising social media influence and influencer-driven tutorials encourage personal use, expanding the customer base. Regulatory support for safe cosmetic practices and sustainable product trends also contributes to sustained market growth in the region.
Europe
Europe holds approximately 25–27% of the Spray Booths Market, supported by a mature beauty and cosmetics industry and high disposable income. Demand is driven by professional use in fashion, film, and photography, as well as personal adoption of high-quality, multifunctional sprays. Countries such as Germany, France, and the UK lead due to established cosmetic standards and strong retail and e-commerce networks. Increasing focus on sustainable and eco-friendly spray booth solutions aligns with European consumer preferences. Innovation in automation, customization, and user-friendly designs further propels market growth, making Europe a significant contributor to the global Spray Booths Market.
Asia-Pacific
The Asia-Pacific region accounts for around 28–30% market share, driven by rapid urbanization, rising disposable incomes, and growing beauty awareness among young consumers. Countries such as China, Japan, South Korea, and India are key contributors due to increasing demand for personal care products, professional makeup services, and salon-based applications. The expansion of e-commerce and influencer-driven social media trends accelerates adoption. Additionally, manufacturers are introducing affordable and multifunctional spray booths tailored for diverse skin types and climates, capturing a broader consumer base. The region presents strong growth potential due to increasing beauty consciousness and technological penetration.
Latin America
Latin America represents an estimated 6–7% share of the Spray Booths Market, with growth driven by rising urban beauty trends and increased adoption of professional makeup solutions. Brazil and Mexico are major contributors, supported by expanding cosmetic and salon industries. Demand is influenced by younger demographics seeking innovative and long-lasting makeup solutions. Market growth is further aided by the gradual introduction of e-commerce channels, international cosmetic brands, and affordable multifunctional spray booth products. However, economic fluctuations and price sensitivity pose challenges, making value-driven products and cost-effective innovations essential for sustained expansion in the region.
Middle East & Africa
The Middle East & Africa region holds roughly 4–5% market share, driven by niche demand in high-income urban centers and growing interest in professional and luxury cosmetic products. The UAE, Saudi Arabia, and South Africa lead adoption due to increasing investment in beauty salons, fashion industries, and international cosmetics. Market growth is supported by rising social media influence, influencer marketing, and awareness of advanced spray booth technologies. However, market expansion is tempered by economic disparities and limited distribution networks in certain areas. Manufacturers targeting premium segments with innovative, multifunctional, and compact solutions can capitalize on emerging opportunities in this region.
Market Segmentations:
By Type:
- Matte setting spray
- Dewy setting spray
By Skin Type:
By Application:
- Personal use
- Professional use
By Geography
- North America
- Europe
- Germany
- France
- U.K.
- Italy
- Spain
- Rest of Europe
- Asia Pacific
- China
- Japan
- India
- South Korea
- South-east Asia
- Rest of Asia Pacific
- Latin America
- Brazil
- Argentina
- Rest of Latin America
- Middle East & Africa
- GCC Countries
- South Africa
- Rest of the Middle East and Africa
Competitive Landscape
The Spray Booths Market, including Honeywell International Inc., Rhino Linings Corporation, Covestro AG, NCFI Polyurethanes, BASF SE, Henry Company, Johns Manville, CertainTeed, LLC (Saint-Gobain), Huntsman International LLC, and RHH Foam Systems. The Spray Booths Market is highly competitive, driven by continuous innovation, technological advancements, and evolving consumer preferences. Companies focus on developing eco-friendly, multifunctional, and precision-controlled spray booths to meet increasing demand for high-performance cosmetic applications. Strategic investments in research and development, automation, and smart features enable manufacturers to differentiate their products and enhance user experience. Additionally, expansion through e-commerce channels, collaborations with professional studios, and entry into emerging markets are key strategies supporting growth. Market competition is further intensified by the introduction of customized and cost-effective solutions, prompting continuous innovation and efficiency improvements across both personal and professional application segments.
Shape Your Report to Specific Countries or Regions & Enjoy 30% Off!
Key Player Analysis
Recent Developments
- In May 2025, Pat McGrath introduced Glass 001 Legendary Glow Setting Spray, designed to create a radiant, glass-like finish. It maintains makeup for up to 16 hours and includes hydrating ingredients such as aloe leaf, black tulip extract, and cucumber extract. The spray offers a customizable dewiness, from a subtle glow in one coat to a high-shine finish with multiple layers, without compromising makeup integrity or causing greasiness.
- In December 2024, Arkema’s acquisition of Dow’s flexible packaging laminating adhesives business primarily expands its presence in the packaging industry and has no direct, publicly stated impact on its separate spray foam insulation segment.
- In July 2024, Johns Manville (JM), a Berkshire Hathaway company, expanded its spray foam offerings by introducing the new High Yield Open Cell (HYOC) product, which is suitable for interior applications in residential, commercial, and industrial settings. The new HYOC spray foam is a high-yield product that provides superior thermal efficiency, air control, and sound control, joining JM’s other premium spray foam products and giving installers more options.
- In June 2024, Milani Cosmetics launched a new “Face Set. Mind Set.” campaign with four top female athletes: gymnast Jordan Chiles, basketball player Sabrina Ionescu, volleyball player Chiaka Ogbogu, and weightlifter Mattie Rogers.
Report Coverage
The research report offers an in-depth analysis based on Type, Skin Type, Application and Geography. It details leading market players, providing an overview of their business, product offerings, investments, revenue streams, and key applications. Additionally, the report includes insights into the competitive environment, SWOT analysis, current market trends, as well as the primary drivers and constraints. Furthermore, it discusses various factors that have driven market expansion in recent years. The report also explores market dynamics, regulatory scenarios, and technological advancements that are shaping the industry. It assesses the impact of external factors and global economic changes on market growth. Lastly, it provides strategic recommendations for new entrants and established companies to navigate the complexities of the market.
Future Outlook
- The market is expected to grow steadily due to increasing demand for high-performance makeup products.
- Technological advancements will drive adoption of automated and precision-controlled spray booths.
- Eco-friendly and sustainable spray booth solutions will gain prominence among consumers.
- Rising awareness of personal care and beauty routines will boost market penetration.
- Expansion of e-commerce channels will enhance accessibility and distribution globally.
- Multifunctional and customizable sprays will attract both professional and personal users.
- Emerging markets will witness significant growth due to increasing disposable incomes.
- Integration of smart features and ergonomic designs will improve user experience.
- Collaboration with professional studios and salons will support market expansion.
- Continuous innovation and product differentiation will remain key drivers of competitiveness.


