
Market Overview
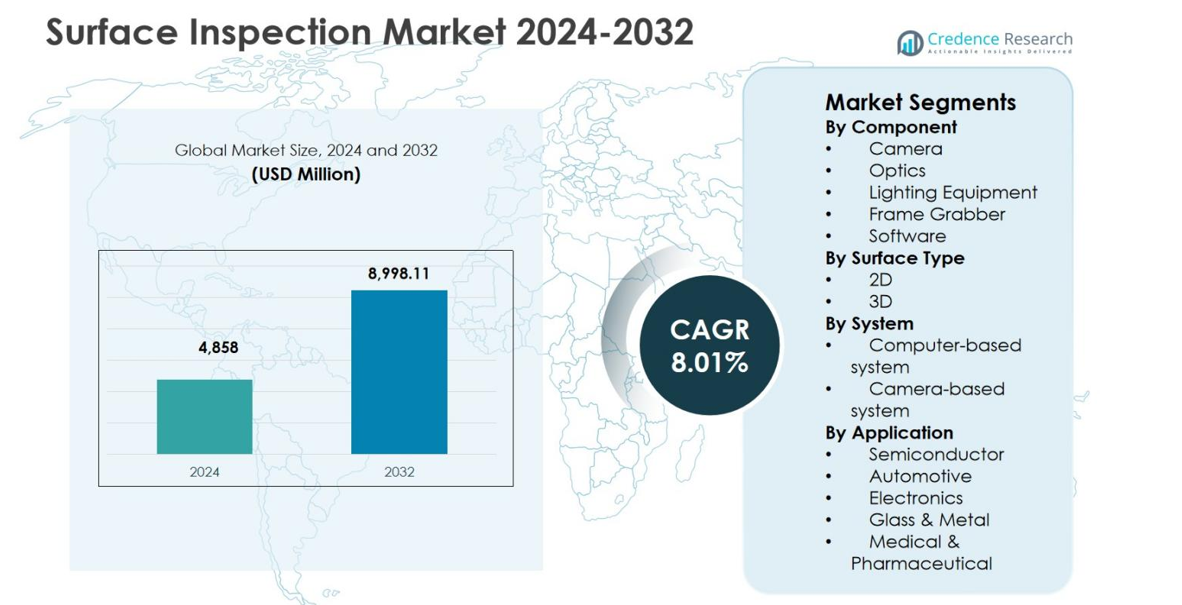
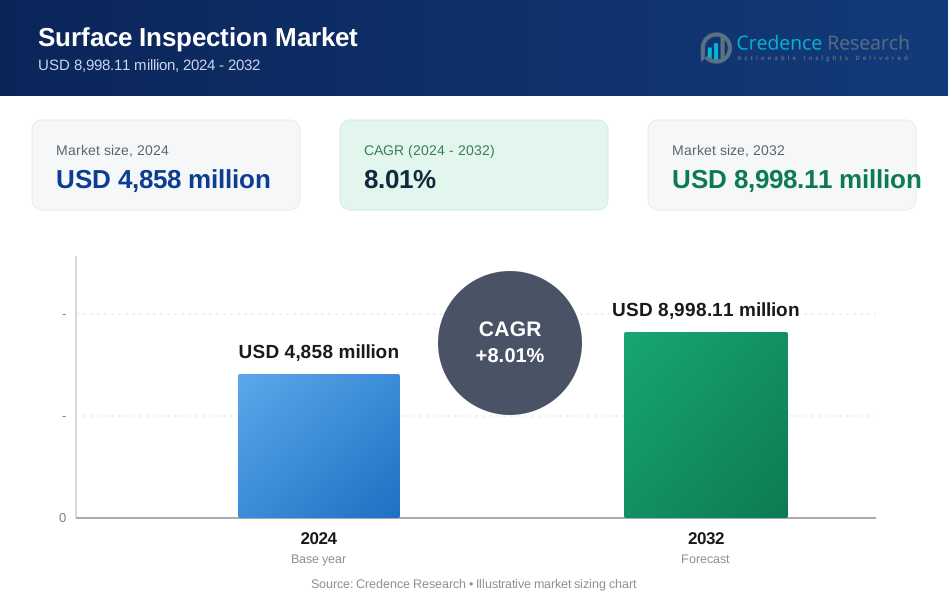
Surface Inspection Market size was valued at USD 4,858 million in 2024 and is anticipated to reach USD 8,998.11 million by 2032, at a CAGR of 8.01% during the forecast period.
| REPORT ATTRIBUTE | DETAILS |
|---|---|
| Historical Period | 2020-2023 |
| Base Year | 2024 |
| Forecast Period | 2025-2032 |
| Surface Inspection Market Size 2024 | USD 4,858 million |
| Surface Inspection Market, CAGR | 8.01% |
| Surface Inspection Market Size 2032 | USD 8,998.11 million |
Surface Inspection Market is driven by the strong presence of established technology providers such as Omron Corporation, Panasonic Corporation, Keyence Corporation, Cognex Corporation, Teledyne Technologies, Inc., Basler AG, ISRA Vision AG (Atlas Copco), Ametek, Inc., VITRONIC Machine Vision, and Matrox Electronic Systems Ltd., which focus on advanced machine vision, AI-enabled inspection, and high-resolution imaging solutions. These players support wide adoption across automotive, electronics, semiconductor, and packaging industries through continuous product innovation and system integration capabilities. Regionally, Asia Pacific leads the Surface Inspection Market with a 34.7% share, supported by large-scale manufacturing activity and automation investments, followed by North America with 31.4% and Europe with 26.8%, reflecting strong demand from high-precision industrial applications.
Market Insights
- Surface Inspection Market was valued at USD 4,858 million in 2024 and is projected to reach USD 8,998.11 million by 2032, growing at a CAGR of 8.01% during the forecast period.
- Market growth is driven by rising automation and quality control needs, with the computer-based system segment holding 61.4% share in 2024 due to advanced processing and AI integration, while the camera component accounted for 34.6% share supported by high-resolution inspection demand.
- Increasing adoption of AI-enabled machine vision, smart factories, and real-time defect detection represents a key market trend, with 2D surface inspection systems dominating at 58.2% share owing to cost efficiency and faster processing.
- Leading players focus on innovation, system integration, and scalable inspection solutions, strengthening adoption across automotive, electronics, and semiconductor applications.
- Regionally, Asia Pacific led with 34.7% share in 2024, followed by North America at 31.4% and Europe at 26.8%, reflecting strong manufacturing and automation penetration.
Market Segmentation Analysis:
By Component:
The Surface Inspection Market, by component, is led by the Camera segment, which accounted for 34.6% market share in 2024, driven by rising adoption of high-resolution industrial cameras across manufacturing lines. Cameras enable precise defect detection, real-time monitoring, and high-speed inspection in automotive, electronics, and semiconductor industries. Increasing deployment of AI-enabled vision cameras, demand for higher pixel density, and integration with automated production systems further support growth. Strong investments in smart factories and quality control automation continue to reinforce the dominance of cameras within the component segment.
- For instance, Radiant Optronics integrates Allied Vision's Goldeye G-008 SWIR camera into infrared imaging microscopes for IC manufacturers in Asia, verifying semiconductor wafers are defect-free before slicing and checking circuits for cracks afterward.
By Surface Type:
Based on surface type, the 2D Surface Inspection segment dominated the Surface Inspection Market with a 58.2% share in 2024, supported by its widespread use in defect detection, dimensional verification, and pattern recognition. 2D systems offer cost-effective deployment, faster processing speeds, and compatibility with legacy inspection infrastructure. High adoption across packaging, food processing, printing, and consumer goods manufacturing continues to drive demand. The ability of 2D systems to deliver reliable inspection outcomes with lower computational complexity remains a key driver sustaining its leading position.
- For instance, Montrose Technologies' MT60 system uses overhead 2D imaging to analyze tortillas at up to 20 per second on conveyors moving 180 feet per minute. It detects faults such as folds, doubles, burnt holes, and ragged edges while measuring diameters, roundness, and toast mark area.
By System:
In terms of system type, Computer-based Systems held the largest share of 61.4% in 2024 within the Surface Inspection Market, driven by superior processing power, flexibility, and advanced analytics capabilities. These systems support complex inspection algorithms, AI-based defect classification, and multi-camera integration, making them ideal for high-precision industrial applications. Growing demand for scalable inspection solutions, integration with Manufacturing Execution Systems, and real-time data analytics in automotive and electronics manufacturing continues to propel the dominance of computer-based systems.
Key Growth Drivers
Rising Adoption of Automation and Smart Manufacturing
The Surface Inspection Market is experiencing strong growth due to accelerating adoption of automation and smart manufacturing practices. Industries such as automotive, electronics, semiconductor, and packaging increasingly rely on automated inspection systems to improve productivity and ensure consistent product quality. Surface inspection solutions enable real-time defect detection, reduce human error, and support high-speed production environments. Growing implementation of Industry 4.0 initiatives, coupled with rising investments in digital factories and connected manufacturing systems, continues to drive demand for advanced surface inspection technologies globally.
- For instance, Tecnalia's SURFIN system inspects hot steel tubes and profiles at 1000°C and 10 m/s speeds, using AI to detect roll marks and cracks in real-time during lamination.
Increasing Quality Control Requirements Across Industries
Stringent quality standards and regulatory compliance requirements significantly drive the Surface Inspection Market. Manufacturers face increasing pressure to minimize defects, reduce recalls, and maintain brand reputation, particularly in sectors such as automotive, aerospace, pharmaceuticals, and electronics. Surface inspection systems provide accurate and repeatable inspection outcomes, ensuring adherence to strict tolerances and specifications. The rising complexity of products, use of advanced materials, and miniaturization of components further amplify the need for precise surface inspection, reinforcing market growth across multiple industrial applications.
- For instance, Keyence employs machine vision systems to inspect conformal coating presence on automotive ECUs. The system uses UV light and a 21-megapixel camera to detect transparent moisture-proof agents containing fluorescence, ensuring high-accuracy verification that prevents overlooked defective applications.
Advancements in Machine Vision and AI Technologies
Rapid advancements in machine vision, artificial intelligence, and deep learning algorithms are key growth drivers in the Surface Inspection Market. AI-enabled inspection systems enhance defect recognition accuracy, enable adaptive learning, and reduce false positives. Improved imaging sensors, faster processors, and enhanced software capabilities allow manufacturers to inspect complex surfaces with greater precision. The integration of AI-driven analytics with surface inspection systems supports predictive maintenance and process optimization, creating strong value propositions for manufacturers seeking improved operational efficiency.
Key Trends & Opportunities
Growing Integration of AI-Based Inspection Systems
A major trend in the Surface Inspection Market is the growing integration of AI-based inspection systems across manufacturing environments. AI-powered solutions enable advanced defect classification, pattern recognition, and continuous system learning, improving inspection reliability over time. This trend creates significant opportunities for vendors to develop intelligent, self-optimizing inspection platforms. Increasing demand for real-time analytics and data-driven quality control further accelerates adoption, particularly in high-volume manufacturing sectors where accuracy and speed are critical.
- For instance, Cognex's In-Sight 2800 vision system combines AI edge learning with rule-based tools to classify defects into multiple categories and inspect various regions of interest simultaneously.
Expanding Demand from Emerging Manufacturing Economies
Expanding industrialization in emerging manufacturing economies presents strong growth opportunities for the Surface Inspection Market. Rapid growth of automotive, electronics, and consumer goods manufacturing in Asia Pacific, Latin America, and parts of the Middle East drives demand for modern quality inspection systems. Governments supporting industrial automation and foreign direct investment further strengthen market prospects. Local manufacturers increasingly adopt surface inspection solutions to meet global quality standards and remain competitive in export-driven markets.
- For instance, Konica Minolta installed tunnel-type automatic inspection systems in China, the world's largest automobile-producing country, to detect paint defects as small as the diameter of a mechanical pencil lead on car bodies.
Key Challenges
High Initial Investment and Integration Complexity
High initial investment costs and integration complexity pose significant challenges for the Surface Inspection Market. Advanced inspection systems require substantial capital expenditure for hardware, software, and system customization. Small and medium-sized manufacturers often face budget constraints, limiting adoption. Additionally, integrating surface inspection solutions with existing production lines and IT infrastructure can be technically complex, requiring skilled personnel and extended deployment timelines, which may hinder market penetration in cost-sensitive industries.
Shortage of Skilled Workforce and Technical Expertise
The Surface Inspection Market faces challenges related to the shortage of skilled professionals capable of operating and maintaining advanced inspection systems. Machine vision and AI-based inspection technologies require specialized expertise in optics, software, and data analytics. Limited availability of trained personnel increases operational complexity and slows adoption, particularly in developing regions. Manufacturers must invest in training programs and technical support, which adds to overall operational costs and may impact return on investment.
Regional Analysis
North America
North America accounted for 31.4% market share in 2024 in the Surface Inspection Market, supported by early adoption of advanced automation and strong presence of automotive, aerospace, and semiconductor manufacturing industries. High investments in smart manufacturing, AI-enabled inspection systems, and quality assurance technologies continue to drive demand. The United States leads the region due to extensive deployment of machine vision systems across production lines. Strict quality standards, high labor costs encouraging automation, and continuous technological innovation further strengthen North America’s dominant position in the global surface inspection landscape.
Europe
Europe captured 26.8% market share in 2024 in the Surface Inspection Market, driven by strong industrial automation adoption across Germany, France, Italy, and the United Kingdom. The region benefits from a robust automotive manufacturing base, advanced electronics production, and stringent quality and safety regulations. Manufacturers increasingly deploy surface inspection systems to ensure compliance with precision and defect-free standards. Growing focus on Industry 4.0, digital factories, and sustainable manufacturing practices further supports market expansion across Europe, reinforcing steady demand for high-performance inspection technologies.
Asia Pacific
Asia Pacific held the largest share of 34.7% in 2024 in the Surface Inspection Market, fueled by rapid industrialization and expanding manufacturing capacity in China, Japan, South Korea, and India. Strong growth in electronics, semiconductor, automotive, and consumer goods manufacturing significantly boosts demand for surface inspection solutions. Increasing investments in smart factories, rising labor costs, and government initiatives supporting automation drive adoption. The region’s dominance is reinforced by high-volume production environments that require fast, accurate, and scalable inspection systems.
Latin America
Latin America represented 4.1% market share in 2024 in the Surface Inspection Market, supported by gradual modernization of manufacturing infrastructure in countries such as Brazil and Mexico. Growth is driven by increasing adoption of automation in automotive assembly, food processing, and packaging industries. Multinational manufacturers operating in the region are implementing surface inspection systems to meet global quality standards. Although adoption remains slower compared to developed regions, rising foreign investment and industrial upgrades continue to create steady growth opportunities.
Middle East & Africa
The Middle East & Africa accounted for 3.0% market share in 2024 in the Surface Inspection Market, driven by expanding industrial and manufacturing activities in the UAE, Saudi Arabia, and South Africa. Growth is supported by investments in industrial diversification, automotive assembly, and metal processing sectors. Increasing focus on improving product quality, reducing waste, and adopting automation technologies supports demand. While market penetration remains limited, government-led industrial development programs and infrastructure expansion continue to enhance long-term growth prospects.
Market Segmentations:
By Component
- Camera
- Optics
- Lighting Equipment
- Frame Grabber
- Software
By Surface Type
- 2D
- 3D
By System
- Computer-based system
- Camera-based system
By Application
- Semiconductor
- Automotive
- Electronics
- Glass & Metal
- Medical & Pharmaceutical
By Geography
- North America
- U.S.
- Canada
- Mexico
- Europe
- Germany
- France
- U.K.
- Italy
- Spain
- Rest of Europe
- Asia Pacific
- China
- Japan
- India
- South Korea
- South-east Asia
- Rest of Asia Pacific
- Latin America
- Brazil
- Argentina
- Rest of Latin America
- Middle East & Africa
- GCC Countries
- South Africa
- Rest of the Middle East and Africa
Competitive Landscape
Key players operating in the Surface Inspection Market include Omron Corporation, Panasonic Corporation, Keyence Corporation, Cognex Corporation, Teledyne Technologies, Inc., Basler AG, ISRA Vision AG (Atlas Copco), Ametek, Inc., VITRONIC Machine Vision, and Matrox Electronic Systems Ltd. The market is characterized by strong focus on technological innovation, particularly in machine vision, AI-driven defect detection, and high-resolution imaging systems. Leading companies continuously invest in advanced cameras, software platforms, and integrated inspection solutions to address growing demand from automotive, electronics, semiconductor, and packaging industries. Strategic partnerships with automation providers and system integrators strengthen market presence and expand application reach. Companies also emphasize customized inspection solutions, scalability, and seamless integration with smart factory environments. Geographic expansion, product upgrades, and acquisitions remain key strategies to enhance portfolios and meet evolving quality control requirements across global manufacturing sectors.
Key Player Analysis
- VITRONIC Machine Vision
- Ametek, Inc.
- Panasonic Corporation
- Matrox Electronic Systems Ltd.
- Cognex Corporation
- Basler AG
- Omron Corporation
- Teledyne Technologies, Inc.
- ISRA Vision AG (Atlas Copco)
- Keyence Corporation
Recent Developments
- In September 2025, GelSight launched a cutting-edge precision inspection system utilizing tactile sensing and advanced imaging for micron-level accuracy on previously unreachable surfaces in aerospace and automotive sectors.
- In January 2025, Wabtec Corporation agreed to acquire Evident’s Inspection Technologies division for $1.78 billion to enhance non-destructive testing and remote visual inspection capabilities.
- In June 2025, Cognex Corporation unveiled OneVision™, a cloud-based platform that transforms how manufacturers build, train, and scale AI-powered vision applications across surface inspection and quality control tasks.
- In March 2025, Keyence Corporation launched a vision sensor with built-in AI to automate part detection, position verification, and counting under challenging conditions, enhancing surface inspection capabilities
Report Coverage
The research report offers an in-depth analysis based on Component, Surface Type, System, Application and Geography. It details leading market players, providing an overview of their business, product offerings, investments, revenue streams, and key applications. Additionally, the report includes insights into the competitive environment, SWOT analysis, current market trends, as well as the primary drivers and constraints. Furthermore, it discusses various factors that have driven market expansion in recent years. The report also explores market dynamics, regulatory scenarios, and technological advancements that are shaping the industry. It assesses the impact of external factors and global economic changes on market growth. Lastly, it provides strategic recommendations for new entrants and established companies to navigate the complexities of the market.
Future Outlook
- The Surface Inspection Market will continue to expand driven by increasing automation across global manufacturing industries.
- Adoption of AI and deep learning–based inspection systems will improve defect detection accuracy and operational efficiency.
- Growing implementation of Industry 4.0 and smart factory initiatives will accelerate demand for advanced surface inspection solutions.
- High-resolution imaging and sensor innovations will enhance inspection capabilities for complex and micro-scale surfaces.
- Integration of surface inspection systems with manufacturing execution and quality management systems will increase.
- Rising quality and safety regulations will push manufacturers toward automated inspection over manual processes.
- Demand from electronics, semiconductor, and automotive manufacturing will remain a primary growth contributor.
- Emerging economies will witness faster adoption as industrial automation investments increase.
- System flexibility and scalability will become key purchasing criteria for manufacturers.
- Ongoing advancements in software analytics will enable predictive quality control and process optimization.
Request a Free Sample
Fill in your details and we'll send you a free sample report.
- Sample data tables & charts
- Research methodology
Need a Custom Version of This Report?
Tailor the scope, geography, or segments to your exact requirements.
- Custom geography or segment scope
- Direct access to our analyst team
Frequently Asked Questions
What is the current market size for the Surface Inspection Market, and what is its projected size in 2032?
At what Compound Annual Growth Rate is the Surface Inspection Market projected to grow between 2024 and 2032?
What industries benefit from surface inspection solutions?
How does surface inspection technology work?
What are the benefits of implementing surface inspection systems?
Who are the leading companies in the Surface Inspection Market?
Table of Content
Chapter 1. Report Introduction
- 1.1 Report Description & Purpose
- 1.1.1 Report Title & Market Definition
- 1.1.2 Unique Selling Propositions (USP) & Key Differentiators
- 1.1.3 Value Proposition for Stakeholders
- 1.2 Research Objectives
- 1.2.1 Market Sizing Objectives (Volume & Revenue)
- 1.2.2 Segmentation Objectives
- 1.2.3 Competitive Intelligence Objectives
- 1.2.4 Forecast & Scenario Objectives
- 1.3 Report Scope
- 1.3.1 Surface Inspection Scope – Types & Subtypes Covered
- 1.3.2 Geographic Scope – Regions & Countries Covered
- 1.3.3 Historical Period, Base Year & Forecast Period (2024; forecast to 2032)
- 1.3.4 Inclusions & Exclusions
- 1.4 HS Code & Classification Framework
- 1.5 Currency, Units & Pricing Basis
- 1.6 Target Stakeholders
- 1.7 Limitations & Assumptions
Chapter 2. Executive Summary
- 2.1 Global Surface Inspection Market Snapshot
- 2.1.1 Market Size – Historical (2024) & Forecast (2024-2032) (2024: USD 4,858 million → 2032: USD 8,998.11 million)
- 2.1.2 Volume & Revenue – Global Totals
- 2.1.3 Key Market Highlights – Top Five Facts
- 2.2 Surface Inspection Market Segmentation Snapshot
- 2.2.1 Market Split by Region – 2024 vs. 2032
- 2.3 Competitive Snapshot
- 2.3.1 Top 10 Players by Revenue Share – 2024
- 2.3.2 Top 10 Players by Volume Share – 2024
- 2.3.3 Recent Strategic Developments (18-Month Summary)
- 2.4 Key Investment Highlights & Strategic Conclusions
Chapter 3. Surface Inspection Market Dynamics & Industry Analysis
- 3.1 Market Overview & Context
- 3.1.1 Surface Inspection Market Position in the Broader Automotive Value Chain
- 3.1.2 OEM vs. Replacement Market Dynamics
- 3.1.3 Market Maturity & Development Stage by Region
- 3.2 Surface Inspection Market Drivers
- 3.3 Surface Inspection Market Restraints & Challenges
- 3.4 Surface Inspection Market Opportunities
- 3.5 Porter's Five Forces Analysis
- 3.5.1 Threat of New Entrants
- 3.5.2 Bargaining Power of Suppliers
- 3.5.3 Bargaining Power of Buyers
- 3.5.4 Threat of Substitutes
- 3.5.5 Competitive Rivalry – Intensity Assessment
- 3.6 Surface Inspection Value Chain Analysis
- 3.6.1 Upstream – Raw Material/Input Suppliers
- 3.6.1.1 Raw Material/Input 1
- 3.6.1.2 Raw Material/Input 2
- 3.6.1.3 Raw Material/Input 3
- 3.6.2 Midstream – Production/Manufacturing/Service Delivery
- 3.6.2.1 Production/Process Overview
- 3.6.2.2 Key Facility Locations & Capacity by Manufacturer
- 3.6.3 Downstream – Distribution & End Consumer
- 3.6.3.1 Primary Channel – B2B/OEM
- 3.6.3.2 Secondary Channels – Dealer, Retail, Online, Direct
- 3.6.4 Value Chain Profitability Analysis
- 3.6.1 Upstream – Raw Material/Input Suppliers
- 3.7 PESTEL Analysis
- 3.7.1 Political Factors
- 3.7.2 Economic Factors
- 3.7.3 Social Factors
- 3.7.4 Technological Factors
- 3.7.5 Environmental Factors
- 3.7.6 Legal Factors
- 3.8 Surface Inspection Supply Chain Analysis
- 3.8.1 Raw Material/Input Supply Risk Assessment
- 3.8.2 Manufacturing Concentration Risk (Geographic Exposure)
- 3.8.3 Trade Disruption Impact Analysis
- 3.9 Regulatory & Policy Landscape
Note: The regulatory and policy landscape section covers regulations based on their applicability to the market, Surface Inspection category, geography, and scope of the study. Only regulatory frameworks with a material impact on operations, compliance, trade, sustainability, or market access are analyzed in detail.
Chapter 4. Key Investment Pockets & Opportunity Analysis
- 4.1 Surface Inspection Market Attractiveness Analysis
- 4.1.1 By Region – Investment Attractiveness Matrix (Volume × CAGR)
- 4.2 Absolute Revenue Growth Opportunity
- 4.2.1 By Region – Absolute USD Growth Through 2032
- 4.3 Incremental Volume Opportunity
- 4.3.1 By Region – Incremental Volume Through 2032
- 4.3.2 Segment – Incremental Volume
- 4.4 Emerging Submarket Opportunity Deep Dive (Subject to Applicability)
- 4.5 Emerging Market Opportunity Scorecards
- 4.5.1 United States
- 4.5.2 Europe
- 4.5.3 Asia
- 4.5.4 Middle East & Africa
Note: Emerging Market Opportunity Scorecards will be included based on relevance and strategic importance. Regions listed are indicative and may vary depending on data availability and market dynamics.
Chapter 5. Surface Inspection Import-Export Analysis & Trade Flows
- 5.1 Global Trade Overview
- 5.1.1 Global Export Value by Country (2024)
- 5.1.2 Global Export Volume by Country (2024)
- 5.1.3 Global Import Value by Country (2024)
- 5.1.4 Global Import Volume by Country (2024)
- 5.1.5 Net Trade Balance by Country (2024)
- 5.2 Export Analysis – Segment
- 5.2.1 Type 1 (HS Code)
- 5.2.2 Type 2 (HS Code)
- 5.2.3 Type 3 (HS Code)
- 5.2.4 Type 4 (HS Code)
- 5.2.5 Type 5 (HS Code)
- 5.3 Import Analysis – Segment
- 5.3.1 Type 1 (HS Code)
- 5.3.2 Type 2 (HS Code)
- 5.3.3 Type 3 (HS Code)
- 5.3.4 Type 4 (HS Code)
- 5.3.5 Type 5 (HS Code)
- 5.4 Average Unit Trade Prices
- 5.4.1 Average Export Price – Segment & Country
- 5.4.2 Average Import Price – Segment & Source Country
- 5.4.3 Price Trends (2024)
- 5.5 Key Trade Route Analysis
- 5.5.1 Trade Route 1
- 5.5.2 Trade Route 2
- 5.5.3 Trade Route 3
- 5.5.4 Trade Route 4
- 5.5.5 Trade Route 5
- 5.6 Trade Policy Impact Assessment
- 5.6.1 US Anti-Dumping & Section 301 Tariffs
- 5.6.2 EU Customs Union Impact
- 5.6.3 Major Free Trade Agreements
- 5.6.4 USMCA Rules of Origin
Note: Trade policy analysis will be included only where relevant to the Surface Inspection market.
Chapter 6. Competitive Landscape & Company Benchmarking
- 6.1 Surface Inspection Market Concentration & Structure
- 6.1.1 Herfindahl-Hirschman Index (HHI) – vs. 2024
- 6.1.2 Tier 1, Tier 2 & Tier 3 Market Structure
- 6.1.3 Global, Regional & Local Player Dynamics
- 6.2 Surface Inspection Market Share Analysis – 2024
- 6.2.1 Global Revenue Share by Company
- 6.2.2 Global Volume Share by Company
- 6.2.3 Regional Revenue Share
- 6.2.4 Market Share Evolution ( vs. 2024)
- 6.2.5 OEM Segment Share by Company
- 6.2.6 Replacement Segment Share by Company
- 6.3 Production/Delivery Capacity & Facility Analysis
- 6.3.1 Global Installed Capacity
- 6.3.2 Capacity Utilization Rates
- 6.3.3 Production/Output Volume
- 6.3.4 Facility Locations & Capacity Map
- 6.3.5 Planned Capacity Additions
- 6.4 Surface Inspection Competitive Benchmarking Matrix
- 6.4.1 Revenue, Volume, CAGR & Profitability Comparison
- 6.4.2 Channel Revenue Mix
- 6.4.3 Geographic Revenue Exposure
- 6.4.4 R&D Intensity
- 6.4.5 Sustainability Maturity
- 6.5 Strategic Developments in Surface Inspection (Last 24 Months)
- 6.5.1 Mergers, Acquisitions & Divestments
- 6.5.2 New Surface Inspection Launches
- 6.5.3 Facility Expansions
- 6.5.4 Strategic Alliances, Joint Ventures & Partnerships
- 6.5.5 Distribution Expansion & Market Entry
- 6.5.6 Sustainability & ESG Initiatives
- 6.6 Competitive Strategy Mapping
- 6.6.1 Leader, Challenger, Follower & Niche Classification
- 6.6.2 Pricing Strategy Comparison
- 6.6.3 Channel Strategy Matrix
Note: Strategic developments are included based on their materiality and the availability of reliable information.
Chapter 7. Global Surface Inspection Market – By Distribution Channel
- 7.1 Segment Overview
- 7.1.1 Volume & Revenue Split by Channel (2024 & 2032)
- 7.1.2 Channel Mix Evolution (2024-2032)
Chapter 8. Regional Market Analysis – Global Overview
- 8.1 Global Regional Overview
- 8.1.1 Regional Volume Share
- 8.1.2 Regional Revenue Share
- 8.1.3 Regional Volume by Region
- 8.1.4 Regional Revenue by Region
- 8.1.5 Regional Forecast Through 2032
- 8.2 Cross-Regional Segment Analysis
- 8.2.1 By Distribution Channel
- 8.2.2 By Brand/Price Tier
Chapter 9. North America Surface Inspection Market
- 9.1 United States
- 9.2 Canada
- 9.3 Mexico
Chapter 10. Europe Surface Inspection Market
- 10.1 Germany
- 10.2 France
- 10.3 Italy
- 10.4 United Kingdom
- 10.5 Spain
- 10.6 Poland
- 10.7 Russia
- 10.8 Netherlands
- 10.9 Belgium
- 10.10 Sweden
- 10.11 Denmark
- 10.12 Norway
- 10.13 Rest of Europe
Chapter 11. Asia Pacific Surface Inspection Market
- 11.1 China
- 11.2 India
- 11.3 Japan
- 11.4 South Korea
- 11.5 Thailand
- 11.6 Indonesia
- 11.7 Vietnam
- 11.8 Malaysia
- 11.9 Australia
- 11.10 Rest of Asia Pacific
Chapter 12. Latin America Surface Inspection Market
- 12.1 Brazil
- 12.2 Argentina
- 12.3 Colombia
- 12.4 Chile
- 12.5 Rest of Latin America
Chapter 13. Middle East Surface Inspection Market
- 13.1 Saudi Arabia
- 13.2 United Arab Emirates
- 13.3 Turkey
- 13.4 Israel
- 13.5 Iran
- 13.6 Rest of the Middle East
Chapter 14. Africa Surface Inspection Market
- 14.1 South Africa
- 14.2 Egypt
- 14.3 Nigeria
- 14.4 Morocco
- 14.5 Rest of Africa
Chapter 15. Surface Inspection Company Profiles
- 15.1 [Company 01]
- 15.1.1 Company Overview
- 15.1.2 Key Management Personnel
- 15.1.3 Products & Services Portfolio
- 15.1.4 Financial Performance
- 15.1.5 Key Market Focus & Geographic Presence
- 15.1.6 Recent Developments & Strategic Initiatives
Note: The company profile list is preliminary and may change based on research findings, market developments, data availability, and client requirements.
Chapter 16. Appendices
- Appendix A – List of Abbreviations & Acronyms
- Appendix B – Industry Classification Code Reference – Full Series
- Appendix C – Production & Capacity Data Tables
- Appendix D – End-Use & Demand Base Tables
- Appendix E – Consumption & Replacement Rate Assumptions
- Appendix F – ASP Reference Tables
- Appendix G – Manufacturing & Facility Database
- Appendix H – Import-Export Data Tables
- Appendix I – Regulatory Summary Tables
- Appendix J – Primary Research Participant List (Anonymized)
- Appendix K – Primary Research Questionnaire Framework
- Appendix L – Data Sources & Bibliography
- Appendix M – Market Size Divergence & Source Comparison
Chapter 17. Research Methodology
- 17.1 Research Framework & Philosophy
- 17.2 Secondary Research – Sources, Hierarchy & Data Extraction
- 17.3 Data Modeling – Bottom-Up & Top-Down Market Sizing
- 17.4 Primary Research – Stakeholder Framework, LOI & Sample Sizes
- 17.5 Forecast Methodology – Regression, Scenario & Sensitivity Analysis
- 17.6 Quality Control – Four-Layer Validation Framework
- 17.7 Limitations & Standard Assumptions
- 17.8 Disclaimer
