
Market Overview
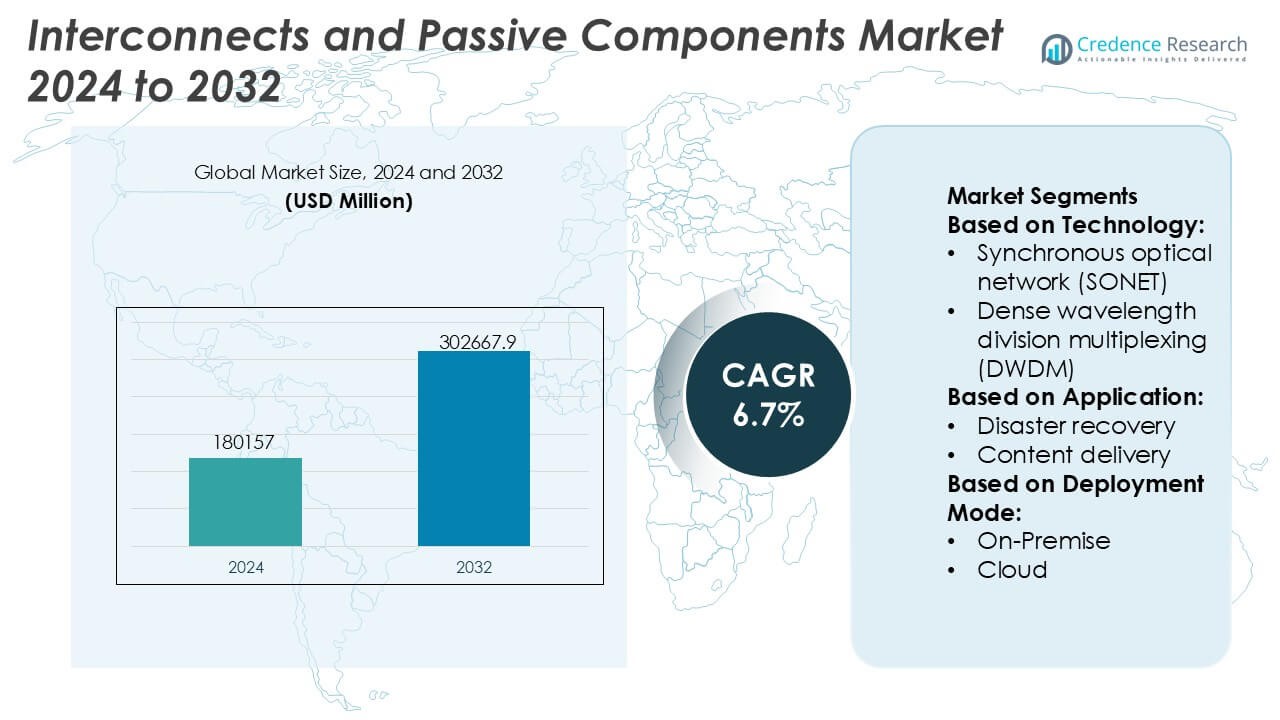
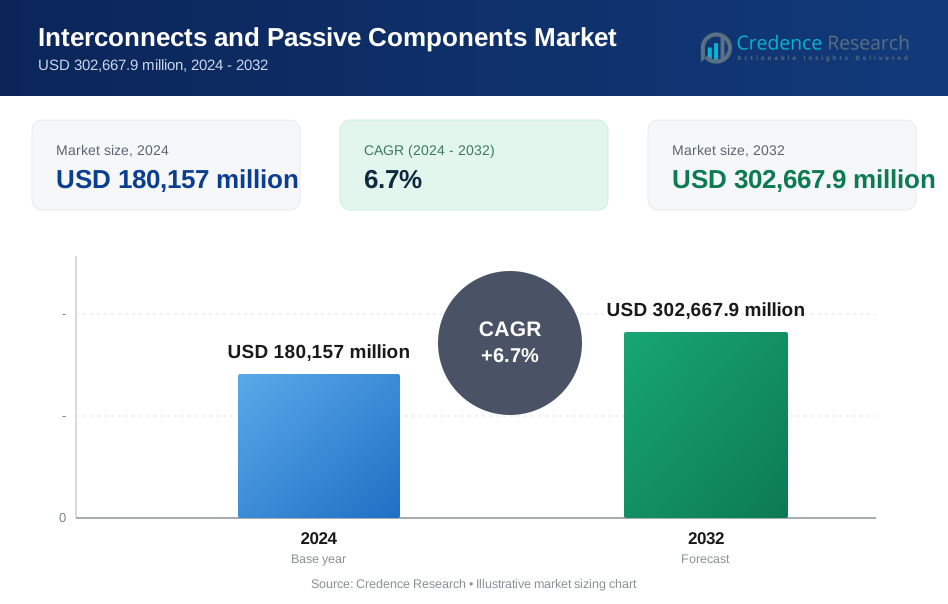
Interconnects and Passive Components Market size was valued USD 180157 million in 2024 and is anticipated to reach USD 302667.9 million by 2032, at a CAGR of 6.7% during the forecast period.
| REPORT ATTRIBUTE | DETAILS |
|---|---|
| Historical Period | 2020-2023 |
| Base Year | 2024 |
| Forecast Period | 2025-2032 |
| Interconnects and Passive Components Market Size 2024 | USD 180157 Million |
| Interconnects and Passive Components Market , CAGR | 6.7% |
| Interconnects and Passive Components Market Size 2032 | USD 302667.9 Million |
The Interconnects and Passive Components Market is led by globally established manufacturers such as Murata Manufacturing Co., Ltd., TDK Corporation, SAMSUNG ELECTRO-MECHANICS, Vishay Intertechnology, Inc., YAGEO Group, TE Connectivity, KYOCERA AVX Components Corporation, NICHICON CORPORATION, TAIYO YUDEN CO., LTD., and Hosiden Corporation, which compete through scale, advanced material technologies, and broad product portfolios. These players focus on high-frequency performance, miniaturization, reliability, and application-specific solutions to serve automotive, telecommunications, industrial, and consumer electronics sectors. Regionally, Asia-Pacific leads the market with an exact 36% share, supported by strong electronics manufacturing ecosystems, high-volume production of consumer devices, and rapid expansion of 5G, electric vehicles, and industrial automation across major economies.
Market Insights
- The Interconnects and Passive Components Market was valued at USD 180,157 million in 2024 and is projected to reach USD 302,667.9 million by 2032, expanding at a CAGR of 6.7%, driven by rising electronic content across multiple industries.
- Market growth is primarily driven by expanding 5G infrastructure, data centers, electric vehicles, and industrial automation, which increase demand for high-frequency connectors, capacitors, resistors, and inductors with improved reliability and miniaturization.
- Key trends include component miniaturization, higher power density, adoption of advanced ceramic and polymer materials, and growing demand for application-specific and high-reliability solutions across automotive and telecom segments.
- Competition remains intense, with leading players focusing on scale, vertical integration, R&D investments, and long-term OEM partnerships to strengthen product portfolios and global supply capabilities.
- Asia-Pacific leads with an exact 36% market share, supported by large-scale electronics manufacturing, while capacitors and connectors remain dominant segments due to their extensive use across consumer, automotive, and industrial applications.
Market Segmentation Analysis:
By Technology
The interconnects and passive components market, by technology, remains anchored by Ethernet, which holds the dominant position with an exact 46% market share due to its scalability, cost efficiency, and broad compatibility across enterprise and data center networks. Ethernet continues to benefit from sustained upgrades to 25G, 100G, and 400G architectures supporting high-speed switching and low-latency connectivity. DWDM follows closely, driven by long-haul and metro optical capacity expansion. However, Ethernet’s standardized protocols, simplified network management, and suitability for cloud-native workloads reinforce its leadership across hyperscale and enterprise environments.
- For instance, Vishay Intertechnology, Inc. Ultra-low ESR polymer tantalum capacitors (like the T55 and T58 series) that feature ESR values as low as 7 mΩ and high ripple current capabilities suitable for power management in Ethernet switches.
By Application
By application, Cloud Connectivity emerges as the leading sub-segment with an exact 39% market share, supported by rapid expansion of hyperscale data centers and hybrid cloud architectures. Rising inter-data-center traffic, increased adoption of SaaS platforms, and demand for low-latency, high-bandwidth connections drive deployment of advanced interconnect solutions. Content delivery and data replication also contribute to growth, particularly for real-time services. However, cloud connectivity dominates due to continuous investments in optical backbones, high-density passive components, and resilient network architectures enabling seamless workload mobility and scalability.
- For instance, Vishay Intertechnology, Inc. Ultra-low ESR polymer tantaluFor instance, TAIYO YUDEN CO., LTD. has developed multilayer ceramic capacitors for cloud and data-center networking that achieve high capacitance values (such as up to 10 µF in 1206 case sizes or 1,000 µF in larger case sizes), rated voltages of 6.3 V, and stable X7R dielectric performance across −55 °C to 125 °C.m capacitors (like the T55 and T58 series) that feature ESR values as low as 7 mΩ and high ripple current capabilities suitable for power management in Ethernet switches.
By Deployment Mode
In terms of deployment mode, Hybrid deployment leads the market with an exact 42% market share, reflecting enterprises’ preference for balancing control, security, and scalability. Hybrid environments rely heavily on robust interconnects and passive components to ensure reliable data flow between on-premise infrastructure and cloud platforms. This dominance is driven by regulatory compliance requirements, latency-sensitive applications, and gradual cloud migration strategies. While cloud-only deployments expand steadily, hybrid models remain critical for enterprises managing legacy systems alongside modern digital workloads, sustaining strong demand for flexible, high-performance interconnection solutions.
Key Growth Drivers
Expansion of High-Speed Data and Communication Infrastructure
Rapid deployment of 5G networks, fiber-optic backbones, and hyperscale data centers significantly drives demand for advanced interconnects and passive components. High-frequency connectors, low-loss cables, and precision passives support higher bandwidth, reduced latency, and signal integrity across dense network architectures. Telecom operators and cloud service providers increasingly prioritize components that enable faster data transmission and scalable network upgrades. This sustained infrastructure expansion across enterprise, carrier, and data center environments continues to accelerate volume adoption and technological advancement within the market.
- For instance, Samsung Electro-Mechanics has commercialized ultra-small MLCCs measuring 0201 size with high capacitance values up to 4.7 µF and voltage ratings of 6.3 V, which are designed to maintain stable impedance at frequencies exceeding 6 GHz. In parallel, its high-frequency MLCCs for 5G base stations utilize low-loss materials to demonstrate very low dielectric loss enabling superior performance in advanced network hardware.
Rising Electronics Miniaturization and System Integration
Ongoing miniaturization of electronic devices drives the need for compact, high-performance interconnects and passive components. Consumer electronics, industrial automation systems, and automotive electronics increasingly require smaller form factors without compromising electrical performance or reliability. Advanced surface-mount passives, fine-pitch connectors, and high-density interconnect solutions support multilayer PCB designs and integrated modules. Manufacturers invest in material innovations and precision manufacturing to meet tight tolerances, thermal stability requirements, and high-cycle durability, reinforcing steady demand across diversified electronics applications.
- For instance, Nichicon Corporation has introduced conductive polymer aluminum solid capacitors in various case sizes that deliver high capacitance values up to 560 µF (in larger sizes) with ESR values down to 12 mΩ. Specific high-reliability series offer ripple current ratings exceeding 6.0 A and operational lifetimes of 2,000 hours at 125 °C, supporting dense system-in-package designs and high-cycle durability requirements in miniaturized consumer and industrial electronics.
Growth of Electric Vehicles and Advanced Automotive Electronics
The rapid shift toward electric vehicles and software-defined automotive architectures strongly boosts demand for robust interconnects and passive components. High-voltage connectors, power resistors, capacitors, and shielding solutions support battery management systems, power electronics, infotainment, and advanced driver-assistance systems. Automotive OEMs require components capable of withstanding vibration, temperature extremes, and electromagnetic interference. Increasing electronic content per vehicle and rising production of EV platforms continue to strengthen long-term demand across automotive supply chains.
Key Trends & Opportunities
Adoption of High-Frequency and High-Power Components
Increasing use of millimeter-wave communication, radar systems, and high-power electronics creates strong opportunities for specialized interconnects and passive components. Applications in 5G base stations, aerospace systems, and industrial power electronics demand components with superior signal integrity, thermal management, and low insertion loss. Suppliers focusing on advanced dielectric materials, precision impedance control, and enhanced heat dissipation gain competitive advantage as customers prioritize reliability under extreme operating conditions.
- For instance, TE Connectivity has commercialized SMPM and NanoRF connector families engineered for frequencies up to 65 GHz with excellent insertion and return loss characteristics, and robust mating durability exceeding 500 cycles.
Shift Toward Customization and Application-Specific Design
End users increasingly seek customized interconnect and passive solutions tailored to specific electrical, mechanical, and environmental requirements. This trend supports opportunities for manufacturers offering co-design capabilities, rapid prototyping, and application engineering support. Custom solutions enable optimized performance in complex systems such as medical devices, industrial robotics, and automotive platforms. Growing collaboration between component suppliers and OEMs strengthens long-term partnerships and increases switching costs, supporting sustained revenue growth.
- For instance, YAGEO Group, through its Pulse Electronics and KEMET divisions, delivers application-specific power magnetics and ceramic capacitor solutions, including custom automotive-grade MLCCs rated for operating temperatures up to 150 °C with AEC-Q200 qualification and DC bias stability validated under 16 V bias conditions, as well as shielded power inductors supporting saturation currents up to 72 A and inductance tolerances within ±20 %, enabling OEMs to meet stringent performance and durability requirements in customized system designs.
Integration with Smart Manufacturing and Quality Traceability
Manufacturers increasingly integrate digital monitoring, automation, and traceability into component production processes. Smart manufacturing improves consistency, yield, and defect detection for high-volume passive components and precision connectors. Enhanced quality control supports compliance with stringent industry standards in automotive, aerospace, and medical sectors. This trend creates opportunities for suppliers that invest in advanced inspection systems, process analytics, and digital quality documentation to meet evolving customer expectations.
Key Challenges
Volatility in Raw Material Supply and Pricing
Interconnects and passive components rely heavily on metals, ceramics, and specialty polymers that face supply disruptions and price fluctuations. Copper, precious metals, and advanced ceramic materials experience volatility due to geopolitical risks, mining constraints, and energy costs. These factors pressure margins and complicate long-term pricing strategies for manufacturers. Managing supplier diversification, inventory planning, and material substitution without compromising performance remains a persistent operational challenge across the market.
Increasing Design Complexity and Qualification Requirements
Rising system complexity places greater technical demands on interconnects and passive components. Higher frequencies, tighter tolerances, and harsher operating environments increase design and testing complexity. Components must meet rigorous electrical, mechanical, and regulatory standards, extending development cycles and qualification costs. Smaller suppliers face challenges in maintaining compliance across multiple industries, while delays in certification can limit time-to-market and competitiveness in fast-evolving application segments.
Regional Analysis
North America North America holds a significant share of the Interconnects and Passive Components Market, accounting for approximately 31% of global demand. The region benefits from strong investments in data centers, 5G infrastructure, aerospace, and defense electronics. High adoption of advanced automotive electronics and electric vehicles further supports demand for high-reliability connectors, capacitors, and resistors. The presence of leading OEMs, semiconductor companies, and system integrators accelerates innovation and early adoption of high-frequency and high-density interconnect solutions. Stringent quality standards and focus on performance-critical applications continue to sustain steady market growth across the region.
Europe
Europe represents around 24% of the global market share, driven by robust demand from automotive manufacturing, industrial automation, and renewable energy systems. The region emphasizes reliability, safety, and compliance, supporting strong uptake of precision passive components and ruggedized interconnects. Growth in electric mobility, rail electronics, and smart factory initiatives strengthens demand for high-voltage connectors, power capacitors, and EMI suppression components. Germany, France, and the Nordic countries remain key contributors due to advanced manufacturing ecosystems. Regulatory alignment and long product qualification cycles provide stability, supporting consistent long-term demand across European end-use industries.
Asia-Pacific
Asia-Pacific dominates the Interconnects and Passive Components Market with an estimated 36% market share, supported by large-scale electronics manufacturing and high consumer electronics output. China, Japan, South Korea, and Taiwan drive volume demand for capacitors, resistors, inductors, and connectors used in smartphones, consumer devices, and networking equipment. Rapid expansion of 5G networks, electric vehicles, and industrial automation further accelerates adoption. Strong supply chain integration, cost-efficient manufacturing, and continuous capacity expansion position Asia-Pacific as the primary global production hub, reinforcing its leadership across both volume and technology-driven segments.
Latin America
Latin America accounts for approximately 5% of the global market, supported by gradual industrialization and expanding telecommunications infrastructure. Growth in automotive assembly, consumer electronics distribution, and energy projects drives moderate demand for interconnects and passive components. Brazil and Mexico serve as key markets due to manufacturing activity and proximity to North American supply chains. While the region relies heavily on imports, increasing investments in electronics assembly and network modernization improve consumption levels. Market expansion remains steady, supported by infrastructure upgrades and rising adoption of connected industrial and commercial systems.
Middle East & Africa
The Middle East & Africa region holds nearly 4% of the global market share, driven by investments in telecom infrastructure, energy projects, and smart city developments. Demand concentrates on reliable interconnects and passive components for power distribution, industrial automation, and communication networks. Gulf countries lead regional consumption through large-scale digital infrastructure and transportation projects, while parts of Africa show emerging demand tied to mobile connectivity expansion. Although market penetration remains lower than other regions, long-term infrastructure development and modernization initiatives support gradual growth across the region.
Market Segmentations:
By Technology:
- Synchronous optical network (SONET)
- Dense wavelength division multiplexing (DWDM)
By Application:
- Disaster recovery
- Content delivery
By Deployment Mode:
- On-Premise
- Cloud
By Geography
- North America
- U.S.
- Canada
- Mexico
- Europe
- Germany
- France
- U.K.
- Italy
- Spain
- Rest of Europe
- Asia Pacific
- China
- Japan
- India
- South Korea
- South-east Asia
- Rest of Asia Pacific
- Latin America
- Brazil
- Argentina
- Rest of Latin America
- Middle East & Africa
- GCC Countries
- South Africa
- Rest of the Middle East and Africa
Competitive Landscape
The Interconnects and Passive Components Market features a competitive landscape defined by scale, technological depth, and broad application coverage, led by Hosiden Corporation, Vishay Intertechnology, Inc., TAIYO YUDEN CO., LTD., SAMSUNG ELECTRO-MECHANICS, NICHICON CORPORATION, TE Connectivity, YAGEO Group, Murata Manufacturing Co., Ltd., KYOCERA AVX Components Corporation, and TDK Corporation. The Interconnects and Passive Components Market exhibits a highly competitive structure characterized by technological innovation, scale-driven manufacturing, and broad application reach. Companies compete by enhancing component performance in terms of signal integrity, power handling, thermal stability, and miniaturization to meet the evolving requirements of advanced electronic systems. Strategic focus areas include continuous investment in research and development, expansion of high-volume manufacturing capacity, and adoption of advanced materials and precision manufacturing processes. Suppliers emphasize application-specific solutions, quality assurance, and long-term supply reliability to strengthen relationships with OEMs and system integrators. Global production networks and efficient supply chain management play a critical role in maintaining cost competitiveness and responsiveness. Overall, competition intensifies as demand grows across automotive electronics, telecommunications, data centers, and industrial automation, driving sustained innovation and operational efficiency.
Key Player Analysis
- Hosiden Corporation
- Vishay Intertechnology, Inc.
- TAIYO YUDEN CO., LTD.
- SAMSUNG ELECTRO-MECHANICS
- NICHICON CORPORATION
- TE Connectivity
- YAGEO Group
- Murata Manufacturing Co., Ltd.
- KYOCERA AVX Components Corporation
- TDK Corporation
Recent Developments
- In February 2025, Samtec appointed TTI, Inc. Europe, as an authorized global distributor for its full range of cables and connectors. This partnership enables TTI, Inc., to leverage its extensive international supply chain and inventory management expertise to deliver Samtec's high-performance connector, cable, and fiber optic products to electronic manufacturers worldwide.
- In November 2024, Nokia partnered with Dutch hosting provider Cloudbear to deploy Nokia's data center fabric switches and gateway routers on Cloudbear's Kubernetes-based (CBWS) platform, enhancing their European hosting services for faster, more secure, and scalable cloud solutions, especially for SaaS.
- In February 2024, Samtec introduced the ERM6 and ERF6 Series, an extension to its Edge Rate connector family. These new connectors feature a high-density mated set with a narrow body width of 2.5 mm and a low-profile 5 mm mated height, supporting high-speed applications up to 56 Gbps PAM4.
- In January 2024, Murata Manufacturing Co., Ltd. unveiled the DFE2MCPH_JL series, a collection of automotive-grade power inductors designed for automotive powertrain/safety equipment, available in 0.33µH and 0.47µH variants.
Report Coverage
The research report offers an in-depth analysis based on Technology, Application, Deployment Mode and Geography. It details leading market players, providing an overview of their business, product offerings, investments, revenue streams, and key applications. Additionally, the report includes insights into the competitive environment, SWOT analysis, current market trends, as well as the primary drivers and constraints. Furthermore, it discusses various factors that have driven market expansion in recent years. The report also explores market dynamics, regulatory scenarios, and technological advancements that are shaping the industry. It assesses the impact of external factors and global economic changes on market growth. Lastly, it provides strategic recommendations for new entrants and established companies to navigate the complexities of the market.
Future Outlook
- Demand will continue to rise with sustained expansion of 5G, data centers, and high-speed communication networks.
- Component designs will increasingly focus on higher frequencies, lower losses, and improved signal integrity.
- Miniaturization will remain a priority to support compact, high-density electronic systems.
- Electric vehicles will drive higher adoption of high-voltage and high-reliability interconnect and passive solutions.
- Industrial automation will accelerate demand for durable components capable of operating in harsh environments.
- Advanced materials will gain importance to improve thermal stability, efficiency, and lifecycle performance.
- Custom and application-specific component development will strengthen collaboration between suppliers and OEMs.
- Smart manufacturing adoption will enhance quality control, consistency, and production efficiency.
- Supply chain resilience will become a strategic focus to manage material availability and lead-time risks.
- Regulatory and performance standards will continue to shape design, testing, and qualification requirements.
Request a Free Sample
Fill in your details and we'll send you a free sample report.
- Sample data tables & charts
- Research methodology
Need a Custom Version of This Report?
Tailor the scope, geography, or segments to your exact requirements.
- Custom geography or segment scope
- Direct access to our analyst team
Frequently Asked Questions
What is the current market size for the Interconnects and Passive Components Market, and what is its projected size in 2032?
At what Compound Annual Growth Rate is the Interconnects and Passive Components Market projected to grow between 2024 and 2032?
Which Interconnects and Passive Components Market segment held the largest share in 2024?
What are the primary factors fueling the growth of the Interconnects and Passive Components Market?
Who are the leading companies in the Interconnects and Passive Components Market?
Which region commanded the largest share of the Interconnects and Passive Components Market in 2024?
Table of Content
Chapter 1. Report Introduction
- 1.1 Report Description & Purpose
- 1.1.1 Report Title & Market Definition
- 1.1.2 Unique Selling Propositions (USP) & Key Differentiators
- 1.1.3 Value Proposition for Stakeholders
- 1.2 Research Objectives
- 1.2.1 Market Sizing Objectives (Volume & Revenue)
- 1.2.2 Segmentation Objectives
- 1.2.3 Competitive Intelligence Objectives
- 1.2.4 Forecast & Scenario Objectives
- 1.3 Report Scope
- 1.3.1 Interconnects and Passive Components Scope – Types & Subtypes Covered
- 1.3.2 Geographic Scope – Regions & Countries Covered
- 1.3.3 Historical Period, Base Year & Forecast Period (2024; forecast to 2032)
- 1.3.4 Inclusions & Exclusions
- 1.4 HS Code & Classification Framework
- 1.5 Currency, Units & Pricing Basis
- 1.6 Target Stakeholders
- 1.7 Limitations & Assumptions
Chapter 2. Executive Summary
- 2.1 Global Interconnects and Passive Components Market Snapshot
- 2.1.1 Market Size – Historical (2024) & Forecast (2024-2032) (2024: USD 180,157 million → 2032: USD 302,667.9 million)
- 2.1.2 Volume & Revenue – Global Totals
- 2.1.3 Key Market Highlights – Top Five Facts
- 2.2 Interconnects and Passive Components Market Segmentation Snapshot
- 2.2.1 Market Split by Region – 2024 vs. 2032
- 2.3 Competitive Snapshot
- 2.3.1 Top 10 Players by Revenue Share – 2024
- 2.3.2 Top 10 Players by Volume Share – 2024
- 2.3.3 Recent Strategic Developments (18-Month Summary)
- 2.4 Key Investment Highlights & Strategic Conclusions
Chapter 3. Interconnects and Passive Components Market Dynamics & Industry Analysis
- 3.1 Market Overview & Context
- 3.1.1 Interconnects and Passive Components Market Position in the Broader Automotive Value Chain
- 3.1.2 OEM vs. Replacement Market Dynamics
- 3.1.3 Market Maturity & Development Stage by Region
- 3.2 Interconnects and Passive Components Market Drivers
- 3.3 Interconnects and Passive Components Market Restraints & Challenges
- 3.4 Interconnects and Passive Components Market Opportunities
- 3.5 Porter's Five Forces Analysis
- 3.5.1 Threat of New Entrants
- 3.5.2 Bargaining Power of Suppliers
- 3.5.3 Bargaining Power of Buyers
- 3.5.4 Threat of Substitutes
- 3.5.5 Competitive Rivalry – Intensity Assessment
- 3.6 Interconnects and Passive Components Value Chain Analysis
- 3.6.1 Upstream – Raw Material/Input Suppliers
- 3.6.1.1 Raw Material/Input 1
- 3.6.1.2 Raw Material/Input 2
- 3.6.1.3 Raw Material/Input 3
- 3.6.2 Midstream – Production/Manufacturing/Service Delivery
- 3.6.2.1 Production/Process Overview
- 3.6.2.2 Key Facility Locations & Capacity by Manufacturer
- 3.6.3 Downstream – Distribution & End Consumer
- 3.6.3.1 Primary Channel – B2B/OEM
- 3.6.3.2 Secondary Channels – Dealer, Retail, Online, Direct
- 3.6.4 Value Chain Profitability Analysis
- 3.6.1 Upstream – Raw Material/Input Suppliers
- 3.7 PESTEL Analysis
- 3.7.1 Political Factors
- 3.7.2 Economic Factors
- 3.7.3 Social Factors
- 3.7.4 Technological Factors
- 3.7.5 Environmental Factors
- 3.7.6 Legal Factors
- 3.8 Interconnects and Passive Components Supply Chain Analysis
- 3.8.1 Raw Material/Input Supply Risk Assessment
- 3.8.2 Manufacturing Concentration Risk (Geographic Exposure)
- 3.8.3 Trade Disruption Impact Analysis
- 3.9 Regulatory & Policy Landscape
Note: The regulatory and policy landscape section covers regulations based on their applicability to the market, Interconnects and Passive Components category, geography, and scope of the study. Only regulatory frameworks with a material impact on operations, compliance, trade, sustainability, or market access are analyzed in detail.
Chapter 4. Key Investment Pockets & Opportunity Analysis
- 4.1 Interconnects and Passive Components Market Attractiveness Analysis
- 4.1.1 By Region – Investment Attractiveness Matrix (Volume × CAGR)
- 4.2 Absolute Revenue Growth Opportunity
- 4.2.1 By Region – Absolute USD Growth Through 2032
- 4.3 Incremental Volume Opportunity
- 4.3.1 By Region – Incremental Volume Through 2032
- 4.3.2 Segment – Incremental Volume
- 4.4 Emerging Submarket Opportunity Deep Dive (Subject to Applicability)
- 4.5 Emerging Market Opportunity Scorecards
- 4.5.1 United States
- 4.5.2 Europe
- 4.5.3 Asia
- 4.5.4 Middle East & Africa
Note: Emerging Market Opportunity Scorecards will be included based on relevance and strategic importance. Regions listed are indicative and may vary depending on data availability and market dynamics.
Chapter 5. Interconnects and Passive Components Import-Export Analysis & Trade Flows
- 5.1 Global Trade Overview
- 5.1.1 Global Export Value by Country (2024)
- 5.1.2 Global Export Volume by Country (2024)
- 5.1.3 Global Import Value by Country (2024)
- 5.1.4 Global Import Volume by Country (2024)
- 5.1.5 Net Trade Balance by Country (2024)
- 5.2 Export Analysis – Segment
- 5.2.1 Type 1 (HS Code)
- 5.2.2 Type 2 (HS Code)
- 5.2.3 Type 3 (HS Code)
- 5.2.4 Type 4 (HS Code)
- 5.2.5 Type 5 (HS Code)
- 5.3 Import Analysis – Segment
- 5.3.1 Type 1 (HS Code)
- 5.3.2 Type 2 (HS Code)
- 5.3.3 Type 3 (HS Code)
- 5.3.4 Type 4 (HS Code)
- 5.3.5 Type 5 (HS Code)
- 5.4 Average Unit Trade Prices
- 5.4.1 Average Export Price – Segment & Country
- 5.4.2 Average Import Price – Segment & Source Country
- 5.4.3 Price Trends (2024)
- 5.5 Key Trade Route Analysis
- 5.5.1 Trade Route 1
- 5.5.2 Trade Route 2
- 5.5.3 Trade Route 3
- 5.5.4 Trade Route 4
- 5.5.5 Trade Route 5
- 5.6 Trade Policy Impact Assessment
- 5.6.1 US Anti-Dumping & Section 301 Tariffs
- 5.6.2 EU Customs Union Impact
- 5.6.3 Major Free Trade Agreements
- 5.6.4 USMCA Rules of Origin
Note: Trade policy analysis will be included only where relevant to the Interconnects and Passive Components market.
Chapter 6. Competitive Landscape & Company Benchmarking
- 6.1 Interconnects and Passive Components Market Concentration & Structure
- 6.1.1 Herfindahl-Hirschman Index (HHI) – vs. 2024
- 6.1.2 Tier 1, Tier 2 & Tier 3 Market Structure
- 6.1.3 Global, Regional & Local Player Dynamics
- 6.2 Interconnects and Passive Components Market Share Analysis – 2024
- 6.2.1 Global Revenue Share by Company
- 6.2.2 Global Volume Share by Company
- 6.2.3 Regional Revenue Share
- 6.2.4 Market Share Evolution ( vs. 2024)
- 6.2.5 OEM Segment Share by Company
- 6.2.6 Replacement Segment Share by Company
- 6.3 Production/Delivery Capacity & Facility Analysis
- 6.3.1 Global Installed Capacity
- 6.3.2 Capacity Utilization Rates
- 6.3.3 Production/Output Volume
- 6.3.4 Facility Locations & Capacity Map
- 6.3.5 Planned Capacity Additions
- 6.4 Interconnects and Passive Components Competitive Benchmarking Matrix
- 6.4.1 Revenue, Volume, CAGR & Profitability Comparison
- 6.4.2 Channel Revenue Mix
- 6.4.3 Geographic Revenue Exposure
- 6.4.4 R&D Intensity
- 6.4.5 Sustainability Maturity
- 6.5 Strategic Developments in Interconnects and Passive Components (Last 24 Months)
- 6.5.1 Mergers, Acquisitions & Divestments
- 6.5.2 New Interconnects and Passive Components Launches
- 6.5.3 Facility Expansions
- 6.5.4 Strategic Alliances, Joint Ventures & Partnerships
- 6.5.5 Distribution Expansion & Market Entry
- 6.5.6 Sustainability & ESG Initiatives
- 6.6 Competitive Strategy Mapping
- 6.6.1 Leader, Challenger, Follower & Niche Classification
- 6.6.2 Pricing Strategy Comparison
- 6.6.3 Channel Strategy Matrix
Note: Strategic developments are included based on their materiality and the availability of reliable information.
Chapter 7. Global Interconnects and Passive Components Market – By Distribution Channel
- 7.1 Segment Overview
- 7.1.1 Volume & Revenue Split by Channel (2024 & 2032)
- 7.1.2 Channel Mix Evolution (2024-2032)
Chapter 8. Regional Market Analysis – Global Overview
- 8.1 Global Regional Overview
- 8.1.1 Regional Volume Share
- 8.1.2 Regional Revenue Share
- 8.1.3 Regional Volume by Region
- 8.1.4 Regional Revenue by Region
- 8.1.5 Regional Forecast Through 2032
- 8.2 Cross-Regional Segment Analysis
- 8.2.1 By Distribution Channel
- 8.2.2 By Brand/Price Tier
Chapter 9. North America Interconnects and Passive Components Market
- 9.1 United States
- 9.2 Canada
- 9.3 Mexico
Chapter 10. Europe Interconnects and Passive Components Market
- 10.1 Germany
- 10.2 France
- 10.3 Italy
- 10.4 United Kingdom
- 10.5 Spain
- 10.6 Poland
- 10.7 Russia
- 10.8 Netherlands
- 10.9 Belgium
- 10.10 Sweden
- 10.11 Denmark
- 10.12 Norway
- 10.13 Rest of Europe
Chapter 11. Asia Pacific Interconnects and Passive Components Market
- 11.1 China
- 11.2 India
- 11.3 Japan
- 11.4 South Korea
- 11.5 Thailand
- 11.6 Indonesia
- 11.7 Vietnam
- 11.8 Malaysia
- 11.9 Australia
- 11.10 Rest of Asia Pacific
Chapter 12. Latin America Interconnects and Passive Components Market
- 12.1 Brazil
- 12.2 Argentina
- 12.3 Colombia
- 12.4 Chile
- 12.5 Rest of Latin America
Chapter 13. Middle East Interconnects and Passive Components Market
- 13.1 Saudi Arabia
- 13.2 United Arab Emirates
- 13.3 Turkey
- 13.4 Israel
- 13.5 Iran
- 13.6 Rest of the Middle East
Chapter 14. Africa Interconnects and Passive Components Market
- 14.1 South Africa
- 14.2 Egypt
- 14.3 Nigeria
- 14.4 Morocco
- 14.5 Rest of Africa
Chapter 15. Interconnects and Passive Components Company Profiles
- 15.1 [Company 01]
- 15.1.1 Company Overview
- 15.1.2 Key Management Personnel
- 15.1.3 Products & Services Portfolio
- 15.1.4 Financial Performance
- 15.1.5 Key Market Focus & Geographic Presence
- 15.1.6 Recent Developments & Strategic Initiatives
Note: The company profile list is preliminary and may change based on research findings, market developments, data availability, and client requirements.
Chapter 16. Appendices
- Appendix A – List of Abbreviations & Acronyms
- Appendix B – Industry Classification Code Reference – Full Series
- Appendix C – Production & Capacity Data Tables
- Appendix D – End-Use & Demand Base Tables
- Appendix E – Consumption & Replacement Rate Assumptions
- Appendix F – ASP Reference Tables
- Appendix G – Manufacturing & Facility Database
- Appendix H – Import-Export Data Tables
- Appendix I – Regulatory Summary Tables
- Appendix J – Primary Research Participant List (Anonymized)
- Appendix K – Primary Research Questionnaire Framework
- Appendix L – Data Sources & Bibliography
- Appendix M – Market Size Divergence & Source Comparison
Chapter 17. Research Methodology
- 17.1 Research Framework & Philosophy
- 17.2 Secondary Research – Sources, Hierarchy & Data Extraction
- 17.3 Data Modeling – Bottom-Up & Top-Down Market Sizing
- 17.4 Primary Research – Stakeholder Framework, LOI & Sample Sizes
- 17.5 Forecast Methodology – Regression, Scenario & Sensitivity Analysis
- 17.6 Quality Control – Four-Layer Validation Framework
- 17.7 Limitations & Standard Assumptions
- 17.8 Disclaimer
