
Market Overview:
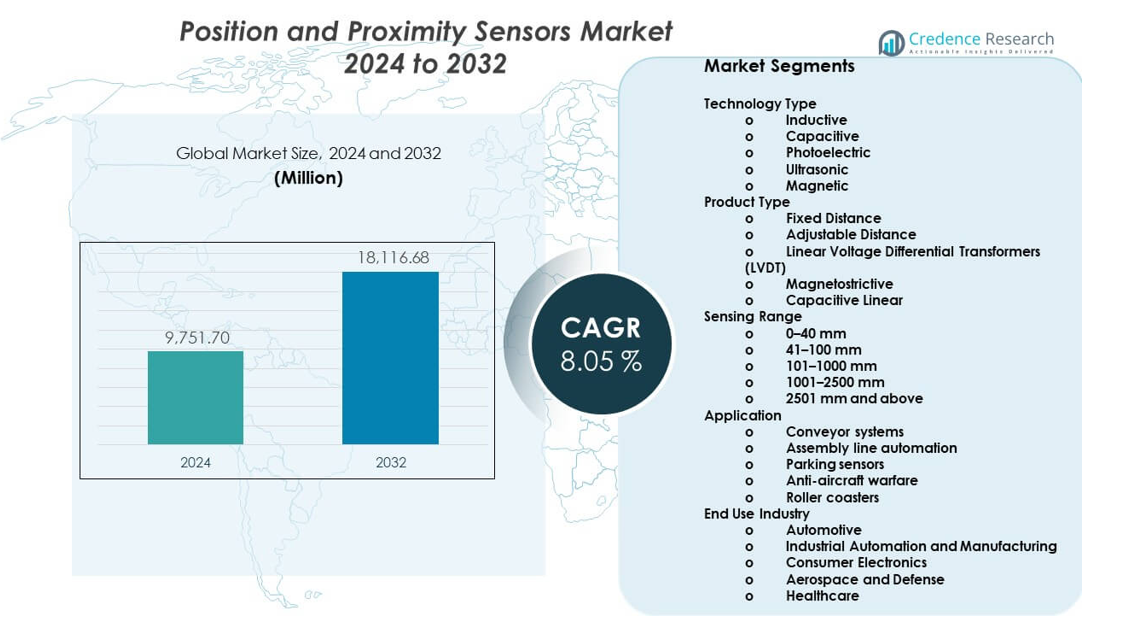
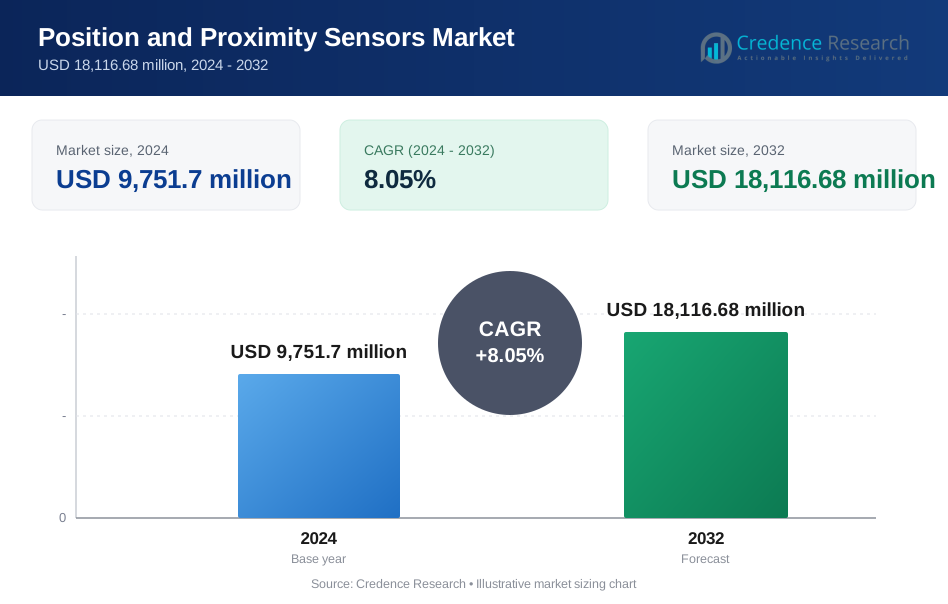
The Position and Proximity Sensors Market is projected to grow from USD 9,751.7 million in 2024 to an estimated USD 18,116.68 million by 2032, with a compound annual growth rate (CAGR) of 8.05% from 2024 to 2032.
| REPORT ATTRIBUTE | DETAILS |
|---|---|
| Historical Period | 2020-2023 |
| Base Year | 2024 |
| Forecast Period | 2025-2032 |
| Position and Proximity Sensors Market Size 2024 | USD 9,751.7 million |
| Position and Proximity Sensors Market, CAGR | 8.05% |
| Position and Proximity Sensors Market Size 2032 | USD 18,116.68 million |
Growth in the Position and Proximity Sensors Market is driven by automation across manufacturing and process industries. Robotics and factory control systems rely on precise position feedback for efficiency and safety. Automotive demand rises due to advanced driver assistance systems and electric vehicle platforms. Consumer electronics adopt compact sensors for touchless control and device alignment. Healthcare equipment also uses proximity sensing for monitoring and safety functions. Ongoing advances in sensor miniaturization, accuracy, and durability further improve adoption rates across diverse applications.
Asia Pacific leads the Position and Proximity Sensors Market due to strong electronics production and industrial automation. China, Japan, and South Korea drive demand through automotive and semiconductor manufacturing. North America follows with high adoption in industrial robotics and advanced automotive systems. Europe remains strong due to smart factory upgrades and safety regulations. Emerging markets in Southeast Asia and Latin America show growth as automation investments increase. These regions benefit from expanding manufacturing bases and rising use of smart industrial equipment.
Market Insights:
- The market reached USD 9,751.7 million in 2024 and is projected to hit USD 18,116.68 million by 2032, driven by an 8.05% CAGR, supported by automation and electronics demand.
- Asia Pacific leads with 42% share, followed by North America at 27% and Europe at 22%, due to strong manufacturing bases, automotive production, and advanced automation adoption.
- Asia Pacific is also the fastest growing region with 42% share, supported by expanding electronics output, smart factory programs, and cost efficient production ecosystems.
- By technology type, inductive sensors account for about 38% share, while photoelectric sensors hold nearly 24%, reflecting durability needs and high speed detection demand.
- By end use, industrial automation and manufacturing represent around 41% share, while automotive contributes about 29%, driven by robotics deployment and vehicle electronics growth.
Market Drivers:
Rising Adoption Of Industrial Automation Across Manufacturing Facilities
Industrial automation increases demand for reliable sensing technologies across factories. Manufacturers deploy sensors to improve machine accuracy and operational control. The Position and Proximity Sensors Market benefits from higher automation spending in discrete industries. Robotics systems depend on precise position feedback to ensure repeatable motion. Proximity sensors help reduce equipment damage and downtime. Safety systems rely on accurate detection of objects and workers. Digital manufacturing platforms require continuous sensor data. Automation strategies expand across automotive, electronics, and heavy machinery sectors.
- For instance, KEYENCE reports its inductive proximity sensors achieve repeatability of ±0.01 mm and response times below 1 ms, enabling high speed robotic positioning in automated assembly lines.
Growing Integration Of Sensors In Automotive And Electric Vehicle Platforms
Automotive manufacturers adopt sensors to support advanced vehicle functions. Electric vehicles require precise position sensing for motors and battery systems. The Position and Proximity Sensors Market gains momentum from vehicle electrification trends. Driver assistance features rely on accurate object and distance detection. Sensors improve steering, braking, and transmission control. Vehicle platforms integrate more electronic control units. Automakers focus on system reliability and fast response. Higher sensor content per vehicle supports steady demand growth.
- For instance, Infineon Technologies states its XENSIV magnetic position sensors achieve angular accuracy better than 0.5°, supporting motor position control in electric power steering and traction inverters.
Expanding Use Of Smart Consumer Electronics And Connected Devices
Consumer electronics integrate sensors to enhance user interaction and safety. Smartphones use proximity sensors to manage displays and power use. The Position and Proximity Sensors Market benefits from rising device shipments. Wearables depend on motion and position sensing for tracking features. Smart home products use sensors for touch free operation. Manufacturers prioritize compact size and low power use. Design teams demand high accuracy in small form factors. Product refresh cycles sustain long term sensor adoption.
Increasing Demand From Medical And Healthcare Equipment Manufacturers
Healthcare devices require accurate sensing for safe and controlled operation. Position feedback supports imaging and diagnostic equipment performance. The Position and Proximity Sensors Market gains support from healthcare modernization. Hospitals adopt advanced surgical and monitoring systems. Sensors control movement in robotic surgery tools. Proximity detection improves patient and operator safety. Device makers focus on reliability and compliance standards. Healthcare investment drives stable demand for precision sensors.
Market Trends:
Shift Toward Miniaturized And High Precision Sensor Architectures
Sensor manufacturers focus on smaller designs for space limited applications. Compact sensors enable integration into modern electronics and machinery. The Position and Proximity Sensors Market follows trends toward higher precision. Improved accuracy supports advanced automation tasks. Miniaturization helps reduce system weight and energy use. Engineers prefer sensors with stable output and low noise. Packaging innovations support harsh operating conditions. Precision focused development defines product roadmaps.
- For instance, STMicroelectronics reports its MEMS based position sensors operate with noise density below 100 µg/√Hz, enabling precise motion detection in compact industrial and consumer devices.
Rising Adoption Of Contactless And Non Mechanical Sensing Technologies
Industries prefer contactless sensors to reduce wear and maintenance. Optical and magnetic sensors replace mechanical switches. The Position and Proximity Sensors Market reflects this technology shift. Contactless designs improve durability and lifespan. Harsh environments benefit from sealed sensor structures. Manufacturers seek consistent performance under vibration and dust. Non-contact sensing improves system reliability. This trend supports wider industrial acceptance.
- For instance, Honeywell notes its magnetic proximity sensors exceed 100 million operation cycles without mechanical wear, supporting long service life in heavy duty industrial equipment.
Growing Focus On Energy Efficient And Low Power Sensor Solutions
Energy efficiency becomes a priority across electronics and automation. Low power sensors extend device battery life. The Position and Proximity Sensors Market aligns with power optimization needs. Portable devices depend on efficient sensing components. Industrial systems reduce energy use through optimized sensors. Designers select components with minimal power draw. Efficiency standards influence product selection. Power conscious designs shape future sensor development.
Integration Of Sensors With Digital Control And Data Systems
Sensors increasingly connect with digital control platforms. Data integration supports predictive maintenance strategies. The Position and Proximity Sensors Market aligns with smart system adoption. Factories use sensor data for performance analysis. Vehicles rely on digital feedback loops. Connectivity improves system diagnostics and control. Software driven platforms require reliable input signals. Sensor digitalization supports intelligent operations.
Market Challenges Analysis:
Performance Reliability Under Harsh And Variable Operating Conditions
Sensors face challenges in extreme temperatures and vibration. Industrial sites expose devices to dust and moisture. The Position and Proximity Sensors Market must address reliability concerns. Signal accuracy may degrade under harsh conditions. Equipment failure increases maintenance costs. Manufacturers invest in robust housing designs. Testing standards raise development complexity. Reliability demands influence product qualification cycles.
Cost Pressure And Complex Integration Requirements Across Applications
Price sensitivity affects sensor adoption in cost driven industries. System integration requires technical expertise and calibration. The Position and Proximity Sensors Market faces margin pressure. Compatibility issues arise across control platforms. Customization increases development time. Buyers demand high performance at lower cost. Supply chain fluctuations affect component pricing. These factors challenge consistent market expansion.
Market Opportunities:
Expanding Automation Investment In Emerging Manufacturing Economies
Emerging economies increase investment in automated production. New factories adopt modern sensing technologies. The Position and Proximity Sensors Market finds growth opportunities in these regions. Manufacturers upgrade legacy equipment with smart sensors. Labor cost pressure accelerates automation adoption. Governments support industrial modernization programs. Local production capacity expands demand. Emerging markets offer long term volume potential.
Rising Deployment Of Sensors In Smart Infrastructure And Logistics
Smart infrastructure projects require precise sensing systems. Warehouses use sensors for automated handling equipment. The Position and Proximity Sensors Market benefits from logistics modernization. Sensors improve inventory tracking and safety. Ports and transport hubs adopt automated solutions. Real time detection supports operational efficiency. Infrastructure digitization creates new use cases. These projects open fresh revenue opportunities.
Market Segmentation Analysis:
Technology Type
Inductive sensors dominate industrial use due to durability and stable performance in harsh environments. Capacitive sensors support detection of nonmetallic materials and liquids. Photoelectric sensors serve high speed and longer distance detection needs in automation systems. Ultrasonic sensors perform well in dusty and humid conditions. Magnetic sensors enable contactless position measurement with high reliability. The Position and Proximity Sensors Market reflects wide adoption across these technologies. Each type supports specific accuracy and environmental requirements. Technology choice depends on application conditions and material properties.
- For instance, SICK AG specifies its photoelectric sensors detect objects at distances exceeding 10 m with switching frequencies above 1 kHz for high speed conveyor systems.
Product Type
Fixed distance sensors suit standardized and repetitive industrial operations. Adjustable distance sensors provide flexibility across varying machine layouts. Linear Voltage Differential Transformers support high precision linear measurement. Magnetostrictive sensors serve heavy duty and long stroke applications. Capacitive linear sensors fit compact and space constrained designs. Product selection depends on accuracy, range, and stability needs. Industrial users prefer consistent output and low drift. Diverse product offerings support broad system integration.
- For instance, TE Connectivity states its LVDT position sensors achieve linearity better than ±0.25% of full scale, supporting precision control in industrial actuators and aerospace systems.
Sensing Range
Short range sensors up to 40 mm support compact equipment and electronics. Mid-range options from 41 to 100 mm suit robotics and assembly systems. Ranges between 101 and 1000 mm serve material handling and automation lines. Extended ranges support infrastructure, transportation, and defense uses. Very long range sensors address specialized industrial needs. Accuracy remains critical across all distances. System layout influences range demand. Manufacturers maintain wide range portfolios.
Application
Conveyor systems rely on sensors for flow monitoring and control. Assembly line automation uses sensors for precise positioning and sequencing. Parking sensors support object detection and safety functions. Defense systems require highly reliable and accurate sensing. Roller coasters depend on sensors for motion control and rider safety. Each application demands specific response time and durability levels. Environmental exposure varies widely. Application needs guide sensor selection.
End Use Industry
Automotive demand rises through safety and control systems. Industrial automation and manufacturing rely on sensors for efficiency and quality control. Consumer electronics adopt sensors for compact and touch free functions. Aerospace and defense require rugged and precise sensing solutions. Healthcare depends on accurate motion and proximity control. Each industry values reliability and compliance. Operating standards influence product choice. End use diversity supports stable demand growth.
Segmentation:
By Technology Type
- Inductive
- Capacitive
- Photoelectric
- Ultrasonic
- Magnetic
By Product Type
- Fixed Distance
- Adjustable Distance
- Linear Voltage Differential Transformers (LVDT)
- Magnetostrictive
- Capacitive Linear
By Sensing Range
- 0–40 mm
- 41–100 mm
- 101–1000 mm
- 1001–2500 mm
- 2501 mm and above
By Application
- Conveyor systems
- Assembly line automation
- Parking sensors
- Anti-aircraft warfare
- Roller coasters
By End Use Industry
- Automotive
- Industrial Automation and Manufacturing
- Consumer Electronics
- Aerospace and Defense
- Healthcare
- North America
- U.S.
- Canada
- Mexico
- Europe
- Germany
- France
- U.K.
- Italy
- Spain
- Rest of Europe
- Asia Pacific
- China
- Japan
- India
- South Korea
- South-east Asia
- Rest of Asia Pacific
- Latin America
- Brazil
- Argentina
- Rest of Latin America
- Middle East & Africa
- GCC Countries
- South Africa
- Rest of the Middle East and Africa
Regional Analysis:
Asia Pacific
Asia Pacific holds the largest share of the global market at around 42%. China, Japan, South Korea, and India drive demand through large scale manufacturing activity. Electronics production and automotive assembly support high sensor consumption. Industrial automation programs expand across factories and logistics hubs. The Position and Proximity Sensors Market benefits from strong local supplier ecosystems. Government support for smart manufacturing improves adoption rates. Cost efficient production also strengthens the region’s competitive position.
North America
North America accounts for nearly 27% of the market share. The United States leads due to advanced industrial automation and automotive technology use. Robotics, aerospace, and defense sectors rely on precise sensing systems. Electric vehicle development supports higher sensor integration. It benefits from strong research and development capabilities. Manufacturing focuses on quality, safety, and reliability standards. Canada and Mexico add demand through automotive and industrial supply chains.
Europe, Middle East & Africa, and Latin America
Europe represents about 22% of the market, led by Germany, the UK, France, and Italy. Smart factory upgrades and strict safety norms support sensor demand. Automotive engineering and industrial machinery remain core drivers. Middle East and Africa contribute close to 5% share through gradual industrial modernization. Latin America holds nearly 4% share, driven by manufacturing growth in Brazil and Mexico. Infrastructure projects support sensor adoption. These regions show steady but moderate growth compared to Asia Pacific.
Key Player Analysis:
- STMicroelectronics
- TE Connectivity
- Vishay Intertechnology
- Infineon Technologies
- Panasonic Corporation
- OMRON Corporation
- KEYENCE Corporation
- SICK AG
- Honeywell International
- Allegro MicroSystems
Competitive Analysis:
The Position and Proximity Sensors Market shows strong competition among global electronics and automation suppliers. Leading players focus on product reliability, accuracy, and portfolio depth. Companies invest in sensor miniaturization and rugged designs to meet industrial needs. Automotive and factory automation remain key revenue contributors. Strategic partnerships strengthen access to OEM customers. It benefits from strong distribution networks and technical support. Product differentiation relies on sensing precision and response speed. Brand reputation influences long term contracts. Competitive pressure drives continuous product upgrades and cost optimization.
Recent Developments:
- In December 2025, KEYENCE Corporation released the ER Series, a new inductive proximity sensor that sets a higher industry standard with its extended detection range and durable design, featuring 360° status indicators for improved visibility. Previously, in July 2024, the company launched the LJ-S Series, an automated 3D laser snapshot sensor capable of high-precision profile measurement and inspection of complex parts without requiring target stoppage.
- In October 2025, Infineon Technologies launched the XENSIV™ BGT60CUTR13AIP, a next-generation highly integrated 60 GHz CMOS radar sensor designed for ultra-low power presence detection in IoT devices. Earlier, in July 2025, Infineon introduced a new XENSIV™ magnetic 3D position sensor, leveraging its extensive experience in magnetic technologies to provide high-precision positioning solutions for automotive and industrial control applications.
- In July 2025, STMicroelectronics entered into a definitive agreement to acquire NXP Semiconductors' MEMS sensors business for approximately $950 million. This strategic acquisition is designed to strengthen ST’s leadership in the sensor market by integrating NXP's automotive safety and industrial sensor portfolio, including advanced MEMS technologies. Additionally, in July 2024, the company launched the VL53L4ED, a new high-accuracy Time-of-Flight (ToF) sensor specifically engineered for industrial proximity sensing and presence detection in harsh environments, featuring an extended operating temperature range of -40°C to 105°C.
Report Coverage:
The research report offers an in-depth analysis based on technology type, product type, sensing range, application, end use industry, and regional scope. It details leading market players, providing an overview of their business, product offerings, investments, revenue streams, and key applications. Additionally, the report includes insights into the competitive environment, SWOT analysis, current market trends, as well as the primary drivers and constraints. Furthermore, it discusses various factors that have driven market expansion in recent years. The report also explores market dynamics, regulatory scenarios, and technological advancements that are shaping the industry. It assesses the impact of external factors and global economic changes on market growth. Lastly, it provides strategic recommendations for new entrants and established companies to navigate the complexities of the market.
Future Outlook:
- Automation adoption continues across manufacturing and logistics
- Automotive electrification increases sensor integration
- Miniaturized sensors gain preference in compact devices
- Contactless sensing replaces mechanical components
- Smart factories rely on real time sensor feedback
- Healthcare equipment adopts precision motion control
- Defense systems demand rugged and reliable sensors
- Energy efficient sensor designs gain traction
- Emerging markets expand industrial sensor demand
- Product innovation remains a key growth strategy
Request a Free Sample
Fill in your details and we'll send you a free sample report.
- Sample data tables & charts
- Research methodology
Need a Custom Version of This Report?
Tailor the scope, geography, or segments to your exact requirements.
- Custom geography or segment scope
- Direct access to our analyst team
Frequently Asked Questions
What is the current market size for Position and Proximity Sensors Market, and what is its projected size in 2032?
At what Compound Annual Growth Rate is the Position and Proximity Sensors Market projected to grow between 2025 and 2032?
Which Position and Proximity Sensors Market segment held the largest share in 2024?
What are the primary factors fueling the growth of the Position and Proximity Sensors Market?
Who are the leading companies in the Position and Proximity Sensors Market?
Table of Content
Chapter 1. Report Introduction
- 1.1 Report Description & Purpose
- 1.1.1 Report Title & Market Definition
- 1.1.2 Unique Selling Propositions (USP) & Key Differentiators
- 1.1.3 Value Proposition for Stakeholders
- 1.2 Research Objectives
- 1.2.1 Market Sizing Objectives (Volume & Revenue)
- 1.2.2 Segmentation Objectives
- 1.2.3 Competitive Intelligence Objectives
- 1.2.4 Forecast & Scenario Objectives
- 1.3 Report Scope
- 1.3.1 Position and Proximity Sensors Scope – Types & Subtypes Covered
- 1.3.2 Geographic Scope – Regions & Countries Covered
- 1.3.3 Historical Period, Base Year & Forecast Period (2024; forecast to 2032)
- 1.3.4 Inclusions & Exclusions
- 1.4 HS Code & Classification Framework
- 1.5 Currency, Units & Pricing Basis
- 1.6 Target Stakeholders
- 1.7 Limitations & Assumptions
Chapter 2. Executive Summary
- 2.1 Global Position and Proximity Sensors Market Snapshot
- 2.1.1 Market Size – Historical (2024) & Forecast (2024-2032) (2024: USD 9,751.7 million → 2032: USD 18,116.68 million)
- 2.1.2 Volume & Revenue – Global Totals
- 2.1.3 Key Market Highlights – Top Five Facts
- 2.2 Position and Proximity Sensors Market Segmentation Snapshot
- 2.2.1 Market Split by Region – 2024 vs. 2032
- 2.3 Competitive Snapshot
- 2.3.1 Top 10 Players by Revenue Share – 2024
- 2.3.2 Top 10 Players by Volume Share – 2024
- 2.3.3 Recent Strategic Developments (18-Month Summary)
- 2.4 Key Investment Highlights & Strategic Conclusions
Chapter 3. Position and Proximity Sensors Market Dynamics & Industry Analysis
- 3.1 Market Overview & Context
- 3.1.1 Position and Proximity Sensors Market Position in the Broader Automotive Value Chain
- 3.1.2 OEM vs. Replacement Market Dynamics
- 3.1.3 Market Maturity & Development Stage by Region
- 3.2 Position and Proximity Sensors Market Drivers
- 3.3 Position and Proximity Sensors Market Restraints & Challenges
- 3.4 Position and Proximity Sensors Market Opportunities
- 3.5 Porter's Five Forces Analysis
- 3.5.1 Threat of New Entrants
- 3.5.2 Bargaining Power of Suppliers
- 3.5.3 Bargaining Power of Buyers
- 3.5.4 Threat of Substitutes
- 3.5.5 Competitive Rivalry – Intensity Assessment
- 3.6 Position and Proximity Sensors Value Chain Analysis
- 3.6.1 Upstream – Raw Material/Input Suppliers
- 3.6.1.1 Raw Material/Input 1
- 3.6.1.2 Raw Material/Input 2
- 3.6.1.3 Raw Material/Input 3
- 3.6.2 Midstream – Production/Manufacturing/Service Delivery
- 3.6.2.1 Production/Process Overview
- 3.6.2.2 Key Facility Locations & Capacity by Manufacturer
- 3.6.3 Downstream – Distribution & End Consumer
- 3.6.3.1 Primary Channel – B2B/OEM
- 3.6.3.2 Secondary Channels – Dealer, Retail, Online, Direct
- 3.6.4 Value Chain Profitability Analysis
- 3.6.1 Upstream – Raw Material/Input Suppliers
- 3.7 PESTEL Analysis
- 3.7.1 Political Factors
- 3.7.2 Economic Factors
- 3.7.3 Social Factors
- 3.7.4 Technological Factors
- 3.7.5 Environmental Factors
- 3.7.6 Legal Factors
- 3.8 Position and Proximity Sensors Supply Chain Analysis
- 3.8.1 Raw Material/Input Supply Risk Assessment
- 3.8.2 Manufacturing Concentration Risk (Geographic Exposure)
- 3.8.3 Trade Disruption Impact Analysis
- 3.9 Regulatory & Policy Landscape
Note: The regulatory and policy landscape section covers regulations based on their applicability to the market, Position and Proximity Sensors category, geography, and scope of the study. Only regulatory frameworks with a material impact on operations, compliance, trade, sustainability, or market access are analyzed in detail.
Chapter 4. Key Investment Pockets & Opportunity Analysis
- 4.1 Position and Proximity Sensors Market Attractiveness Analysis
- 4.1.1 By Region – Investment Attractiveness Matrix (Volume × CAGR)
- 4.2 Absolute Revenue Growth Opportunity
- 4.2.1 By Region – Absolute USD Growth Through 2032
- 4.3 Incremental Volume Opportunity
- 4.3.1 By Region – Incremental Volume Through 2032
- 4.3.2 Segment – Incremental Volume
- 4.4 Emerging Submarket Opportunity Deep Dive (Subject to Applicability)
- 4.5 Emerging Market Opportunity Scorecards
- 4.5.1 United States
- 4.5.2 Europe
- 4.5.3 Asia
- 4.5.4 Middle East & Africa
Note: Emerging Market Opportunity Scorecards will be included based on relevance and strategic importance. Regions listed are indicative and may vary depending on data availability and market dynamics.
Chapter 5. Position and Proximity Sensors Import-Export Analysis & Trade Flows
- 5.1 Global Trade Overview
- 5.1.1 Global Export Value by Country (2024)
- 5.1.2 Global Export Volume by Country (2024)
- 5.1.3 Global Import Value by Country (2024)
- 5.1.4 Global Import Volume by Country (2024)
- 5.1.5 Net Trade Balance by Country (2024)
- 5.2 Export Analysis – Segment
- 5.2.1 Type 1 (HS Code)
- 5.2.2 Type 2 (HS Code)
- 5.2.3 Type 3 (HS Code)
- 5.2.4 Type 4 (HS Code)
- 5.2.5 Type 5 (HS Code)
- 5.3 Import Analysis – Segment
- 5.3.1 Type 1 (HS Code)
- 5.3.2 Type 2 (HS Code)
- 5.3.3 Type 3 (HS Code)
- 5.3.4 Type 4 (HS Code)
- 5.3.5 Type 5 (HS Code)
- 5.4 Average Unit Trade Prices
- 5.4.1 Average Export Price – Segment & Country
- 5.4.2 Average Import Price – Segment & Source Country
- 5.4.3 Price Trends (2024)
- 5.5 Key Trade Route Analysis
- 5.5.1 Trade Route 1
- 5.5.2 Trade Route 2
- 5.5.3 Trade Route 3
- 5.5.4 Trade Route 4
- 5.5.5 Trade Route 5
- 5.6 Trade Policy Impact Assessment
- 5.6.1 US Anti-Dumping & Section 301 Tariffs
- 5.6.2 EU Customs Union Impact
- 5.6.3 Major Free Trade Agreements
- 5.6.4 USMCA Rules of Origin
Note: Trade policy analysis will be included only where relevant to the Position and Proximity Sensors market.
Chapter 6. Competitive Landscape & Company Benchmarking
- 6.1 Position and Proximity Sensors Market Concentration & Structure
- 6.1.1 Herfindahl-Hirschman Index (HHI) – vs. 2024
- 6.1.2 Tier 1, Tier 2 & Tier 3 Market Structure
- 6.1.3 Global, Regional & Local Player Dynamics
- 6.2 Position and Proximity Sensors Market Share Analysis – 2024
- 6.2.1 Global Revenue Share by Company
- 6.2.2 Global Volume Share by Company
- 6.2.3 Regional Revenue Share
- 6.2.4 Market Share Evolution ( vs. 2024)
- 6.2.5 OEM Segment Share by Company
- 6.2.6 Replacement Segment Share by Company
- 6.3 Production/Delivery Capacity & Facility Analysis
- 6.3.1 Global Installed Capacity
- 6.3.2 Capacity Utilization Rates
- 6.3.3 Production/Output Volume
- 6.3.4 Facility Locations & Capacity Map
- 6.3.5 Planned Capacity Additions
- 6.4 Position and Proximity Sensors Competitive Benchmarking Matrix
- 6.4.1 Revenue, Volume, CAGR & Profitability Comparison
- 6.4.2 Channel Revenue Mix
- 6.4.3 Geographic Revenue Exposure
- 6.4.4 R&D Intensity
- 6.4.5 Sustainability Maturity
- 6.5 Strategic Developments in Position and Proximity Sensors (Last 24 Months)
- 6.5.1 Mergers, Acquisitions & Divestments
- 6.5.2 New Position and Proximity Sensors Launches
- 6.5.3 Facility Expansions
- 6.5.4 Strategic Alliances, Joint Ventures & Partnerships
- 6.5.5 Distribution Expansion & Market Entry
- 6.5.6 Sustainability & ESG Initiatives
- 6.6 Competitive Strategy Mapping
- 6.6.1 Leader, Challenger, Follower & Niche Classification
- 6.6.2 Pricing Strategy Comparison
- 6.6.3 Channel Strategy Matrix
Note: Strategic developments are included based on their materiality and the availability of reliable information.
Chapter 7. Global Position and Proximity Sensors Market – By Distribution Channel
- 7.1 Segment Overview
- 7.1.1 Volume & Revenue Split by Channel (2024 & 2032)
- 7.1.2 Channel Mix Evolution (2024-2032)
Chapter 8. Regional Market Analysis – Global Overview
- 8.1 Global Regional Overview
- 8.1.1 Regional Volume Share
- 8.1.2 Regional Revenue Share
- 8.1.3 Regional Volume by Region
- 8.1.4 Regional Revenue by Region
- 8.1.5 Regional Forecast Through 2032
- 8.2 Cross-Regional Segment Analysis
- 8.2.1 By Distribution Channel
- 8.2.2 By Brand/Price Tier
Chapter 9. North America Position and Proximity Sensors Market
- 9.1 United States
- 9.2 Canada
- 9.3 Mexico
Chapter 10. Europe Position and Proximity Sensors Market
- 10.1 Germany
- 10.2 France
- 10.3 Italy
- 10.4 United Kingdom
- 10.5 Spain
- 10.6 Poland
- 10.7 Russia
- 10.8 Netherlands
- 10.9 Belgium
- 10.10 Sweden
- 10.11 Denmark
- 10.12 Norway
- 10.13 Rest of Europe
Chapter 11. Asia Pacific Position and Proximity Sensors Market
- 11.1 China
- 11.2 India
- 11.3 Japan
- 11.4 South Korea
- 11.5 Thailand
- 11.6 Indonesia
- 11.7 Vietnam
- 11.8 Malaysia
- 11.9 Australia
- 11.10 Rest of Asia Pacific
Chapter 12. Latin America Position and Proximity Sensors Market
- 12.1 Brazil
- 12.2 Argentina
- 12.3 Colombia
- 12.4 Chile
- 12.5 Rest of Latin America
Chapter 13. Middle East Position and Proximity Sensors Market
- 13.1 Saudi Arabia
- 13.2 United Arab Emirates
- 13.3 Turkey
- 13.4 Israel
- 13.5 Iran
- 13.6 Rest of the Middle East
Chapter 14. Africa Position and Proximity Sensors Market
- 14.1 South Africa
- 14.2 Egypt
- 14.3 Nigeria
- 14.4 Morocco
- 14.5 Rest of Africa
Chapter 15. Position and Proximity Sensors Company Profiles
- 15.1 [Company 01]
- 15.1.1 Company Overview
- 15.1.2 Key Management Personnel
- 15.1.3 Products & Services Portfolio
- 15.1.4 Financial Performance
- 15.1.5 Key Market Focus & Geographic Presence
- 15.1.6 Recent Developments & Strategic Initiatives
Note: The company profile list is preliminary and may change based on research findings, market developments, data availability, and client requirements.
Chapter 16. Appendices
- Appendix A – List of Abbreviations & Acronyms
- Appendix B – Industry Classification Code Reference – Full Series
- Appendix C – Production & Capacity Data Tables
- Appendix D – End-Use & Demand Base Tables
- Appendix E – Consumption & Replacement Rate Assumptions
- Appendix F – ASP Reference Tables
- Appendix G – Manufacturing & Facility Database
- Appendix H – Import-Export Data Tables
- Appendix I – Regulatory Summary Tables
- Appendix J – Primary Research Participant List (Anonymized)
- Appendix K – Primary Research Questionnaire Framework
- Appendix L – Data Sources & Bibliography
- Appendix M – Market Size Divergence & Source Comparison
Chapter 17. Research Methodology
- 17.1 Research Framework & Philosophy
- 17.2 Secondary Research – Sources, Hierarchy & Data Extraction
- 17.3 Data Modeling – Bottom-Up & Top-Down Market Sizing
- 17.4 Primary Research – Stakeholder Framework, LOI & Sample Sizes
- 17.5 Forecast Methodology – Regression, Scenario & Sensitivity Analysis
- 17.6 Quality Control – Four-Layer Validation Framework
- 17.7 Limitations & Standard Assumptions
- 17.8 Disclaimer
