
AI compute plans and grid access now set the build pace
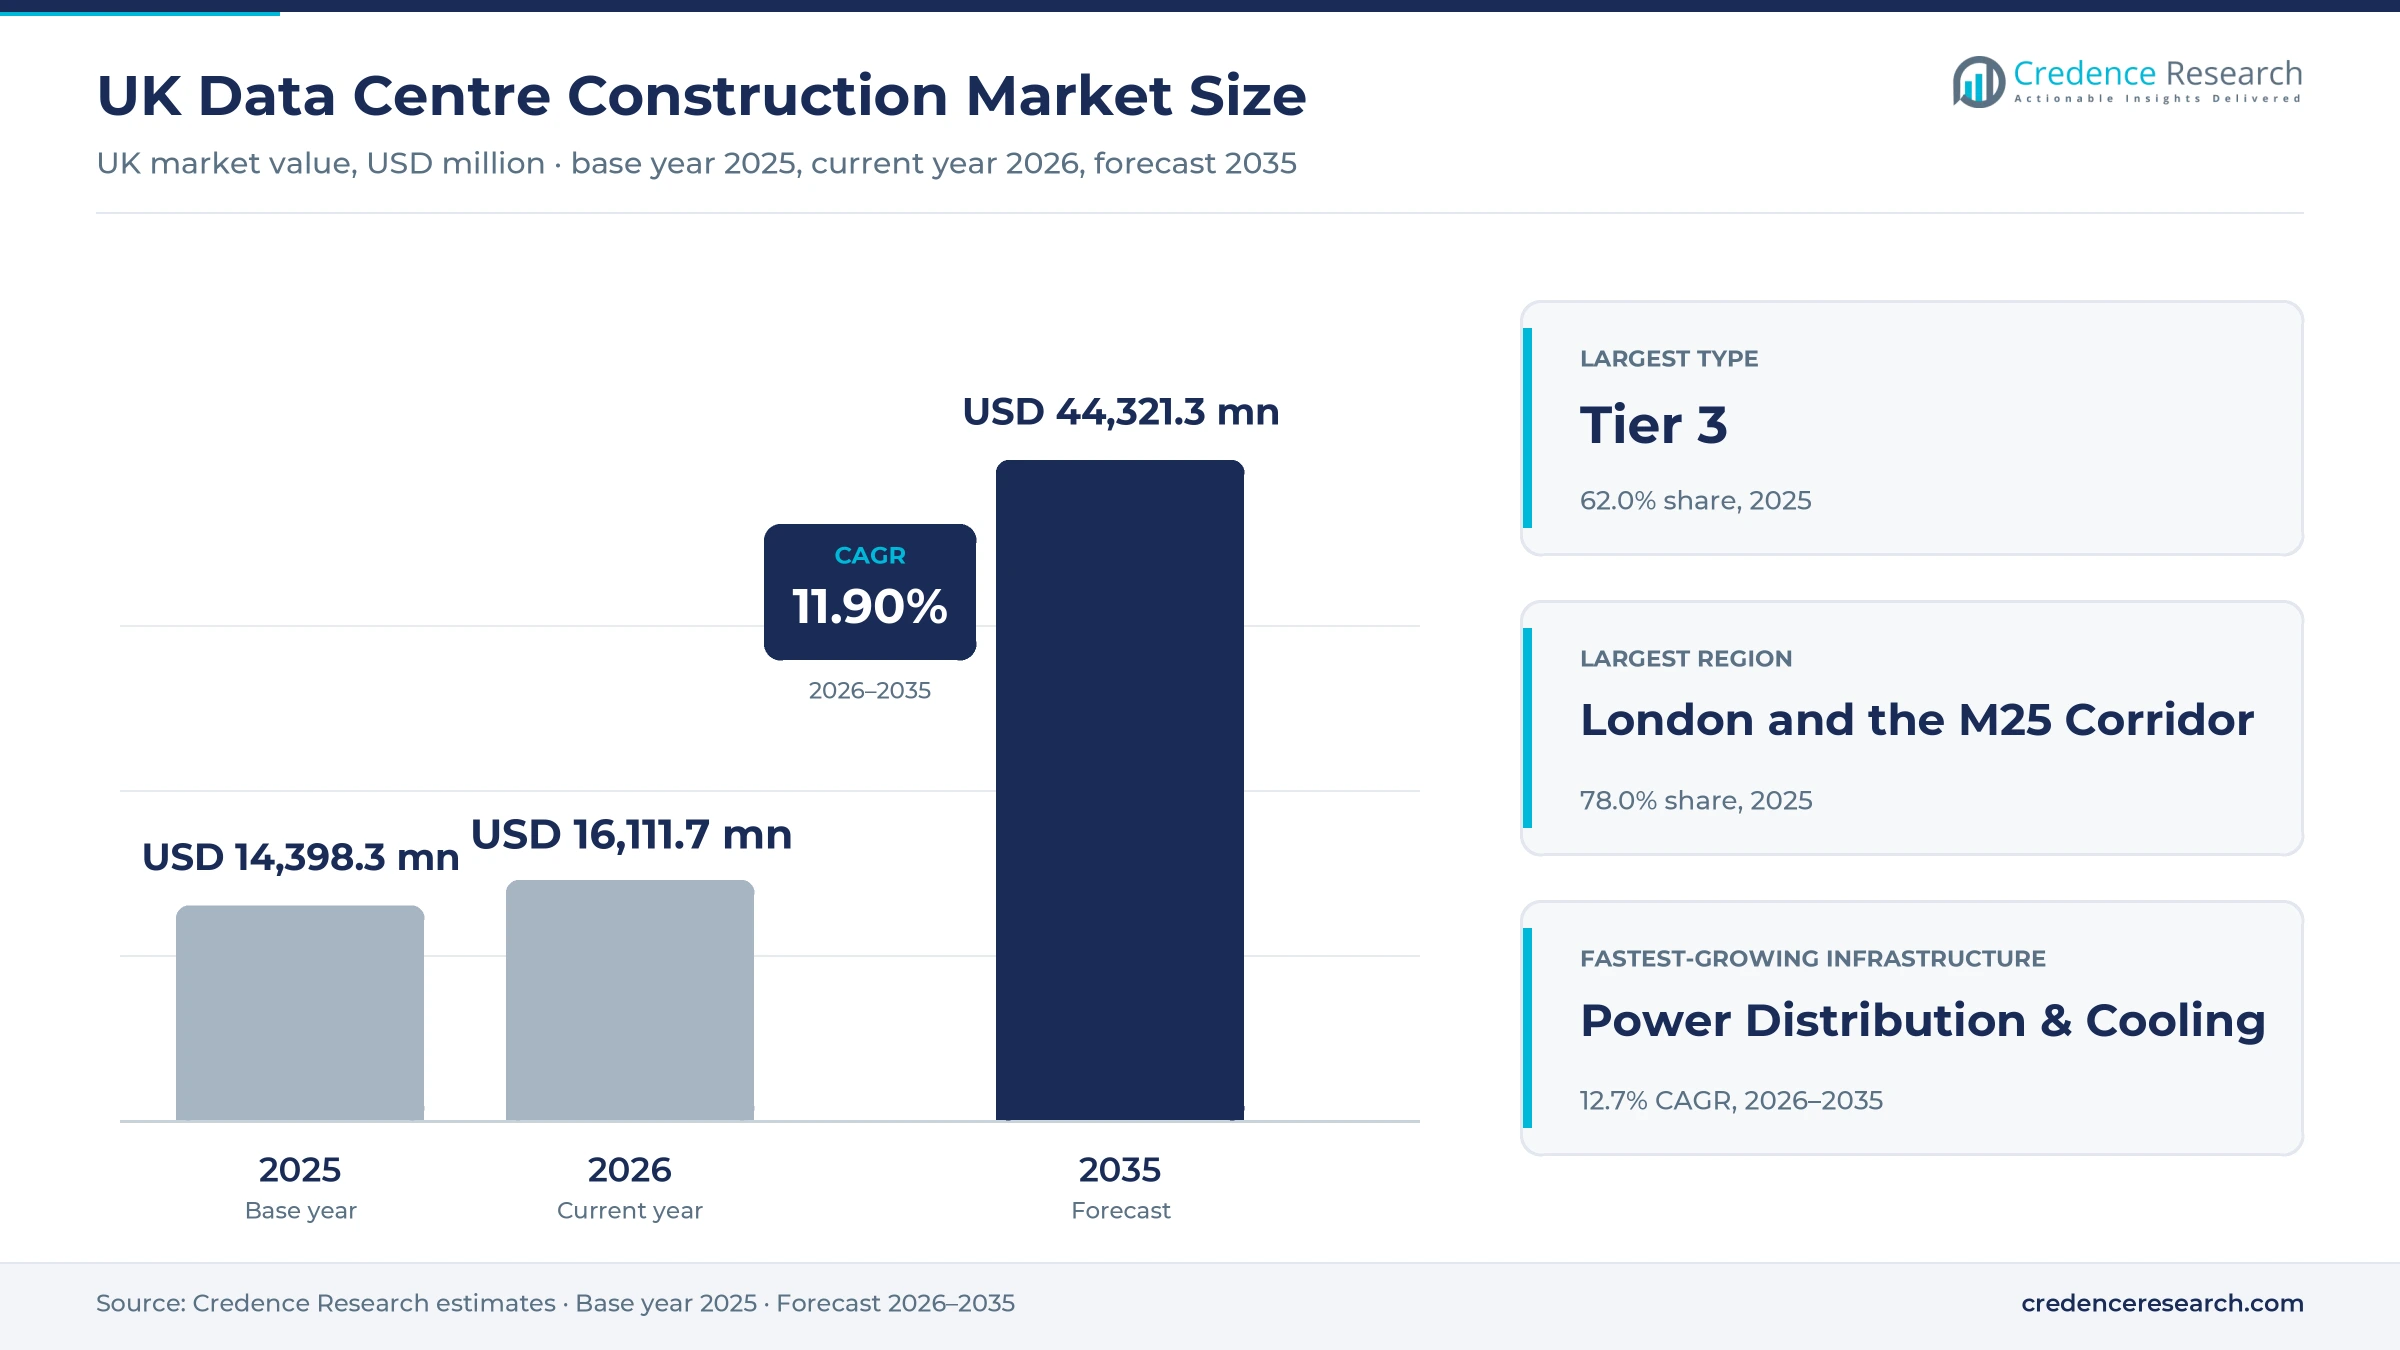
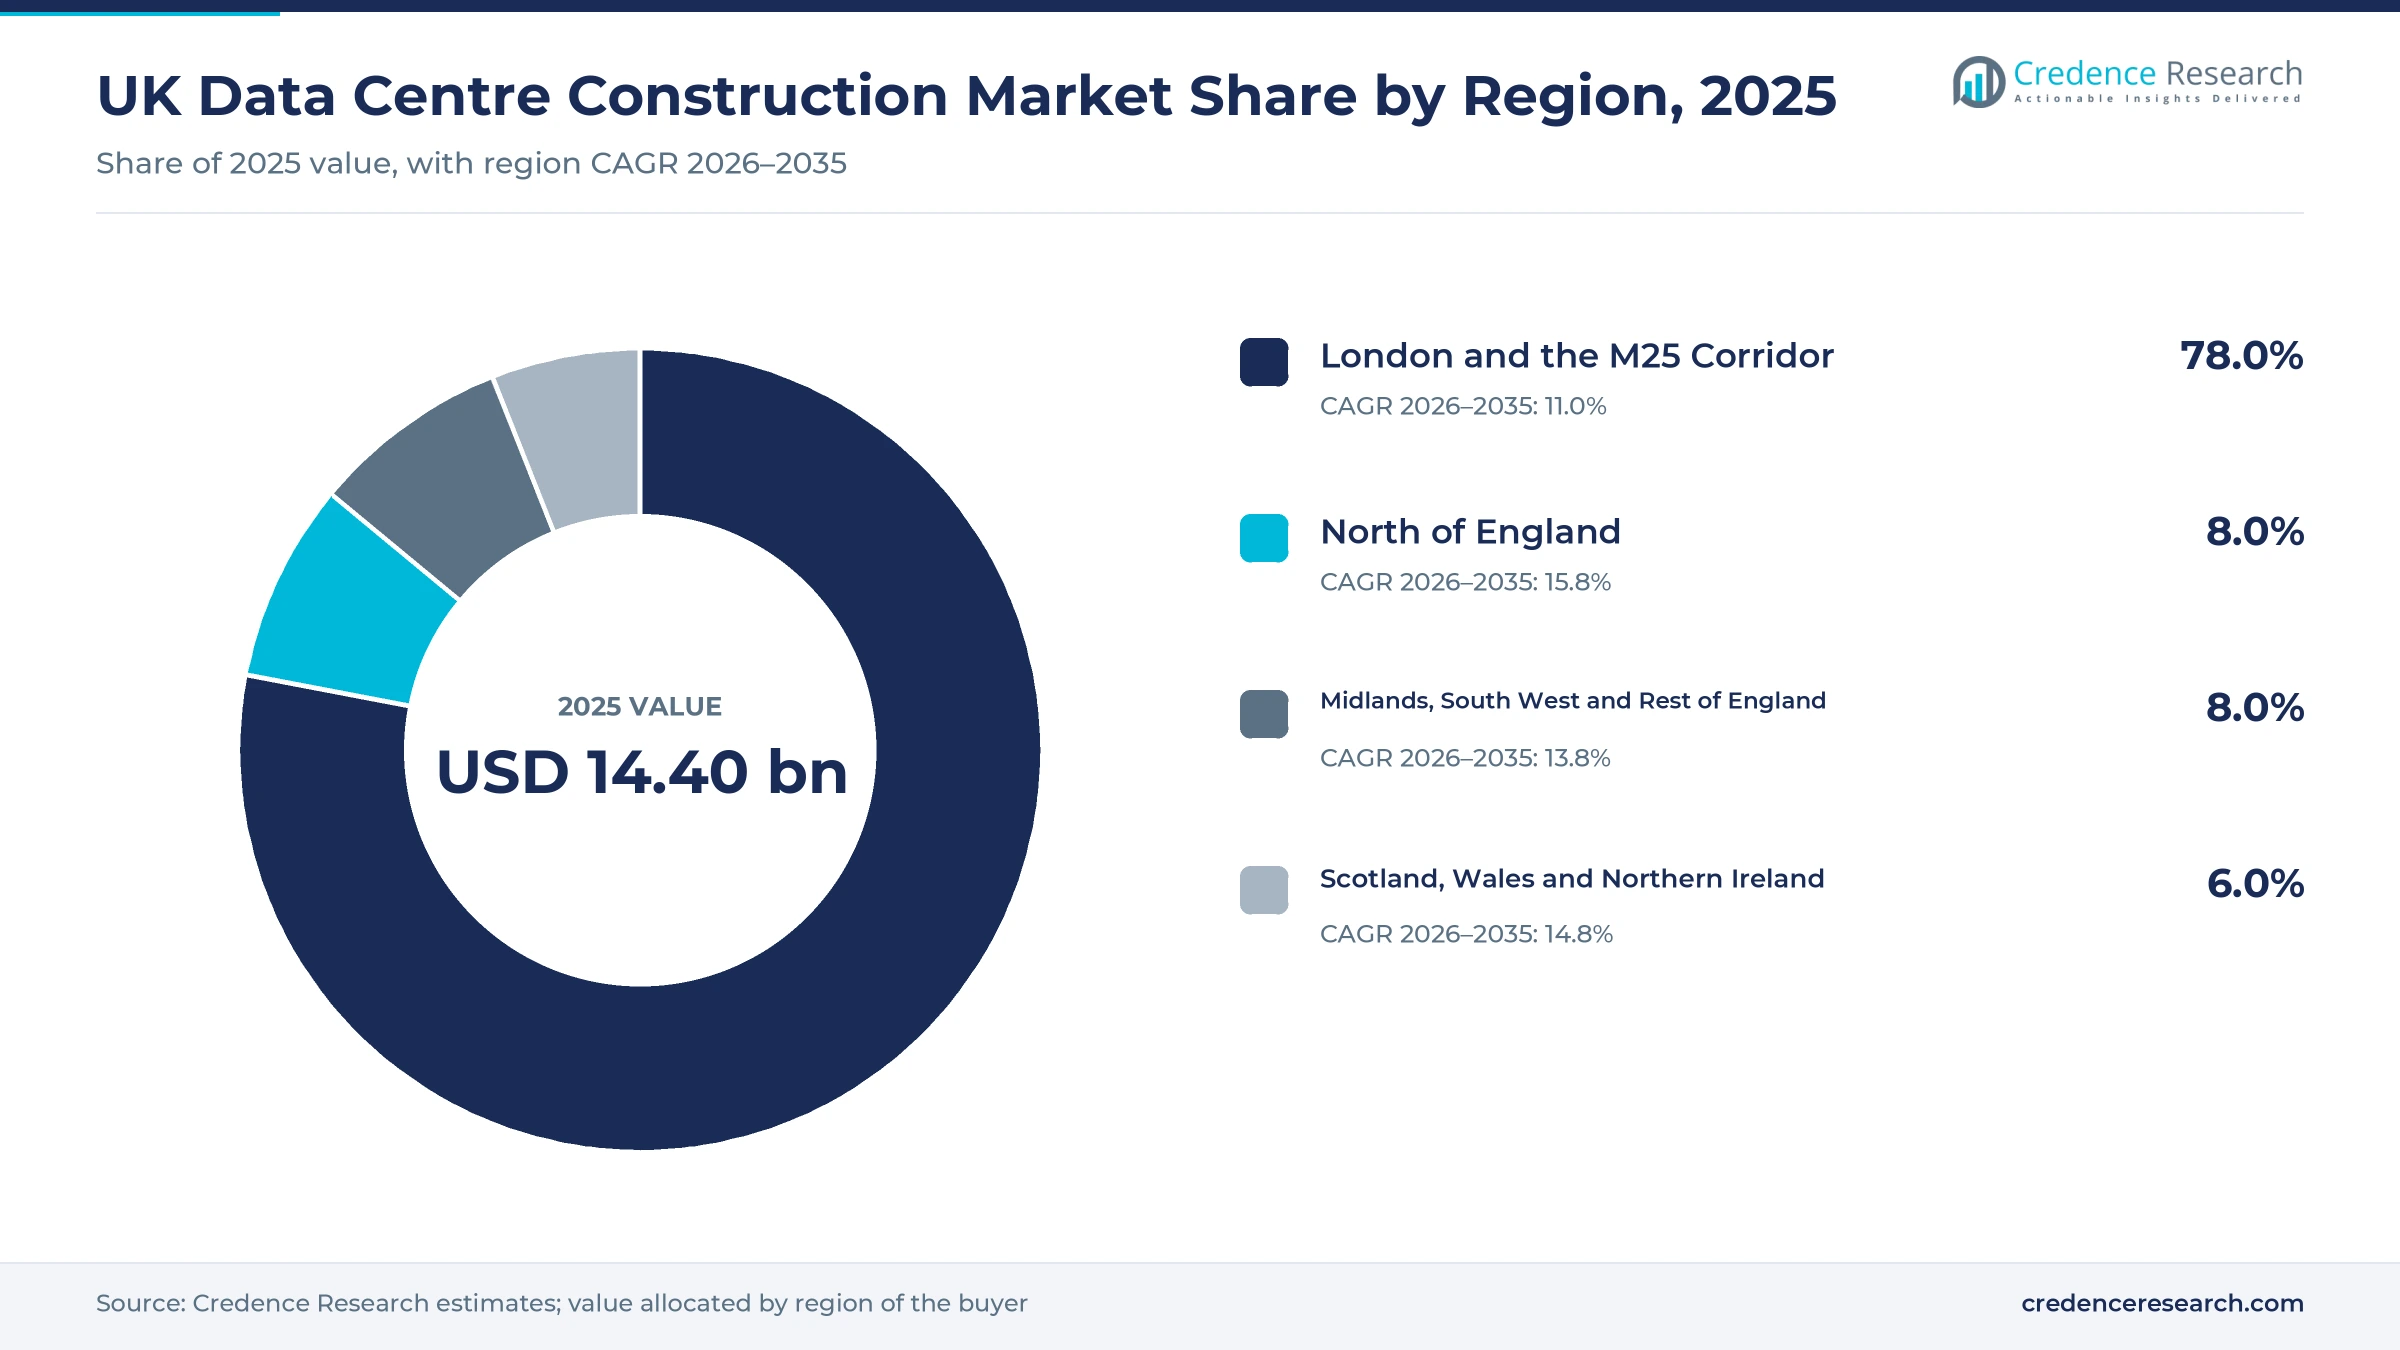
The U.K. data centre construction market was valued at USD 14.40 billion in 2025 and is projected to increase from USD 16.11 billion in 2026 to USD 44.32 billion by 2035, registering a CAGR of 11.90% during 2026–2035. Spending comes from hyperscale cloud providers, wholesale colocation developers and public research programs that are adding halls for cloud and artificial intelligence workloads, and from banks and public bodies that keep regulated systems in the country. London and the M25 Corridor held the largest regional share, 78.0% in 2025, because fiber routes, cloud regions and corporate tenants cluster around the capital. North of England is the fastest-growing region at 15.8% a year as large campuses follow available grid capacity and cheaper land. The decisive commercial change is that grid connection dates, rather than tenant demand, now decide which projects reach construction, so contractors increasingly price programs around substation and cable works.
Build, power and IT fit-out make up the counted spending
This report sizes annual spending on building and fitting out data centres in the U.K., covering site enabling works, building shells, electrical systems such as switchgear, UPS and generators, cooling plant and the servers, storage and network equipment installed in new or expanded halls. It counts work commissioned by hyperscale cloud providers, colocation developers, enterprises and public research bodies.
Colocation rent, cloud subscriptions and routine maintenance are excluded, because they are earned from the assets counted here. The Office for National Statistics said in August 2026 that it cannot yet separately identify investment in data centres in the national accounts, so the estimate rests on capacity, cost and pipeline data rather than an official series.
UK Data Centre Construction Market Insights
- The U.K. data centre construction market was worth USD 14.40 billion in 2025 and is forecast to reach USD 44.32 billion by 2035, growing at 11.90% a year during 2026–2035.
- London and the M25 Corridor held 78.0% of 2025 spending, while the North of England grows fastest at 15.8% a year as large campuses chase grid capacity.
- Tier 3 facilities made up 62.0% of 2025 spending, because wholesale colocation and cloud halls are designed to concurrently maintainable standards.
- U.K. data centre take-up reached a record 217 MW in 2025 and vacancy fell to 8%, according to Savills, which keeps developers building ahead of demand.
- The demand connection queue in Great Britain rose from 41 GW in November 2024 to 125 GW in June 2025, Ofgem said, with data centres a significant share.
Tier 3 halls lead while cooling and power gain fastest
Why do Tier 3 halls take most of the build budget?
Based on type, the market is categorized into Tier 1, Tier 2, Tier 3 and Tier 4 facilities. Tier 3 led with 62.0% of 2025 spending, because wholesale colocation, the largest buyer group, is designed with concurrently maintainable power and cooling paths, and Savills counted 1,163 MW of live wholesale colocation capacity in early 2026. Tier 4 grows fastest at 13.2% a year as operators of sites covered by the critical national infrastructure status described in the drivers add fault-tolerant power and cooling paths. Public data on certified Tier 4 sites in the U.K. are limited, so this split carries more uncertainty than the others.
Why does IT equipment still outspend the buildings?
Based on infrastructure, the market is categorized into IT infrastructure, power distribution and cooling infrastructure, and general construction and other infrastructure. IT Infrastructure led with 52.0% of 2025 spending, because accelerated servers cost more per megawatt than the halls around them, and ONS data show U.K. imports of computers and communication equipment rose by £4.7 billion between 2024 and 2025 across all industries. Power Distribution & Cooling Infrastructure grows fastest at 12.7% a year as denser racks need more cooling, and Airedale by Modine said its Bradford plant would raise its U.K. output of precision air conditioning units and other data center cooling by 150%.
Why do cloud and telecom buyers commission most halls?
Based on vertical, the market is categorized into IT and telecom, BFSI, government and defense, healthcare, energy and others. IT & Telecom led with 46.0% of 2025 spending because cloud providers and colocation landlords build for resale, and Mercury Engineering handed over the 40.5 MW GB One colocation site in Slough by the fourth quarter of 2024. Government & Defense grows fastest at 13.7% a year as public compute moves from plans to sites, with the £225 million Isambard-AI system launched in Bristol in July 2025 and up to £750 million confirmed for a national supercomputer in Edinburgh in June 2025.
| Segment Group | Leading Sub-segment | Share, 2025 | Fastest-growing Sub-segment | CAGR, 2026–2035 |
|---|---|---|---|---|
| By Type | Tier 3 | 62.0% | Tier 4 | 13.2% |
| By Infrastructure | IT Infrastructure | 52.0% | Power Distribution & Cooling Infrastructure | 12.7% |
| By Vertical | IT & Telecom | 46.0% | Government & Defense | 13.7% |
London build costs rise while regional sites cost less
Data centre construction is priced per watt of IT capacity, because power, cooling and resilience equipment scale with load rather than floor area. London build costs rose about 7% in a year on the benchmark below, which lifts demand for fixed-price certainty, and the gap over the regional average reflects labor shortages, tight logistics in the M25 area and long lead times for switchgear, transformers, chillers and uninterruptible power supply equipment. Regional sites outside London can cost less, which can help developers of northern and Welsh campuses compete on rent. Contractors with secured equipment slots can charge for certainty, while buyers that fix designs early limit the cost of late changes.
| Cost item | Typical price or fee | Basis |
|---|---|---|
| Build cost, London, 2025 | About USD 12.02 per watt of IT capacity | Turner & Townsend, via Savills, 2026 |
| Build cost, London, 2024 | About USD 11.20 per watt of IT capacity | Turner & Townsend, via Savills, 2026 |
| Build cost, EMEA average, 2025 | About USD 10.92 per watt of IT capacity | Turner & Townsend, via Savills, 2026 |
| Regional sites against London and the M25 | Up to 40% cheaper in some estimates | Association for Consultancy and Engineering, August 2025 |
Request a Free Sample
Fill in your details and we'll send you a free sample report.
- Sample data tables & charts
- Research methodology
AI policy, hyperscaler capital and tight vacancy lift builds
National AI compute targets create anchor demand
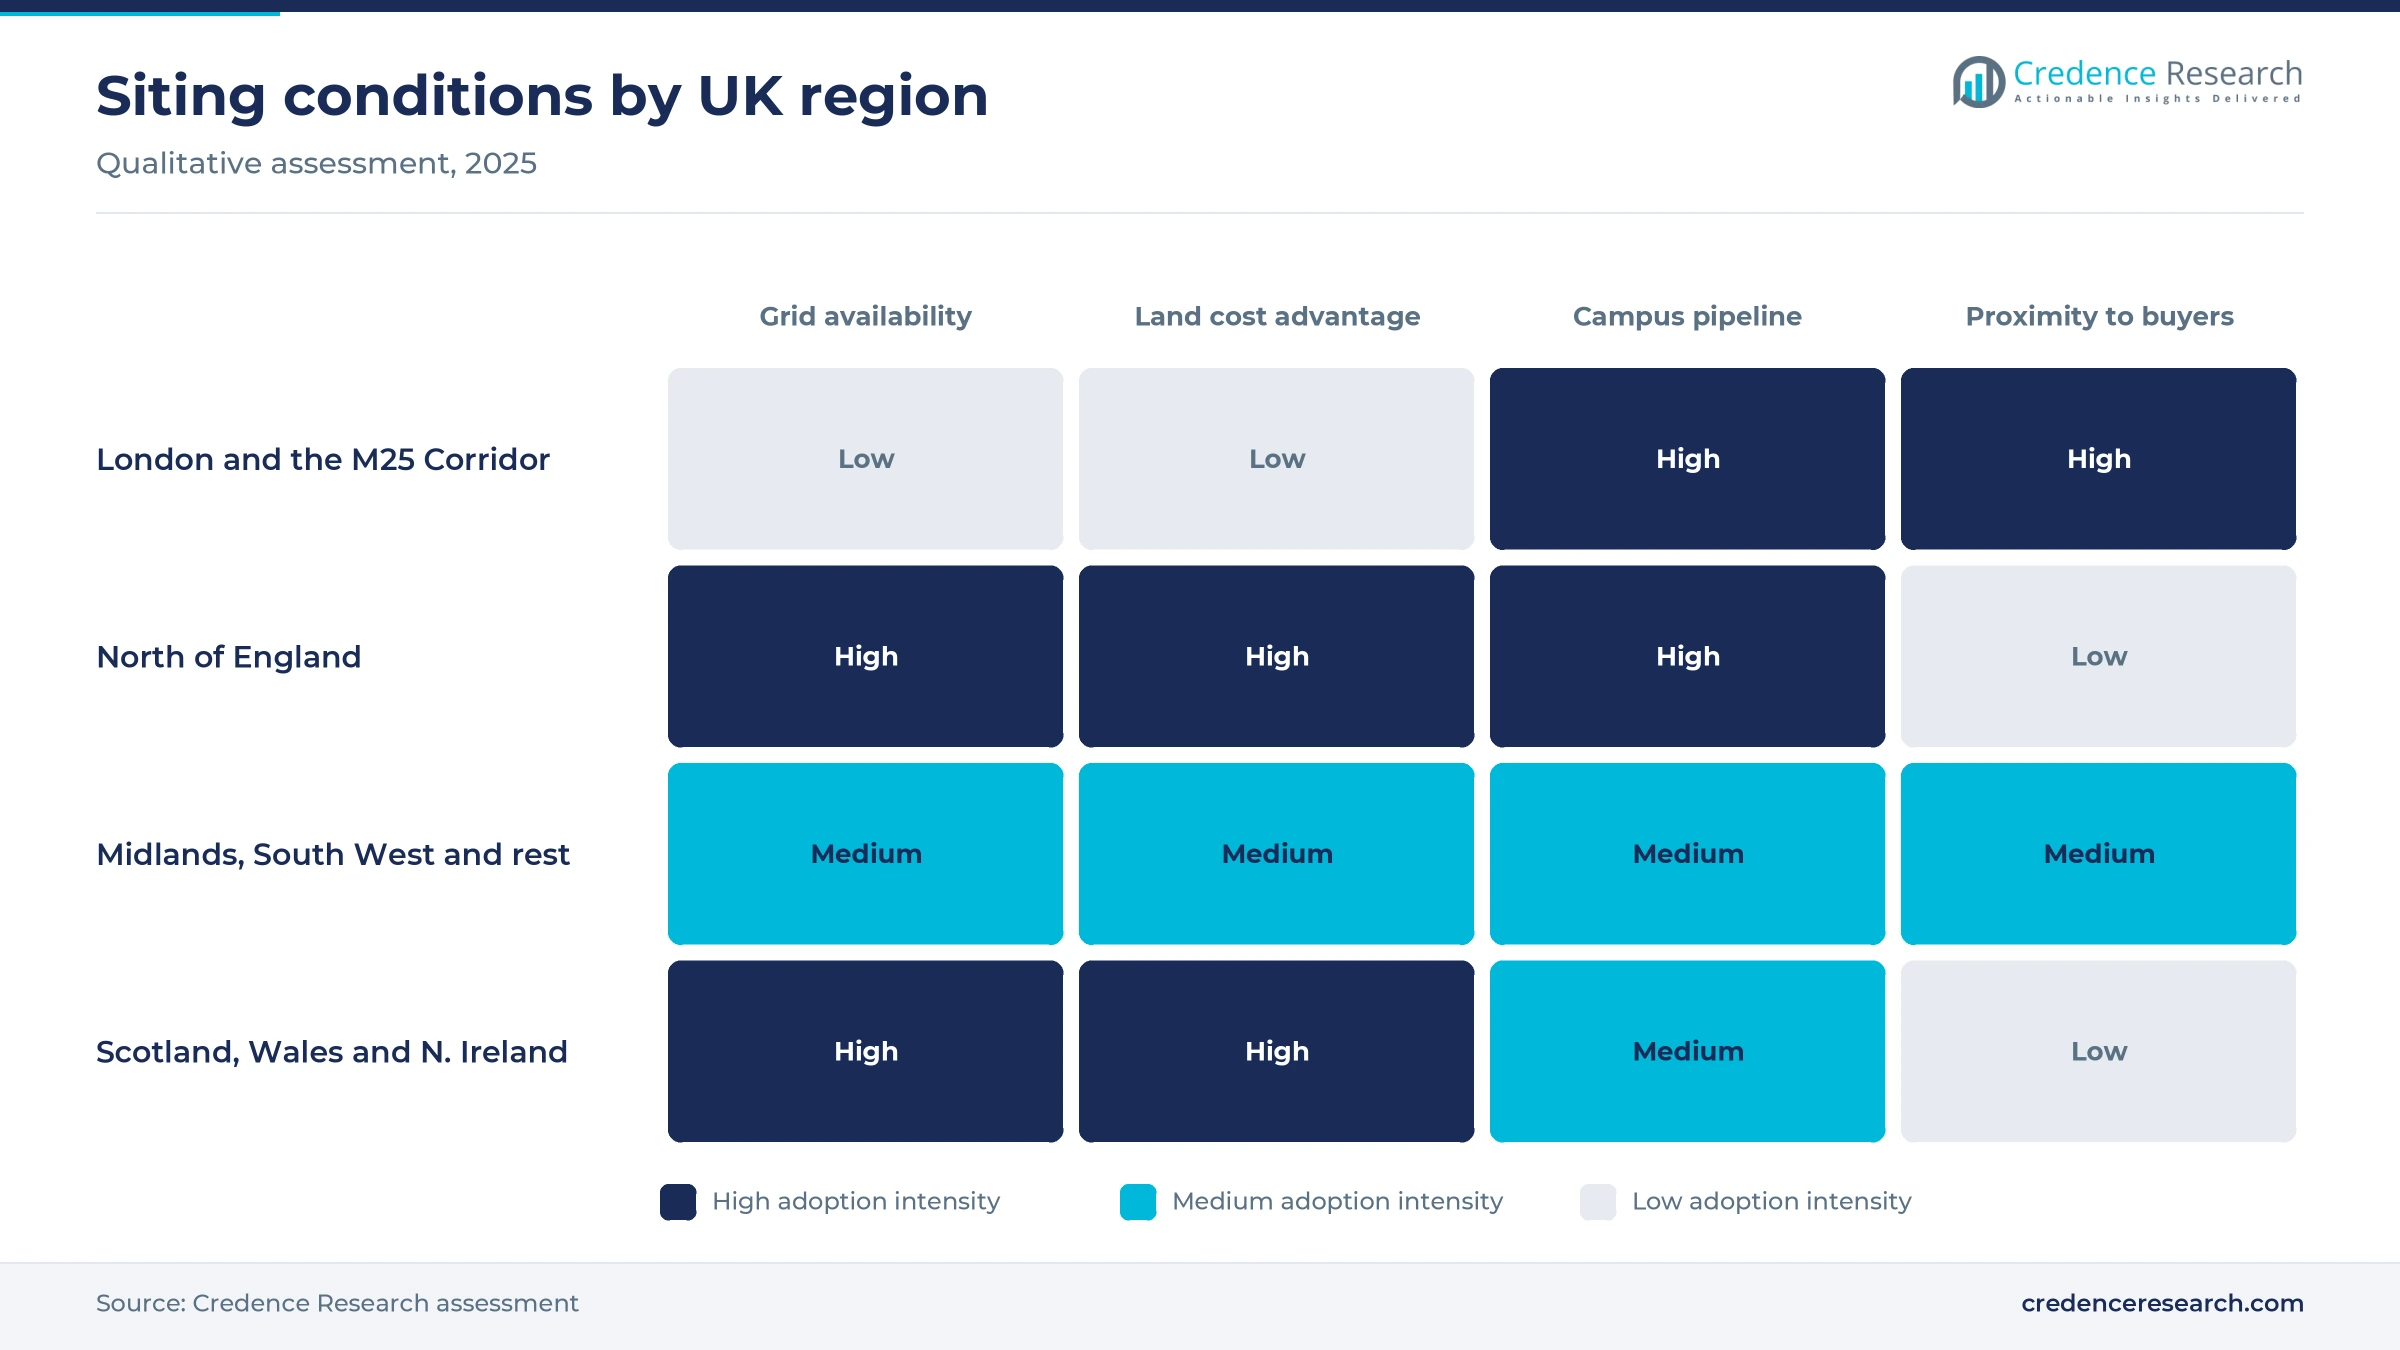
Government compute targets turn AI policy into orders for halls, substations and cooling, because each new tranche of public or partner capacity needs a site. The government's response to the AI Opportunities Action Plan in January 2025 committed to expand sovereign compute capacity by at least 20 times by 2030. Culham in Oxfordshire was named the first AI Growth Zone, and the government said it would work with network operators to scale each zone to 500 MW or more. The North East became an AI Growth Zone in September 2025, and the government linked up to £30 billion of potential investment to it. These zones favor contractors able to deliver grid works and large halls together.
Hyperscaler and colocation capital commits to new campuses
Large capital programs by cloud and colocation groups give contractors several years of visible work, because each program spans enabling works, base builds and phased fit-outs. Google committed £5 billion over two years and opened its Waltham Cross data centre in Hertfordshire on Sept. 16, 2025, with more than 250 companies working on the site. Microsoft announced a £22 billion plan to expand U.K. AI infrastructure between 2025 and 2028, the Irish News reported. Equinix bought the 85-acre South Mimms site from DC01UK in October 2025 in a deal of about £3.9 billion. Main contractors and electrical specialists on hyperscaler frameworks gain the most from these commitments.
Record take-up and low vacancy push building ahead
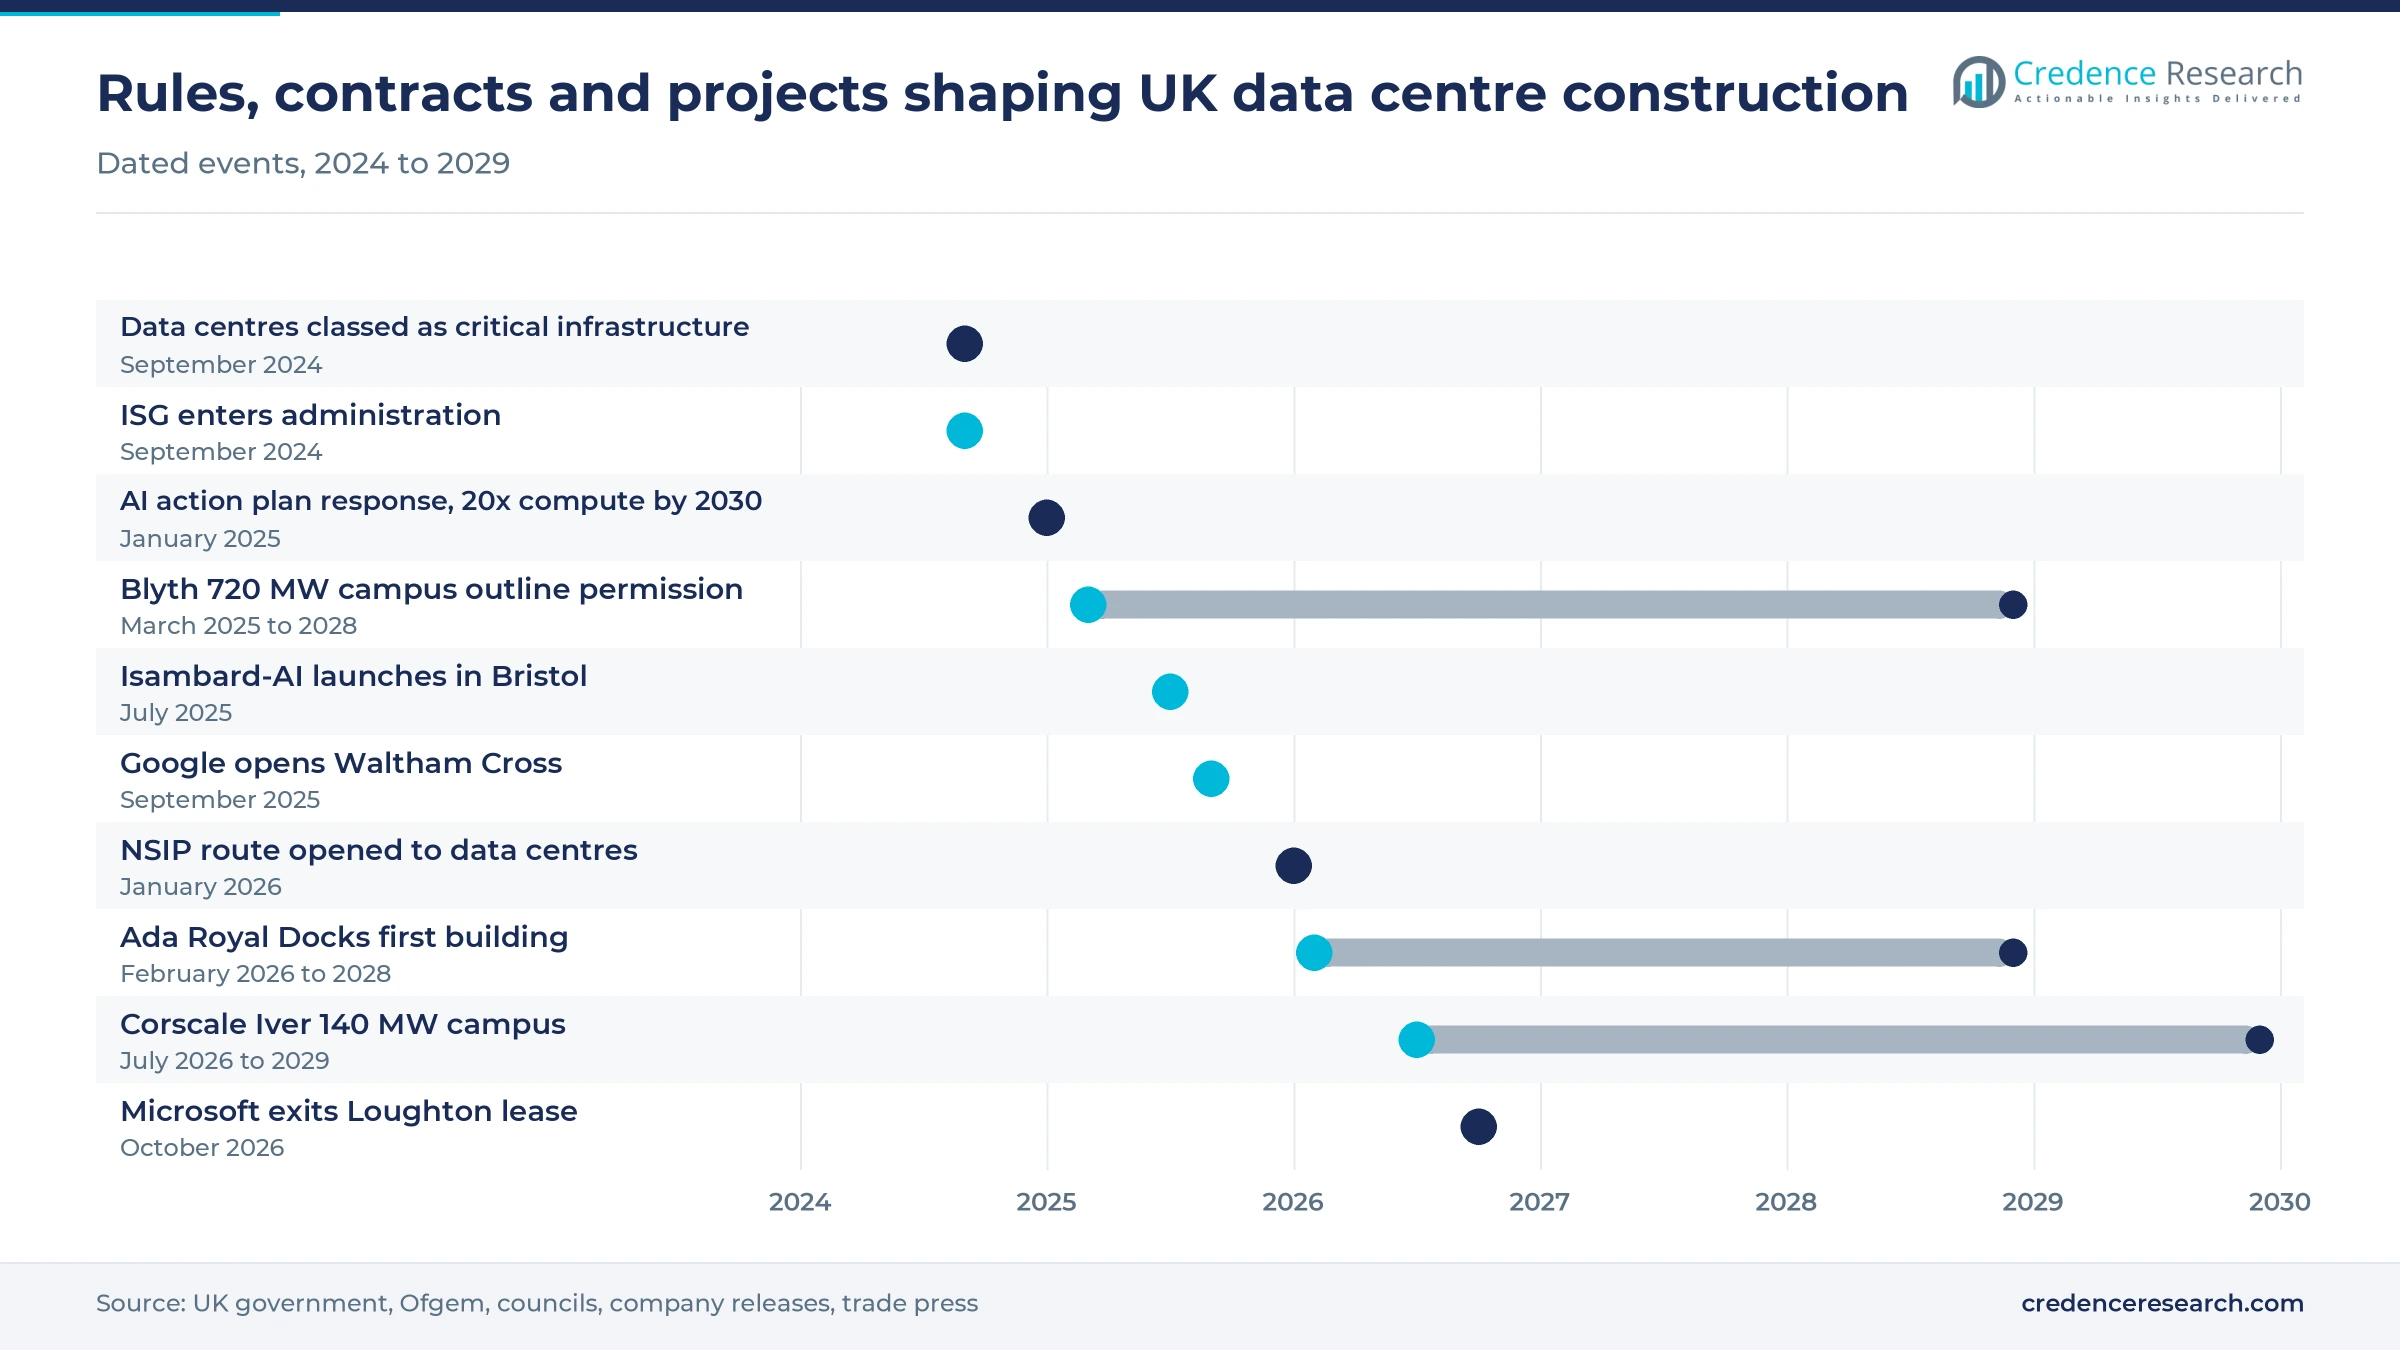
Scarce available space forces tenants to commit before halls are finished, which lowers leasing risk and lets developers start construction sooner. Savills reported record U.K. data centre take-up of 217 MW in 2025, up from 212 MW in 2024, with vacancy at 8% nationally and 7% in London. About 242 MW was under construction in early 2026, while 2,084 MW was committed but not yet started. Because committed capacity is almost nine times the space under construction, the pipeline supports orders for enabling works, transformers and cooling plant well beyond 2027, provided that grid dates hold.
Infrastructure status and planning reform speed approvals
Policy changes since 2024 make data centres easier to consent, which shortens the time between land purchase and construction. The government classed data centres as critical national infrastructure on Sept. 12, 2024, the first such designation in almost a decade. Regulations made on Jan. 8, 2026, let developers ask for a data centre to be treated as a nationally significant project, decided by the Secretary of State rather than the local council. The Deputy Prime Minister had already overruled a council to approve Corscale's 140 MW campus at Iver after a public inquiry. Developers holding green belt or grey belt land near the M25 benefit most from these changes.
Liquid cooling and private-wire power reshape new campuses
Direct liquid cooling and modular halls rise for AI
Builders are shifting from air-cooled halls to liquid-cooled and prefabricated designs to handle GPU racks that air alone cannot cool. The University of Bristol said Isambard-AI uses 100% fan-less direct liquid cooling, housed in a modular data center installed by Oakland Construction. The modular build cut carbon emissions by about 72% compared with traditional methods, the university said in July 2025. The 6 MW first phase of Blackpool's Silicon Sands site, which reached preferred-bidder stage in July 2026, is designed around liquid immersion cooling. Suppliers of liquid cooling systems, coolant distribution units and factory-built modules gain, which is why Power Distribution & Cooling Infrastructure grows fastest.
Private-wire power emerges as a route around the grid
Developers are shifting toward sites with their own generation to avoid waiting for transmission connections. Mace Construct signed a memorandum of understanding with Pathfinder Clean Energy for 168 MW of IT capacity across three sites in the Southeast, West Midlands and West of England, powered by direct-wire renewables. The sites were expected to enter construction in 2026, with data capacity from 2028. Savills noted that reforms had allocated only about 11 GW of demand connections due before 2030, while data centre projects were requesting about 50 GW of transmission connections. In Lanarkshire, the fifth AI Growth Zone named in January 2026, DataVita plans over 1 GW of renewable infrastructure connected by private wire. Contractors that can deliver generation, storage and halls under one program stand to win these packages.
Waste heat reuse opens district heating contracts
Councils and heat network operators can turn data centre waste heat into low-cost supply, creating civil and mechanical work around each site. Google said in September 2025 that its Waltham Cross site supports off-site heat recovery, so heat can be supplied free of charge to nearby homes, schools or businesses. In July 2026, Blackpool Council set out plans to feed waste heat from its Silicon Sands data centre into a proposed district heat network for the wider development. The University of Bristol said in July 2025 that Isambard-AI waste heat could be recycled to warm nearby homes and businesses, a feature that suits low-carbon facility designs. Mechanical contractors that design these links into the base build gain a service line that pure building contractors lack.
A deep project pipeline opens room for new contractors
The gap between planned projects and contractor capacity gives mid-sized builders and engineering firms a chance to enter hyperscale work. The Association for Consultancy and Engineering counted 94 planned new-build data centre projects worth an estimated £36.4 billion in August 2025, far more work than the 242 MW under construction can absorb. McLaren Construction was appointed in February 2026 to build the first 70 MW building of Ada Infrastructure's planned 210 MW Royal Docks campus. Mace created a new director of technology role in April 2026 to lead its growing data centre division. Contractors that add electrical and commissioning skills can claim a share of this work.
Grid queues, West London limits and contractor risk bite
Grid connection queues delay large campuses
New demand connections have become the main bottleneck for large projects. Ofgem said the demand connection queue grew from 41 GW in November 2024 to 125 GW in June 2025, with data centres a significant share. Microsoft withdrew from a deal to lease capacity at Nscale's Loughton site in October 2026 because grid access was not expected until after 2030. Developers without firm connection dates are most exposed, and contractors face start dates that slip with them.
West London power limits collide with housing
Data centre loads in West London have already reached the limits of parts of the local network. A London Assembly committee found in December 2025 that grid capacity in Hillingdon, Hounslow and Ealing had been full and that new housing had been temporarily halted. It asked the government for a separate planning use class for data centres. Developers in West London are most exposed to tougher planning conditions, which pushes some projects toward other parts of the M25 corridor.
Contractor failures expose supply chain risk
Fixed-price construction contracts leave builders exposed when costs rise faster than tender prices. ISG entered administration in September 2024, ending about 2,200 direct jobs, and BCIS said its loss-making contracts included some data centre projects. Subcontractors went unpaid, and several unfinished projects needed new contractors to complete them. Clients now test balance sheets more closely, which narrows the field of eligible bidders and raises bonding and insurance costs for smaller firms.
Electricity costs and demand raise scrutiny
Operating costs and grid impact are now part of every planning and investment case. ONS estimates that data centres used about 4.5 TWh of electricity in 2024, around 2% of grid electricity consumed in Great Britain and 41% more than in 2020. Manufacturing electricity averaged 17.4 pence per kWh in the second quarter of 2026, up 4% on a year earlier, the energy department said. High prices weaken the case for energy-heavy AI halls, which favors efficient designs and sites with cheaper power.
London holds the base while the North grows fastest
| Region | Value, 2025 (USD million) | Share, 2025 | CAGR, 2026–2035 |
|---|---|---|---|
| London and the M25 Corridor | 11,230.7 | 78.0% | 11.0% |
| North of England | 1,151.9 | 8.0% | 15.8% |
| Midlands, South West and Rest of England | 1,151.9 | 8.0% | 13.8% |
| Scotland, Wales and Northern Ireland | 863.9 | 6.0% | 14.8% |
London and the M25 corridor hold most live capacity
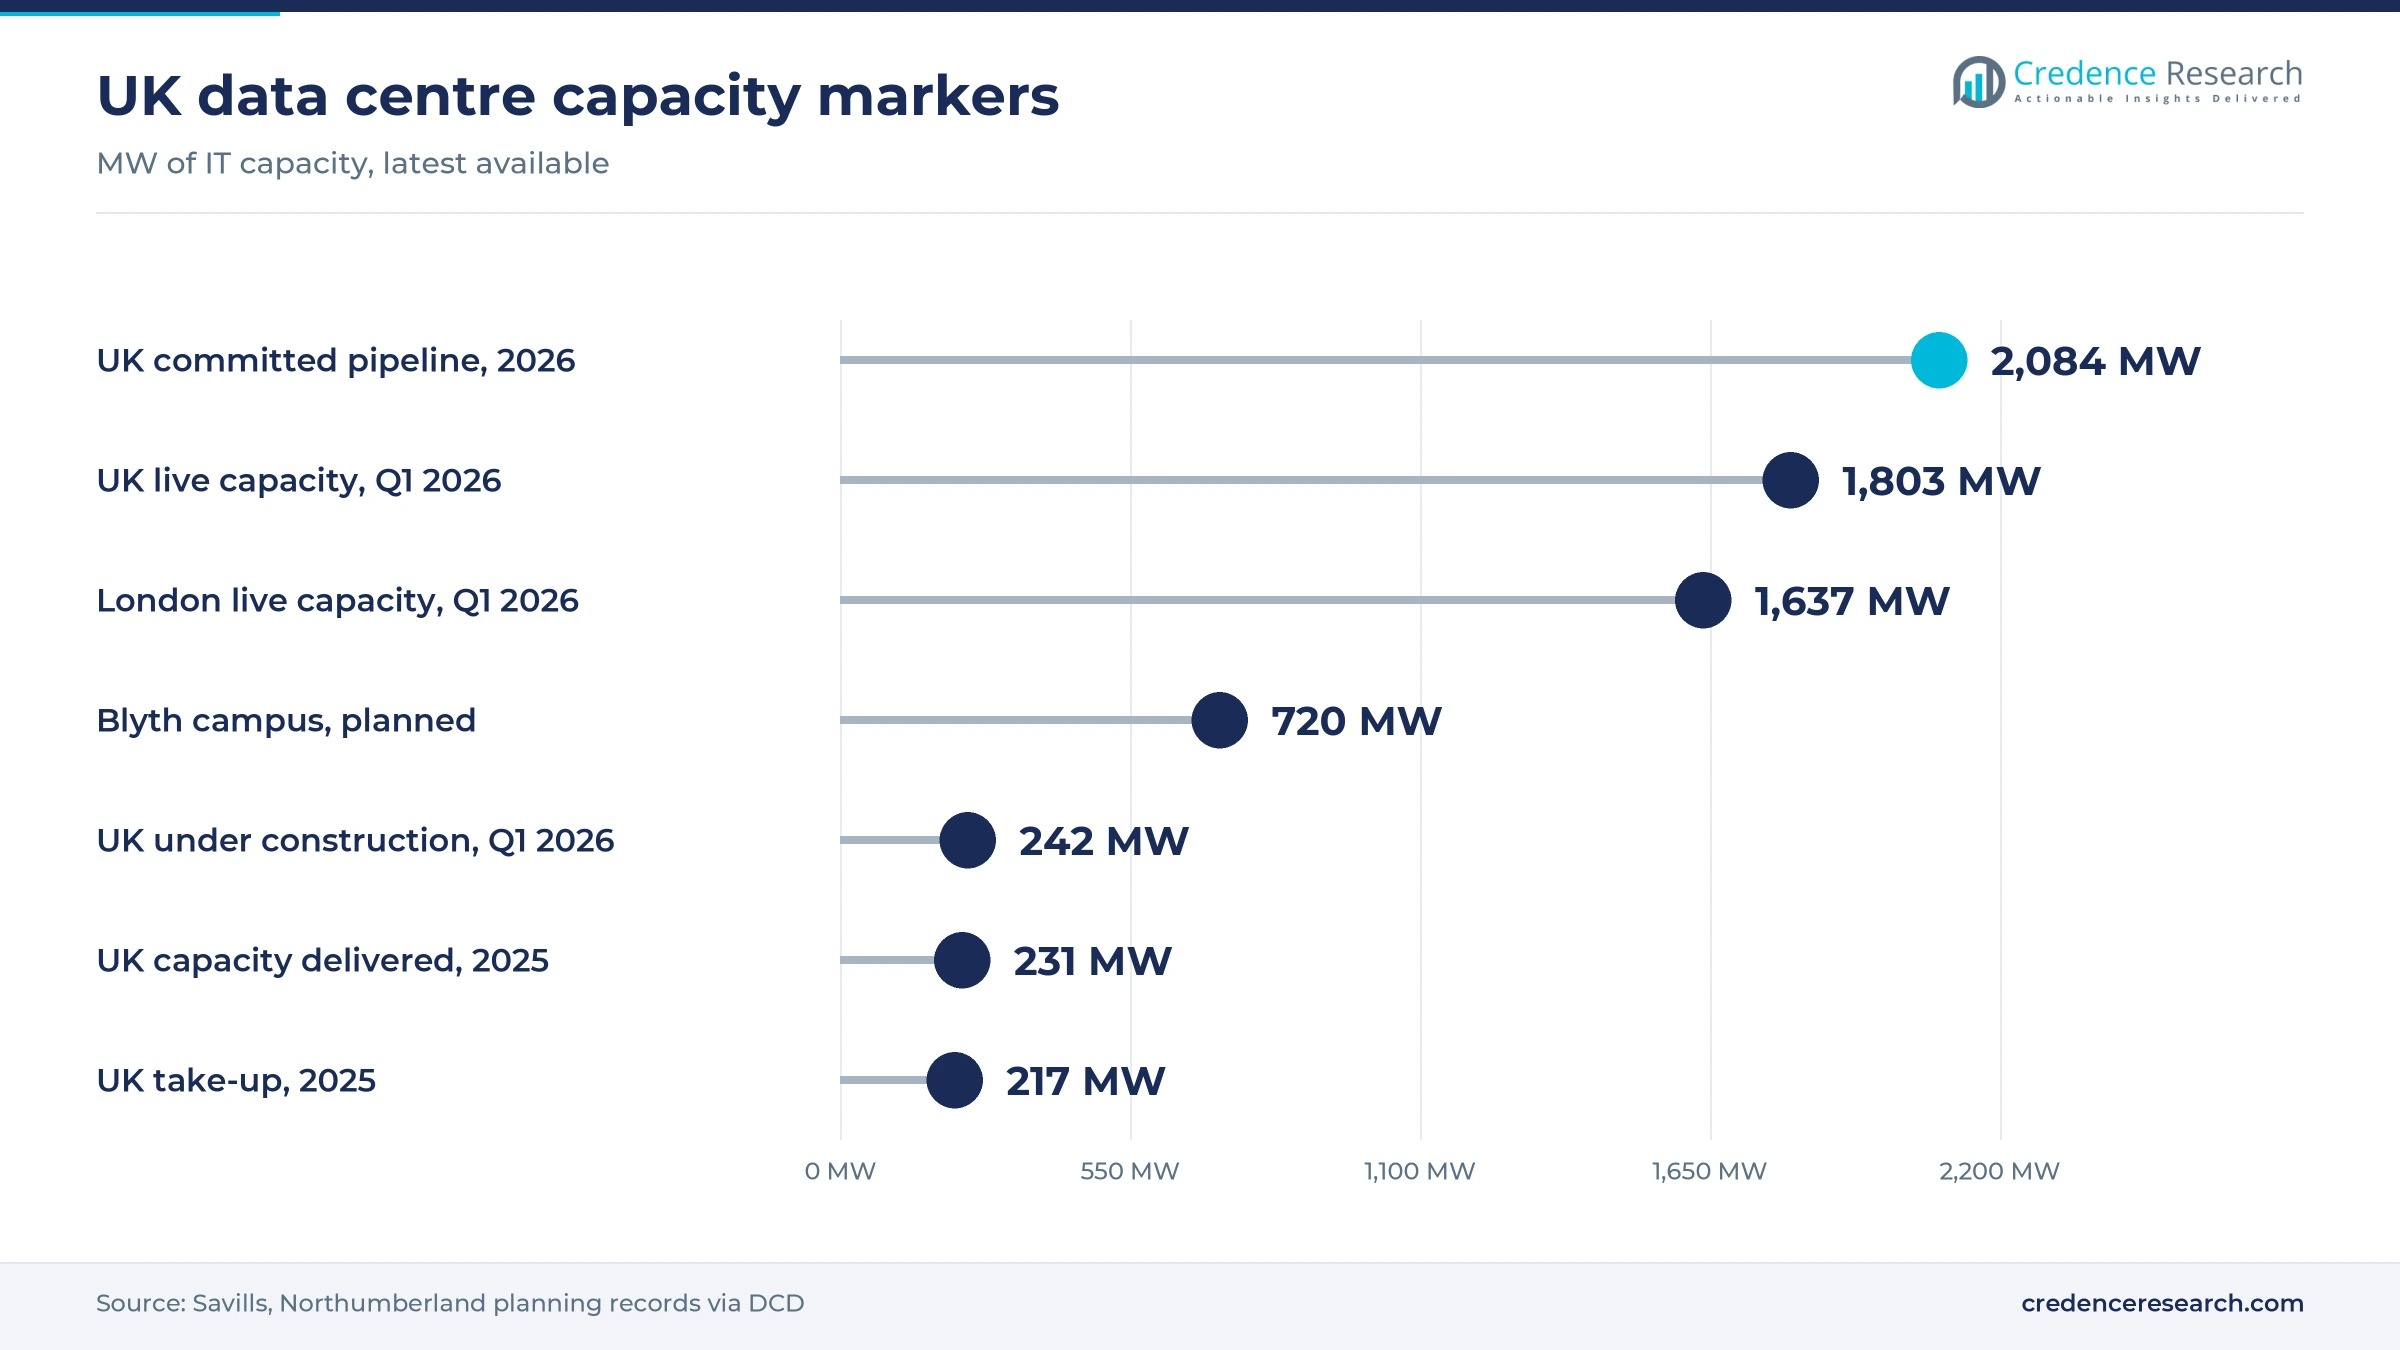
London and the M25 Corridor held 78.0% of 2025 spending and grows at 11.0% a year, the slowest of the four regions. Savills counted 1,637 MW of live capacity in the London market in early 2026, about 91% of the U.K. total, and almost all capacity under construction was in London. Corscale's 140 MW campus at Iver, set for practical completion in late 2029, shows that large projects still choose M25 sites when power can be secured. Grid limits will slow new starts, so spending shifts toward refits and denser halls.
The North of England draws the largest new campuses
The North of England held 8.0% of 2025 spending and is the fastest-growing region at 15.8% a year. Northumberland County Council granted outline permission in March 2025 for the QTS campus at Cambois near Blyth, planned as ten buildings of 72 MW each, or 720 MW in total. The August 2025 pipeline count by the Association for Consultancy and Engineering included five planned data centres in Greater Manchester. The Blyth scheme is expected to need about 1,200 construction workers, lifting regional demand for civil and electrical crews. Cheaper land and spare grid capacity let northern projects reach a scale that London sites cannot.
The Midlands and South West build compute and edge sites
The Midlands, South West and rest of England held 8.0% of 2025 spending and grow at 13.8% a year. Isambard-AI in Bristol and the Culham growth zone in Oxfordshire anchor public compute here, and the private-wire sites planned by Pathfinder Clean Energy include the West Midlands and West of England. The same pipeline count named Wiltshire, Leicestershire and Cambridgeshire among the growing locations for planned data centres. These counties offer land near motorway fiber routes at lower cost than the M25, which suits mid-sized campuses.
Scotland and Wales add renewable-powered AI capacity
Scotland, Wales and Northern Ireland held 6.0% of 2025 spending and grow at 14.8% a year. The Lanarkshire AI Growth Zone, led by DataVita with CoreWeave, plans 100 MW of AI-ready capacity backed by £8.2 billion of private investment, Data Centre Review reported in January 2026. Nine of the planned projects in that count were in Wales. Renewable supply and lower land costs give the devolved nations an edge for AI training sites, while latency limits their role for trading and retail cloud workloads.
Contracts and site deals in 2025-26 fix the next pipeline
| Development | Status and market relevance |
|---|---|
| In September 2025, Google opened its Waltham Cross data centre in Hertfordshire as part of a two-year £5 billion U.K. investment. | Operational launch; the site supports Google Cloud, Workspace, Search and Maps. |
| In October 2025, Equinix bought the 85-acre South Mimms data centre site in Hertfordshire from DC01UK in a deal of about £3.9 billion. | Acquisition completed; the site was renamed the Hertfordshire Campus ahead of development. |
| In February 2026, Ada Infrastructure appointed McLaren Construction to lead base-build works for the first 70 MW building at its Royal Docks campus. | Contract award; base build due to complete in mid-2028. |
| In June 2026, Corscale brought in contractors for its £1 billion, 140 MW campus at Court Lane in Iver, with Phoenix ME on a pre-construction agreement. | Pre-construction; enabling works from July 2026 and completion due in late 2029. |
| In July 2026, Blackpool Council named Hochtief Data Centre Partner U.K. preferred concessionaire for the £250 million first phase of Silicon Sands. | Preferred bidder; contract signing expected from October 2026. |
Direct liquid cooling and modular builds change site work
- Direct liquid cooling pipes coolant to cold plates on each processor, which removes the heat limit that caps air-cooled AI racks.
- Prefabricated modules move power and cooling assembly into factories, and Schneider Electric and DataCentre U.K. installed two modular data centres for a South Warwickshire NHS trust in November 2025.
- Immersion cooling submerges servers in dielectric fluid, which allows higher density in small sites such as the planned Blackpool hall.
- Battery-backed private wire pairs on-site renewables and storage with halls, so campuses can start before a full transmission connection is ready.
Need a Custom Version of This Report?
Tailor the scope, geography, or segments to your exact requirements.
- Custom geography or segment scope
- Direct access to our analyst team
Tier-one builders and M&E specialists compete on delivery
Competition in the U.K. data centre construction market turns on delivery record, electrical capability and balance sheet strength more than on price alone. Mace and McLaren Construction lead among main contractors, with McLaren holding the Royal Docks and Iver campuses and Mace building a dedicated technology division. Mercury Engineering competes as a general contractor and M&E specialist, shown by its phased GB One handover in Slough. Hochtief is entering through a concession model in Blackpool that combines investment, building and operation. Arup and AECOM compete for design and engineering roles, while Schneider Electric, Johnson Controls and Airedale by Modine supply power and cooling plant. Hewlett Packard Enterprise supplies IT systems and modular pods, as it did for Isambard-AI.
How is the supply side organized and where do margins sit?
Supply in this market is organized in four distinct layers of firms. Hyperscale cloud providers and colocation developers such as Google, Equinix, QTS, Corscale and Ada Infrastructure own the projects and hold the grid contracts. Tier-one main contractors such as Mace, McLaren Construction and Hochtief deliver base builds, while specialists such as Mercury Engineering and Phoenix ME carry the mechanical and electrical packages that make up most of the build value. Designers such as Arup and AECOM shape layouts, and equipment makers such as Schneider Electric, Johnson Controls and Airedale supply power and cooling plant. Margins sit with owners holding approved power and with equipment makers, while contractors compete on delivery record and balance sheet strength.
Companies profiled and their roles in this market
| Company | Type | Role in the market |
|---|---|---|
| Mace Group | Main contractor | Data centre construction division; partner on the planned 168 MW clean-powered portfolio |
| McLaren Construction Group | Main contractor | Base build at Ada Royal Docks and delivery of the Iver campus |
| Mercury Engineering | Contractor and M&E specialist | General contractor for the 40.5 MW GB One colocation site in Slough |
| Hochtief AG | Contractor and concession operator | Preferred concessionaire for the Blackpool Silicon Sands first phase |
| AECOM | Design and engineering consultant | Design, engineering and cost advice for U.K. data centre projects |
| Arup Group | Design and engineering consultant | Mechanical, electrical and structural design for data centre clients |
| Schneider Electric SE | Power and cooling equipment supplier | Modular data centres, UPS, racks and power distribution for U.K. sites |
| Johnson Controls International PLC | Cooling and building systems supplier | YORK chillers and building controls for U.K. data centres |
| Modine Manufacturing Company (Airedale) | Cooling equipment manufacturer | Airedale chillers and air handlers made in Leeds and Bradford |
| Hewlett Packard Enterprise (HPE) | IT systems supplier | Servers and modular pods, including the Isambard-AI system in Bristol |
Power access and delivery record decide who wins work
Credence Research's view is that access to firm power and a proven delivery record now decide who captures U.K. data centre construction work. Campuses with confirmed connections near the M25 will keep most spending through 2028, but the largest new halls after that will be built in the North East, Lanarkshire and other sites with spare grid or private-wire power. Buyers should test contractor balance sheets after the ISG failure and secure long-lead electrical equipment early. Contractors and equipment makers that can deliver liquid-cooled halls with their own power are best placed.
Estimates rebuilt from capacity, cost and pipeline data
The report uses 2025 as the base year and forecasts U.K. data centre build and fit-out spending for 2026 to 2035. Market values come from the Credence Research model, which multiplies capacity delivered and under construction by build costs per watt, adds IT equipment installed in new halls and refits, and checks the result against pipeline and power data. This edition replaces an earlier estimate with a 2024 base year. Segment and regional splits are Credence Research estimates built from the same inputs. Sources include ONS, Ofgem, government releases, property adviser reports, company releases and news reports, and no interviews or surveys were conducted.
Spending roughly triples as campuses move beyond London
Build and fit-out spending in the U.K. should rise from USD 16.11 billion in 2026 to USD 44.32 billion by 2035, as cloud regions, AI compute programs and colocation campuses add capacity across the country. IT equipment will remain the largest cost item, but power and cooling plant should gain share as liquid cooling becomes standard in AI halls. New building will spread from the M25 corridor to the North East, Lanarkshire and the Midlands, where power can be secured. Slow grid connections, high electricity prices and contractor failures remain the main risks and would keep growth near the downside case.
How wide is the range of outcomes to 2035?
The outcome depends mainly on whether grid connections arrive on the dates developers have been given. Faster connection reform and quick use of the new nationally significant consent route would push growth toward the upside. Repeated withdrawals like the Loughton case, or another major contractor failure, would hold spending near the downside case. Electricity prices also matter, because they decide whether AI training halls are built in the U.K. or elsewhere in Europe.
| Scenario | CAGR, 2026–2035 | Value, 2035 | What has to hold |
|---|---|---|---|
| Downside | 9.4% | USD 36.17 billion | Grid dates slip past 2030 for large campuses and AI tenants delay commitments |
| Base | 11.90% | USD 44.32 billion | Committed London and northern campuses reach construction close to announced dates |
| Upside | 13.9% | USD 51.98 billion | Connection reform and AI Growth Zones bring several 500 MW sites forward |
Frequently Asked Questions
How big is the U.K. data centre construction market?
Which companies build data centres in the U.K.?
How much does it cost to build a data centre in London?
How is a large U.K. data centre built?
Which U.K. contractors have delivered data centres on schedule?
How much data centre capacity does the U.K. have?
Which region of the U.K. leads data centre construction?
What is slowing data centre construction in the U.K.?
Table of Content
Chapter 1 Market Segmentation
- 1.1 Segmentation Framework
- 1.1.1 Product and Service Classification
- 1.1.2 Application and End-Use Classification
- 1.1.3 Technology and Solution Classification
- 1.1.4 Customer and Distribution Channel Classification
- 1.1.5 Geographic Segmentation
- 1.1.6 Market Segment Definitions and Boundaries
- 1.2 By Type
- 1.2.1 Tier 1
- 1.2.2 Tier 2
- 1.2.3 Tier 3
- 1.2.4 Tier 4
- 1.3 By Infrastructure
- 1.3.1 IT Infrastructure
- 1.3.2 Power Distribution & Cooling Infrastructure
- 1.3.3 General Construction & Other Infrastructure
- 1.4 By Vertical
- 1.4.1 IT & Telecom
- 1.4.2 BFSI
- 1.4.3 Government & Defense
- 1.4.4 Healthcare
- 1.4.5 Energy
- 1.4.6 Others
Chapter 2 Introduction
- 2.1 Report Objectives and Scope
- 2.2 Product Definition and Industry Terminology
- 2.3 Market Inclusions and Exclusions
- 2.4 Research Process
- 2.4.1 Primary Research and Expert Interviews
- 2.4.2 Secondary Research and Source Review
- 2.4.3 Top-Down and Bottom-Up Estimation
- 2.4.4 Data Triangulation and Verification
- 2.5 Market Size Measurement Basis
- 2.5.1 2025: USD 14.40 billion → 2035: USD 44.32 billion
- 2.6 Historical and Forecast Reference Periods
- 2.6.1 Historical Period: 2018-2025
- 2.6.2 Base Year: 2025
- 2.6.3 Forecast Period: 2025-2035
- 2.7 Research Assumptions and Limitations
Chapter 3 Executive Summary
- 3.1 Market Snapshot and Key Findings
- 3.2 Base-Year Market Size, 2025
- 3.3 Forecast Market Size, 2035
- 3.4 Revenue and Volume Growth Outlook
- 3.5 Key Demand and Supply Indicators
- 3.6 Leading Market Segments
- 3.7 Fastest-Growing Market Opportunities
- 3.8 Regional Performance Highlights
- 3.9 Technology and Industry Transformation
- 3.10 Competitive Landscape Summary
- 3.11 Analyst View and Strategic Implications
Chapter 4 UK Data Centre Construction Market Trends and Developments
- 4.1 Historical Industry Development, 2018-2025
- 4.2 Recent Market Trends and Developments
- 4.3 Demand and Customer Behavior Trends
- 4.4 Technology and Product Innovation
- 4.5 Artificial Intelligence, Automation and Digitalization
- 4.6 Local Manufacturing and Supply Chain Realignment
- 4.7 Industry Partnerships, Mergers and Acquisitions
- 4.8 Sustainability and Circular Economy Developments
- 4.9 Government and Private Sector Investment Trends
- 4.10 Emerging Business Models and Commercialization
- 4.11 Industry Developments and Announcements
Chapter 5 UK Data Centre Construction Market Production, Supply and Demand Analysis
- 5.1 Demand Trend and Consumption Analysis, 2018-2025
- 5.2 Demand Forecast, 2025-2035
- 5.3 Production and Output Trend, 2018-2025
- 5.4 Production and Output Forecast, 2025-2035
- 5.5 Installed Capacity and Capacity Utilization
- 5.6 Company-Wise Production Plants and Statistics
- 5.6.1 Installed Production Capacity
- 5.6.2 Actual Production
- 5.6.3 Planned Capacity and Expansion Targets
- 5.7 Supply Chain Structure and Procurement Trends
- 5.8 Supply-Demand Gap and Bottlenecks
- 5.9 Import Dependence and Sourcing Structure
- 5.10 Contract Manufacturing and Outsourcing
- 5.11 Regional Supply and Demand Concentration
Chapter 6 UK Data Centre Construction Market Pricing Analysis
- 6.1 Pricing Structure and Measurement
- 6.2 Historical Pricing Trends, 2018-2025
- 6.3 Pricing Outlook, 2025-2035
- 6.4 Average Selling Price and Unit Economics
- 6.5 Pricing by Product and Market Segment
- 6.6 Geographic Pricing Differences
- 6.7 Key Input, Energy, Labor and Logistics Costs
- 6.8 Contract Pricing and Purchasing Models
- 6.9 Pricing Sensitivity and Competitive Positioning
- 6.10 Price, Margin and Profitability Implications
Chapter 7 UK Data Centre Construction Market Dynamics
- 7.1 Market Growth Drivers
- 7.1.1 Demand-Side Drivers
- 7.1.2 Technology and Innovation Drivers
- 7.1.3 Infrastructure and Investment Drivers
- 7.1.4 Regulatory and Policy Drivers
- 7.2 Market Restraints
- 7.2.1 Cost and Affordability Constraints
- 7.2.2 Technology and Adoption Barriers
- 7.2.3 Supply Chain and Operational Constraints
- 7.3 Market Challenges
- 7.3.1 Competitive Pressure and Margin Erosion
- 7.3.2 Skills, Infrastructure and Implementation Gaps
- 7.4 Emerging Market Opportunities
- 7.5 Market Dynamics Impact and Time-Horizon Assessment
Chapter 8 UK Data Centre Construction Value Chain Analysis
- 8.1 Industry Value Chain Overview
- 8.2 Upstream Suppliers and Critical Inputs
- 8.3 Technology and Component Providers
- 8.4 Manufacturing or Service Delivery
- 8.5 Distribution, Channel Partners and Integrators
- 8.6 Downstream Applications and End Users
- 8.7 Value Addition and Profit Pools
- 8.8 Vertical Integration and Outsourcing
- 8.9 Supplier Concentration and Risk
- 8.10 Supply Chain Localization and Resilience
Chapter 9 UK Data Centre Construction Market Regulations and Policies
- 9.1 Relevant Laws, Standards and Compliance Frameworks
- 9.2 Product, Service, Safety and Quality Requirements
- 9.3 Government Policies, Incentives and Subsidies
- 9.4 Imports, Exports and Trade Barriers
- 9.5 Public Procurement and Local Content Requirements
- 9.6 Environmental and Sustainability Compliance
- 9.7 Data Protection, AI and Cybersecurity Compliance
- 9.8 Upcoming Policy Changes and Market Implications
Chapter 10 UK Data Centre Construction Market Hotspots and Opportunities
- 10.1 Market Opportunity Mapping and Growth Hotspots
- 10.2 High-Growth Applications and Customer Groups
- 10.3 Underserved Markets and White-Space Opportunities
- 10.4 Emerging Technology and Product Opportunities
- 10.5 New Capacity and Investment Hotspots
- 10.6 Market Entry and Expansion Opportunities
- 10.7 Distribution and Partnership Opportunities
- 10.8 Near-Term and Long-Term Commercial Potential
- 10.9 Opportunity Attractiveness and Execution Risks
Chapter 11 UK Data Centre Construction Market Outlook, 2025-2035
- 11.1 Market Size and Analysis
- 11.1.1 Revenue (Market Measurement: 2025: USD 14.40 billion → 2035: USD 44.32 billion)
- 11.1.2 Market Volume and Quantity Sold
- 11.1.3 Historical Market Size, 2018-2025
- 11.1.4 Base-Year Market Size, 2025
- 11.2 Market Forecast, 2025-2035
- 11.2.1 Revenue Forecast to 2035
- 11.2.2 Volume Forecast to 2035
- 11.2.3 CAGR and Year-on-Year Growth
- 11.2.4 Incremental Revenue Opportunity
- 11.3 Forecast Assumptions and Scenario Analysis
- 11.3.1 Base-Case Forecast
- 11.3.2 Optimistic and Conservative Scenarios
- 11.3.3 Technology, Pricing and Policy Sensitivities
- 11.4 Market Attractiveness and Growth Outlook
Chapter 12 UK Data Centre Construction Market Segmentation and Outlook
- 12.1 Segmentation Summary and Market Shares, 2025
- 12.2 Largest and Fastest-Growing Segments
- 12.3 By Type - Market Size and Forecast, 2025-2035
- 12.3.1 Segment Definition and Scope
- 12.3.2 Historical Market Size, 2018-2025
- 12.3.3 Revenue Forecast, 2025-2035
- 12.3.4 Volume Forecast, 2025-2035
- 12.3.5 Base-Year Market Share, 2025
- 12.3.6 Segment CAGR and Growth Drivers
- 12.3.7 Subsegment Market Size and Forecast
- 12.3.7.1 Tier 1
- 12.3.7.2 Tier 2
- 12.3.7.3 Tier 3
- 12.3.7.4 Tier 4
- 12.3.8 Subsegment Pricing and Adoption Trends
- 12.3.9 Leading Suppliers and Competition
- 12.3.10 Regional Demand and Opportunities
- 12.4 By Infrastructure - Market Size and Forecast, 2025-2035
- 12.4.1 Segment Definition and Scope
- 12.4.2 Historical Market Size, 2018-2025
- 12.4.3 Revenue Forecast, 2025-2035
- 12.4.4 Volume Forecast, 2025-2035
- 12.4.5 Base-Year Market Share, 2025
- 12.4.6 Segment CAGR and Growth Drivers
- 12.4.7 Subsegment Market Size and Forecast
- 12.4.7.1 IT Infrastructure
- 12.4.7.2 Power Distribution & Cooling Infrastructure
- 12.4.7.3 General Construction & Other Infrastructure
- 12.4.8 Subsegment Pricing and Adoption Trends
- 12.4.9 Leading Suppliers and Competition
- 12.4.10 Regional Demand and Opportunities
- 12.5 By Vertical - Market Size and Forecast, 2025-2035
- 12.5.1 Segment Definition and Scope
- 12.5.2 Historical Market Size, 2018-2025
- 12.5.3 Revenue Forecast, 2025-2035
- 12.5.4 Volume Forecast, 2025-2035
- 12.5.5 Base-Year Market Share, 2025
- 12.5.6 Segment CAGR and Growth Drivers
- 12.5.7 Subsegment Market Size and Forecast
- 12.5.7.1 IT & Telecom
- 12.5.7.2 BFSI
- 12.5.7.3 Government & Defense
- 12.5.7.4 Healthcare
- 12.5.7.5 Energy
- 12.5.7.6 Others
- 12.5.8 Subsegment Pricing and Adoption Trends
- 12.5.9 Leading Suppliers and Competition
- 12.5.10 Regional Demand and Opportunities
- 12.6 Segment Growth Comparison
- 12.7 Segment Attractiveness and Priority Matrix
Chapter 13 UK Data Centre Construction End-Use and Application Market Outlook
- 13.1 End-Use Industry and Customer Demand Structure
- 13.2 Leading Applications and Customer Groups
- 13.3 End-Use Market Size, Share and Forecast
- 13.4 Major End-Use Industry Deep Dives
- 13.4.1 Customer Requirements and Use Cases
- 13.4.2 Demand and Replacement Cycles
- 13.4.3 Technical and Regulatory Considerations
- 13.4.4 Purchasing and Procurement Models
- 13.4.5 Leading Vendors and Distribution Channels
- 13.4.6 Forecast and Commercial Opportunities
- 13.5 Emerging Applications and Cross-Segment Demand
- 13.6 End-Use Industry Investment Priorities
Chapter 14 UK Data Centre Construction Geographic Market Outlook, 2025-2035
- 14.1 Domestic Market Distribution and Demand Clusters
- 14.2 State- or Province-Wise Market Size and Forecast, 2025-2035
- 14.3 City and Metropolitan Market Outlook
- 14.4 Industrial, Manufacturing and Commercial Clusters
- 14.5 Geographic Concentration of Key End Users
- 14.6 Local Pricing and Purchasing Differences
- 14.7 Domestic Production Facilities and Capacity Map
- 14.8 Local Infrastructure and Project Pipeline
- 14.9 State-Level Policy and Incentive Differences
- 14.10 Subnational Investment Hotspots and Opportunities
- 14.11 Distribution and Logistics Networks
- 14.12 Domestic Competitive Footprint
Chapter 15 UK Data Centre Construction Technology, Innovation and Sustainability Outlook
- 15.1 Technology Landscape and Maturity
- 15.2 Product, Process and Service Innovation
- 15.3 AI, Automation and Digital Tools in the Industry
- 15.4 Technology Adoption and Performance Benchmarking
- 15.5 Innovation Pipeline and R&D Investment
- 15.6 Patent and Intellectual Property Trends
- 15.7 Energy Efficiency and Resource Management
- 15.8 Sustainability, Recycling and Circularity
- 15.9 Technology Roadmap, 2025-2035
- 15.10 Risks of Obsolescence and Technology Substitution
Chapter 16 UK Data Centre Construction Market Key Strategic Imperatives
- 16.1 Growth and Market Entry Priorities
- 16.2 High-Return Products and Segments
- 16.3 Pricing, Profitability and Cost Optimization
- 16.4 Technology Investment and Product Differentiation
- 16.5 Supply Chain Localization and Resilience
- 16.6 Distribution and Customer Acquisition
- 16.7 Partnership, Acquisition and Capacity Strategy
- 16.8 Regional Expansion Priorities
- 16.9 Short-, Medium- and Long-Term Actions
Chapter 17 Competition Outlook
- 17.1 Industry Competition Characteristics
- 17.2 Market Structure and Concentration
- 17.3 Market Share and Competitive Positioning, 2025
- 17.4 Company-Wise Revenue and Product Benchmarking
- 17.5 Production and Service Capacity Benchmarking
- 17.6 Technology, Pricing and Differentiation
- 17.7 Regional Footprint and Distribution Strength
- 17.8 Mergers, Acquisitions and Strategic Alliances
- 17.9 New Entrants and Competitive Threats
- 17.10 Porter's Five Forces and Industry Attractiveness
- 17.11 Competitive Outlook, 2025-2035
Chapter 18 Company Profiles
- 18.1 Company Coverage and Selection Criteria
- 18.2 Mace Group
- 18.2.1 Business Description
- 18.2.2 Company Ownership and Geographic Presence
- 18.2.3 Product and Service Portfolio
- 18.2.4 Manufacturing and Operating Footprint
- 18.2.5 Production Capacity and Expansion Plans
- 18.2.6 Financial Performance and Investment
- 18.2.7 Market Share and Competitive Position
- 18.2.8 Technology and Innovation Capabilities
- 18.2.9 Strategic Alliances or Partnerships
- 18.2.10 Recent Developments
- 18.2.11 Growth Strategy and Outlook
- 18.3 McLaren Construction Group
- 18.4 Mercury Engineering
- 18.5 Hochtief AG
- 18.6 AECOM
- 18.7 Arup Group
- 18.8 Schneider Electric SE
- 18.9 Johnson Controls International PLC
- 18.10 Modine Manufacturing Company (Airedale)
- 18.11 Hewlett Packard Enterprise (HPE)
- 18.12 Other Relevant Market Participants
Note: Every listed company is profiled on the structure shown under the first company. The company list is preliminary and may change based on research findings, market developments, data availability and client requirements.
Chapter 19 Disclaimer
- 19.1 Research and Forecast Disclaimer
- 19.2 Data Source and Estimation Limitations
Note: The depth of individual sections depends on data availability for this market. Volume, capacity, trade and other unit-based metrics are included where applicable.

