
Market overview
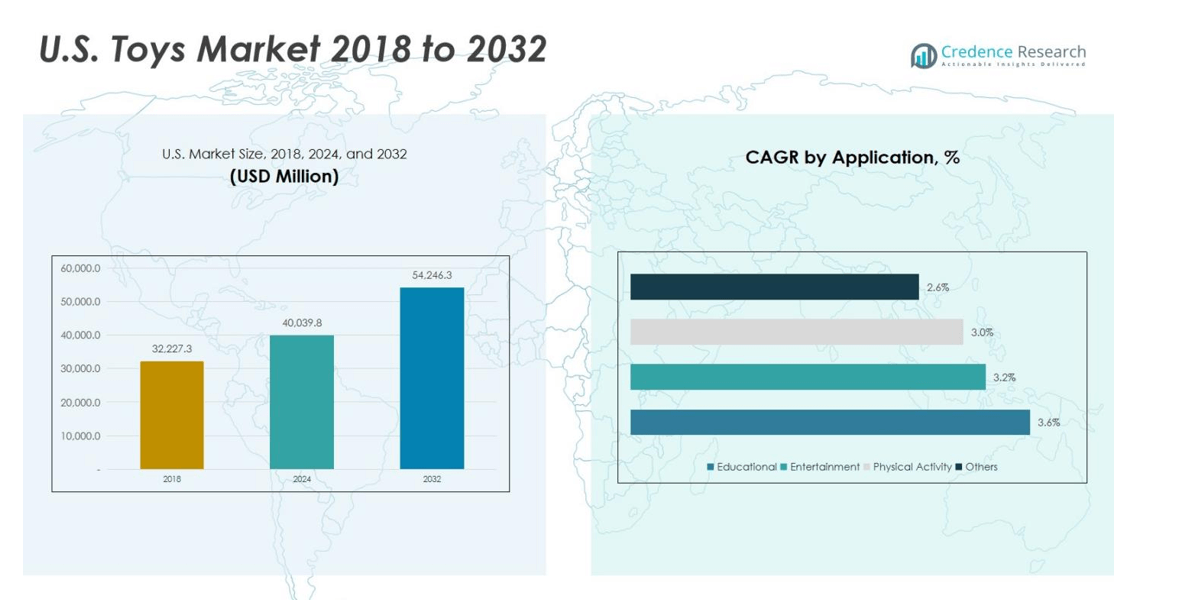
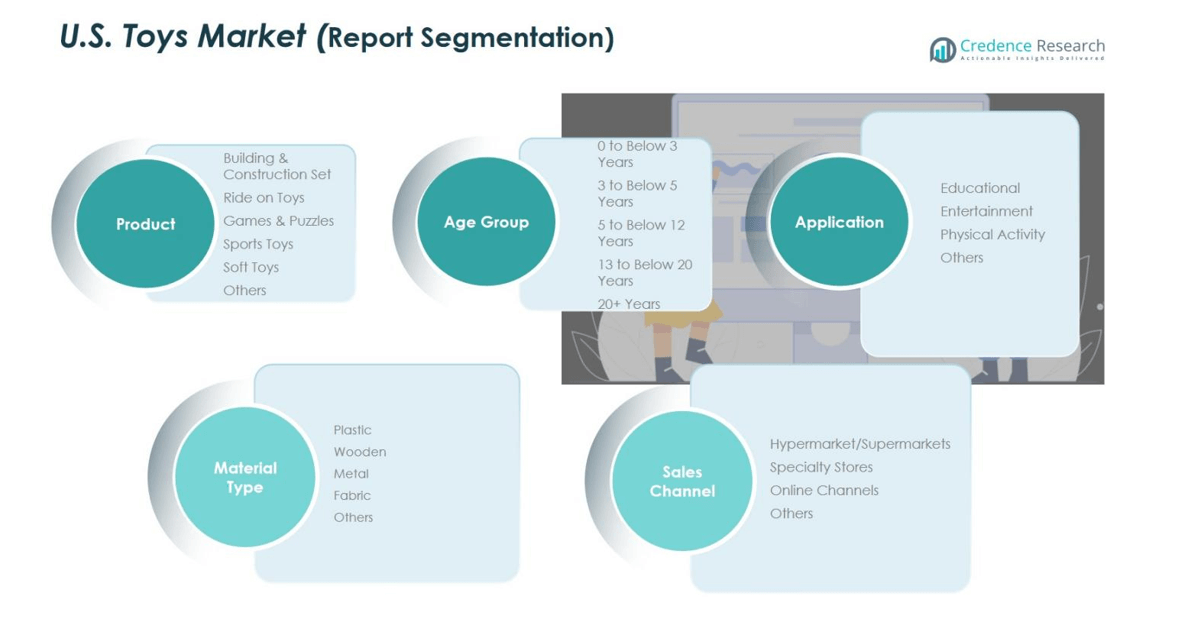
U.S. Toys Market size was valued at USD 32,227.3 Million in 2018, increased to USD 40,039.8 Million in 2024, and is anticipated to reach USD 54,246.3 Million by 2032, at a CAGR of 3.89% during the forecast period.
| REPORT ATTRIBUTE | DETAILS |
|---|---|
| Historical Period | 2020-2023 |
| Base Year | 2024 |
| Forecast Period | 2025-2032 |
| U.S. Toy Market Size 2024 | USD 40,039.8 Million |
| U.S. Toy Market, CAGR | 3.89% |
| U.S. Toy Market Size 2032 | USD 54,246.3 Million |
The U.S. Toys Market is shaped by prominent players such as Mattel Inc., Hasbro Inc., LEGO Group, JAKKS Pacific Inc., Bandai Namco, and Funko Inc., each strengthening their presence through licensed merchandise, digital-interactive toys, and continuous product innovation. These companies leverage strong brand recognition and extensive retail partnerships to maintain wide market reach. Regionally, the South region leads the U.S. Toys Market with a 34.2% share, driven by its large population base, high consumer spending, and rapid expansion of online and offline retail channels. Strong demand for entertainment merchandise, outdoor toys, and character-based products further reinforces the South’s dominant position.
Market Insights
- The U.S. Toys Market reached USD 40,039.8 million in 2024 and is projected to grow to USD 54,246.3 million by 2032 at a CAGR of 3.89%, supported by stable demand across key product categories.
- Strong market drivers include rising adoption of STEM-based toys, expanding licensed merchandise, and increased e-commerce penetration that improves accessibility and product variety for consumers nationwide.
- Key trends highlight growing interest in tech-enabled smart toys, sustainable materials, and collectible product lines, while the Games & Puzzles segment leads with a 4% share driven by cognitive-learning demand.
- Major players such as Mattel, Hasbro, LEGO, JAKKS Pacific, Bandai Namco, and Funko strengthen market value through innovation, franchise partnerships, and omnichannel retail strategies.
- Regional analysis shows the South region leading with 34.2%, followed by the Northeast at 23.6%, Midwest at 21.4%, and West at 20.8%, reflecting diverse consumer preferences and strong retail networks across the country.
Market Segmentation Analysis:
By Product
The U.S. Toys Market by product is led by Games & Puzzles, which accounted for 28.4% share in 2024, driven by rising demand for cognitive development toys and strong consumer preference for board games, strategy games, and licensed puzzles. Building & Construction Sets hold a significant share as STEM-focused play continues to expand. Ride-on Toys and Sports Toys benefit from increased emphasis on physical engagement, while Soft Toys retain steady demand across younger age groups. Other toy categories also contribute to market expansion through innovative designs, collectible themes, and character-driven product launches.
- For instance, Ride-on Toys are benefiting from innovations such as battery-powered electric models with Bluetooth connectivity, as seen in Fisher-Price’s latest ride-on lineup, which emphasizes active play and safety.
By Age Group
In the U.S. Toys Market, the 5 to Below 11 Years group dominated with 36.7% share in 2024, supported by high demand for educational kits, construction sets, board games, and digital-interactive toys. This segment benefits from increased parental spending on cognitive skill development and enrichment-based play. The 0 to Below 3 Years group follows with strong uptake of soft toys and sensory products, while the 3 to Below 5 Years category grows with preschool learning aids. Pre-teen and adult segments also contribute through collectibles, hobby kits, and licensed franchise-driven purchases.
- For instance, leading retailers and reviewers consistently highlight products such as Fisher‑Price interactive playmats and Bright Starts light‑up sensory spinners as top-rated infant toys that support early motor, visual, and auditory skills for babies under 2 years.
By Application
The U.S. Toys Market by application is dominated by the Entertainment segment, which captured 52.1% share in 2024 due to strong consumer preference for character-based toys, interactive game sets, and franchise merchandise. Entertainment-focused products remain central to overall toy spending, supported by movie tie-ins, digital gaming influence, and collectible culture. Educational toys continue to expand with rising demand for STEM kits and early-learning products, while Physical Activity toys gain traction through outdoor play items and sports sets. Other applications add value through novelty items, fidget toys, and themed lifestyle toys.
Key Growth Drivers
Rising Demand for Educational and STEM-Based Toys
The U.S. Toys Market experiences strong growth driven by the increasing adoption of educational and STEM-focused toys that support cognitive development and skill-building. Parents actively prioritize learning-based play to enhance problem-solving, creativity, and early literacy, leading to rising demand for construction sets, coding kits, and science models. Schools and learning centers also integrate STEM toys into structured programs, further reinforcing market expansion. Continuous innovation, coupled with the integration of interactive components and age-specific learning modules, strengthens this segment’s long-term growth outlook across diverse consumer groups.
- For instance, schools and learning centers increasingly use STEM toys like Sphero robots and Thames & Kosmos science kits within structured programs to enhance problem-solving and creativity in students.
Expansion of Licensed and Franchise-Based Toy Lines
Licensed toys remain a powerful driver of U.S. market growth, supported by blockbuster movies, streaming content, gaming franchises, and global entertainment characters. Toy manufacturers benefit significantly from the strong influence of media-driven storytelling, which boosts demand for action figures, collectibles, and themed merchandise. Frequent releases from major studios sustain product refresh cycles throughout the year, encouraging repeat purchases. Collaborations between toy brands and digital platforms further accelerate the appeal of character-centric products, contributing to stable revenue streams and heightened brand engagement across multiple consumer demographics.
- For instance, Mattel’s renewed multi‑year global licensing agreement with Disney for Disney Princess and Frozen gives it continuing rights to develop fashion dolls and figures tied to upcoming content such as Frozen 3, ensuring a pipeline of refreshed character toys aligned with major releases.
Growing Popularity of E-Commerce and Omnichannel Retailing
The rise of e-commerce and omnichannel strategies significantly boosts the U.S. Toys Market by enhancing accessibility, product visibility, and consumer convenience. Online platforms offer extensive product selections, competitive pricing, and personalized recommendations that drive purchasing decisions across all age groups. Retailers increasingly adopt hybrid models that integrate digital browsing with in-store pickups, creating seamless shopping experiences. Seasonal promotions, influencer-driven marketing, and subscription-based toy boxes elevate demand further. Enhanced logistics networks and rapid delivery infrastructure continue supporting strong online sales momentum within the U.S. market.
Key Trends & Opportunities
Integration of Smart and Interactive Technology in Toys
A major trend shaping the U.S. Toys Market is the rapid integration of technology, including AI-enabled toys, app-connected devices, augmented reality features, and interactive learning systems. Parents and children increasingly prefer toys that combine entertainment with digital engagement, fostering immersive learning and advanced play experiences. Companies are leveraging sensors, voice interaction, and educational analytics to differentiate offerings and expand product portfolios. This trend opens significant growth opportunities for innovative startups and leading brands focused on blending physical play with digital capabilities, particularly within gaming and STEM categories.
- For instance, WowWee has developed the Dog-E robot dog, an app-connected toy that uses sensors and AI to mimic real dog behaviors, including movement, sounds, and interactive play.
Rising Demand for Sustainable and Eco-Friendly Toy Materials
Sustainability presents a strong opportunity as U.S. consumers actively seek toys made from recycled plastics, organic fabrics, biodegradable materials, and sustainably sourced wood. Environmentally conscious purchasing increases across both premium and mass-market segments, driven by growing awareness of product safety and environmental impact. Manufacturers respond by redesigning packaging, adopting green production techniques, and introducing eco-certified toy lines. Retailers also prioritize eco-friendly assortments, expanding shelf space for sustainable categories. This shift positions environmentally responsible brands for accelerated growth and long-term competitive differentiation.
- For instance, Melissa & Doug is the first global toy brand to be 100% carbon neutral in its own operations. It ensures 100% of paper products and over half of its wood products are FSC-certified, with plans to reach 95% curbside recyclable packaging by 2025.
Key Challenges
Stringent Safety Regulations and Compliance Requirements
The U.S. Toys Market faces significant challenges due to strict safety regulations, testing protocols, and compliance mandates that manufacturers must follow before product commercialization. Requirements related to choking hazards, chemical composition, material quality, and labeling increase production complexity and compliance costs. Smaller manufacturers struggle to manage certification expenses and documentation, which can delay product launches. Regulatory updates also demand continuous process adjustments, adding operational burden. While essential for consumer protection, these standards require consistent investment in quality control and manufacturing precision across the supply chain.
Intensifying Competition and Pricing Pressure
The U.S. Toys Market undergoes rising competitive pressure as global brands, local manufacturers, and digital-native companies compete for market share. The presence of low-cost imports heightens price sensitivity, forcing established players to balance innovation with cost efficiency. Frequent discounting across e-commerce platforms compresses margins, making profitability more challenging during off-season periods. Rapid product turnover and short-lived trends further complicate inventory management. To remain competitive, manufacturers must invest in product differentiation, licensing agreements, and technology-driven enhancements while navigating increasingly constrained pricing environments.
Regional Analysis
Northeast Region
The Northeast region holds 23.6% share of the U.S. Toys Market, supported by strong consumer spending, high urban concentration, and a well-developed specialty retail landscape. States such as New York, Massachusetts, and New Jersey drive demand through a mix of premium educational toys, STEM kits, licensed collectibles, and early-learning products. The region benefits from affluent households and strong adoption of eco-friendly and tech-enabled toys. Online retail penetration remains high, further boosting category diversity and accessibility. Seasonal purchases surge during major holidays, reinforcing the Northeast as a key revenue-generating market.
Midwest Region
The Midwest accounts for 21.4% share of the U.S. Toys Market, driven by strong household participation in traditional play categories such as sports toys, construction sets, outdoor toys, and board games. Family-centric lifestyles and high demand for learning-oriented toys contribute to steady growth across states like Illinois, Ohio, and Michigan. Retail chains and hypermarkets remain key distribution channels in the region, supported by expanding e-commerce penetration. Manufacturers benefit from stable consumer loyalty toward value-driven products, while rising interest in STEM and educational play continues to strengthen market performance across Midwestern households.
South Region
The South region leads the U.S. Toys Market with 34.2% share, supported by its large population base, rising disposable incomes, and strong retail expansion across states including Texas, Florida, and Georgia. Demand remains robust for outdoor toys, ride-on models, entertainment merchandise, and character-based products driven by media influence. The region shows rapid e-commerce growth, with consumers actively purchasing toys through online channels during seasonal and promotional events. Growing urbanization and demographic diversity further boost consumption patterns, making the South the most dominant and fastest-expanding regional market within the United States.
West Region
The West holds 20.8% share of the U.S. Toys Market, shaped by strong preference for innovative, tech-enabled, and eco-friendly toy categories. States such as California, Washington, and Colorado drive high demand for smart toys, interactive gaming sets, sustainable materials, and collectibles linked to entertainment franchises. The region benefits from a strong concentration of tech-savvy consumers and high adoption of premium, design-driven products. Online marketplaces dominate distribution, supported by rapid fulfillment infrastructure. The West also experiences strong year-round demand from tourism and theme-park-linked merchandise, further strengthening regional market performance.
Market Segmentations:
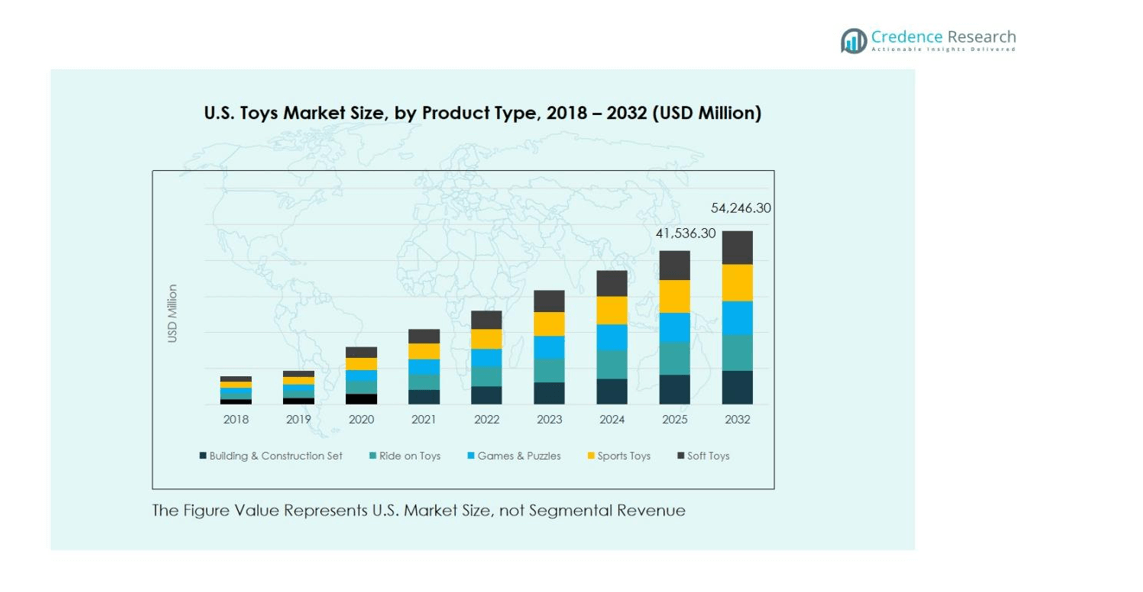
By Product
- Building & Construction Set
- Ride-on Toys
- Games & Puzzles
- Sports Toys
- Soft Toys
- Others
By Age Group
- 0 to Below 3 Years
- 3 to Below 5 Years
- 5 to Below 11 Years
- 12 to Below 20 Years
- 20+ Years
By Application
- Educational
- Entertainment
- Physical Activity
- Others
By Material Type
- Plastic
- Wooden
- Metal
- Fabric
- Others
By Sales Channel
- Hypermarkets / Supermarkets
- Specialty Stores
- Online Channels
- Others
By Geography
- Northeast Region
- Midwest Region
- South Region
- West Region
Competitive Landscape
Competitive landscape in the U.S. Toys Market is defined by leading players such as Mattel Inc., Hasbro Inc., LEGO Group, JAKKS Pacific Inc., Bandai Namco, Funko Inc., and Clementoni S.p.A., each competing through innovation, licensing partnerships, and diversified product portfolios. The market exhibits strong competition driven by rapid product refresh cycles, franchise-based merchandise, and technology-integrated toys that appeal to digitally engaged consumers. Companies invest heavily in character licensing agreements with major entertainment studios to strengthen brand presence and capture demand surges linked to movie releases and streaming content. Sustainability-focused product development, expansion of STEM and educational toy lines, and growing omnichannel retail strategies further shape the competitive environment. E-commerce platforms intensify rivalry by fostering price transparency and accelerating product comparison, compelling manufacturers to differentiate through quality, safety compliance, and interactive features. Smaller niche brands also gain traction by targeting eco-friendly, sensory, and artisanal toy categories, contributing to a dynamic and evolving competitive landscape.
Key Player Analysis
- JAKKS Pacific Inc.
- Mattel Inc.
- Funko Inc.
- Hasbro Inc.
- LEGO Group
- Bandai Namco
- ROYBI
- Sphero
- Clementoni S.p.A.
- Other Key Players
Recent Developments
- In November 2025, Mattel Inc. announced the launch of the UNO Elite™ Formula 1® 2025 Core Edition Starter Pack and Booster Set featuring licensed elements from the Formula 1® teams.
- In March 2025, Bandai Namco Toys & Collectibles America Inc. announced a four-year partnership with Angel City FC, launching a limited-edition co-branded Tamagotchi device available March 16.
- In September 2025, Hasbro Inc. and Disney Consumer Products announced a multi-year, multi-property collaboration to bring licensed PLAY-DOH products under Disney brands to market.
Report Coverage
The research report offers an in-depth analysis based on Product, Age group, Application, Material Type, Sales Channel and Geography. It details leading market players, providing an overview of their business, product offerings, investments, revenue streams, and key applications. Additionally, the report includes insights into the competitive environment, SWOT analysis, current market trends, as well as the primary drivers and constraints. Furthermore, it discusses various factors that have driven market expansion in recent years. The report also explores market dynamics, regulatory scenarios, and technological advancements that are shaping the industry. It assesses the impact of external factors and global economic changes on market growth. Lastly, it provides strategic recommendations for new entrants and established companies to navigate the complexities of the market.
Future Outlook
- The U.S. Toys Market will see continued growth driven by rising demand for educational and STEM-focused products.
- Digital integration in toys will expand as smart, app-connected, and interactive solutions gain stronger consumer acceptance.
- Licensed and franchise-based toys will remain major revenue drivers as entertainment content releases increase.
- Eco-friendly and sustainably produced toys will experience rapid adoption as consumer preference shifts toward green materials.
- E-commerce will further strengthen its position as a primary distribution channel supported by fast delivery and broader assortment.
- Collectibles and hobby-based toys will grow as adult consumers increasingly engage in nostalgia-driven purchases.
- Physical activity and outdoor play categories will expand as parents prioritize active and healthy play.
- Manufacturers will invest more in personalization and limited-edition product lines to enhance brand differentiation.
- Retailers will adopt omnichannel strategies to improve customer experience and inventory efficiency.
- Compliance with safety standards will remain a priority, encouraging companies to enhance quality control and testing.

Request a Free Sample
Fill in your details and we'll send you a free sample report.
- Sample data tables & charts
- Research methodology
Market Dynamics
Adoption of Educational and STEM-Based Toys
Parents and educational institutions are increasingly prioritizing toys that promote cognitive development, problem-solving, and STEM skills, driving demand for construction sets, coding kits, and science models. This focus on learning-based play supports long-term market growth as consumers seek products that combine fun with educational value.
Expansion of Licensed and Franchise-Based Toy Lines
The popularity of toys tied to blockbuster movies, streaming content, and gaming franchises fuels consistent demand for character-based merchandise, collectibles, and themed playsets. Frequent content releases and collaborations with entertainment studios ensure a steady pipeline of new products and repeat purchases.
Growth of E-Commerce and Omnichannel Retailing
Online platforms and hybrid retail models have made toys more accessible, offering broader assortments, competitive pricing, and convenient delivery options. The rise of e-commerce, combined with in-store experiences, enhances consumer reach and supports robust sales growth across all age groups.
Integration of Smart and Interactive Technology
The incorporation of AI, app connectivity, and interactive features into toys is attracting tech-savvy consumers and parents seeking engaging, immersive play experiences. This trend is particularly strong in gaming and STEM categories, where digital integration differentiates products and expands market opportunities.
Rising Demand for Sustainable and Eco-Friendly Toys
Growing consumer awareness of environmental impact is driving demand for toys made from recycled, organic, and biodegradable materials. Manufacturers responding with eco-friendly product lines and sustainable packaging are capturing market share among environmentally conscious families.
Need a Custom Version of This Report?
Tailor the scope, geography, or segments to your exact requirements.
- Custom geography or segment scope
- Direct access to our analyst team
Frequently Asked Questions
What is the current market size for U.S. Toy Market, and what is its projected size in 2032?
At what Compound Annual Growth Rate is the U.S. Toy Market projected to grow between 2025 and 2032?
Which U.S. Toy Market segment held the largest share in 2024?
What are the primary factors fueling the growth of the U.S. Toy Market?
Who are the leading companies in the U.S. Toy Market?
Which region commanded the largest share of the U.S. Toy Market in 2024?
Table of Content
Chapter 1 Market Segmentation
- 1.1 Segmentation Framework
- 1.1.1 Product and Service Classification
- 1.1.2 Application and End-Use Classification
- 1.1.3 Technology and Solution Classification
- 1.1.4 Customer and Distribution Channel Classification
- 1.1.5 Geographic Segmentation
- 1.1.6 Market Segment Definitions and Boundaries
- 1.2 By Product
- 1.2.1 Building & Construction Set
- 1.2.2 Ride-on Toys
- 1.2.3 Games & Puzzles
- 1.2.4 Sports Toys
- 1.2.5 Soft Toys
- 1.2.6 Others
- 1.3 By Age Group
- 1.3.1 0 to Below 3 Years
- 1.3.2 3 to Below 5 Years
- 1.3.3 5 to Below 11 Years
- 1.3.4 12 to Below 20 Years
- 1.3.5 20+ Years
- 1.4 By Application
- 1.4.1 Educational
- 1.4.2 Entertainment
- 1.4.3 Physical Activity
- 1.4.4 Others
- 1.5 By Sales Channel
- 1.5.1 Hypermarkets / Supermarkets
- 1.5.2 Specialty Stores
- 1.5.3 Online Channels
- 1.5.4 Others
Chapter 2 Introduction
- 2.1 Report Objectives and Scope
- 2.2 Product Definition and Industry Terminology
- 2.3 Market Inclusions and Exclusions
- 2.4 Research Process
- 2.4.1 Primary Research and Expert Interviews
- 2.4.2 Secondary Research and Source Review
- 2.4.3 Top-Down and Bottom-Up Estimation
- 2.4.4 Data Triangulation and Verification
- 2.5 Market Size Measurement Basis
- 2.5.1 2024: USD 40,039.8 Million → 2032: USD 54,246.3 Million
- 2.6 Historical and Forecast Reference Periods
- 2.6.1 Base Year: 2024
- 2.6.2 Forecast Period: 2024-2032
- 2.7 Research Assumptions and Limitations
Chapter 3 Executive Summary
- 3.1 Market Snapshot and Key Findings
- 3.2 Base-Year Market Size, 2024
- 3.3 Forecast Market Size, 2032
- 3.4 Revenue and Volume Growth Outlook
- 3.5 Key Demand and Supply Indicators
- 3.6 Leading Market Segments
- 3.7 Fastest-Growing Market Opportunities
- 3.8 Regional Performance Highlights
- 3.9 Technology and Industry Transformation
- 3.10 Competitive Landscape Summary
- 3.11 Analyst View and Strategic Implications
Chapter 4 U.S. Toy Market Trends and Developments
- 4.1 Historical Industry Development
- 4.2 Recent Market Trends and Developments
- 4.3 Demand and Customer Behavior Trends
- 4.4 Technology and Product Innovation
- 4.5 Artificial Intelligence, Automation and Digitalization
- 4.6 Local Manufacturing and Supply Chain Realignment
- 4.7 Industry Partnerships, Mergers and Acquisitions
- 4.8 Sustainability and Circular Economy Developments
- 4.9 Government and Private Sector Investment Trends
- 4.10 Emerging Business Models and Commercialization
- 4.11 Industry Developments and Announcements
Chapter 5 U.S. Toy Market Production, Supply and Demand Analysis
- 5.1 Demand Trend and Consumption Analysis
- 5.2 Demand Forecast, 2024-2032
- 5.3 Production and Output Trend
- 5.4 Production and Output Forecast, 2024-2032
- 5.5 Installed Capacity and Capacity Utilization
- 5.6 Company-Wise Production Plants and Statistics
- 5.6.1 Installed Production Capacity
- 5.6.2 Actual Production
- 5.6.3 Planned Capacity and Expansion Targets
- 5.7 Supply Chain Structure and Procurement Trends
- 5.8 Supply-Demand Gap and Bottlenecks
- 5.9 Import Dependence and Sourcing Structure
- 5.10 Contract Manufacturing and Outsourcing
- 5.11 Regional Supply and Demand Concentration
Chapter 6 U.S. Toy Market Pricing Analysis
- 6.1 Pricing Structure and Measurement
- 6.2 Historical Pricing Trends
- 6.3 Pricing Outlook, 2024-2032
- 6.4 Average Selling Price and Unit Economics
- 6.5 Pricing by Product and Market Segment
- 6.6 Geographic Pricing Differences
- 6.7 Key Input, Energy, Labor and Logistics Costs
- 6.8 Contract Pricing and Purchasing Models
- 6.9 Pricing Sensitivity and Competitive Positioning
- 6.10 Price, Margin and Profitability Implications
Chapter 7 U.S. Toy Market Dynamics
- 7.1 Market Growth Drivers
- 7.1.1 Demand-Side Drivers
- 7.1.2 Technology and Innovation Drivers
- 7.1.3 Infrastructure and Investment Drivers
- 7.1.4 Regulatory and Policy Drivers
- 7.2 Market Restraints
- 7.2.1 Cost and Affordability Constraints
- 7.2.2 Technology and Adoption Barriers
- 7.2.3 Supply Chain and Operational Constraints
- 7.3 Market Challenges
- 7.3.1 Competitive Pressure and Margin Erosion
- 7.3.2 Skills, Infrastructure and Implementation Gaps
- 7.4 Emerging Market Opportunities
- 7.5 Market Dynamics Impact and Time-Horizon Assessment
Chapter 8 U.S. Toy Value Chain Analysis
- 8.1 Industry Value Chain Overview
- 8.2 Upstream Suppliers and Critical Inputs
- 8.3 Technology and Component Providers
- 8.4 Manufacturing or Service Delivery
- 8.5 Distribution, Channel Partners and Integrators
- 8.6 Downstream Applications and End Users
- 8.7 Value Addition and Profit Pools
- 8.8 Vertical Integration and Outsourcing
- 8.9 Supplier Concentration and Risk
- 8.10 Supply Chain Localization and Resilience
Chapter 9 U.S. Toy Market Regulations and Policies
- 9.1 Relevant Laws, Standards and Compliance Frameworks
- 9.2 Product, Service, Safety and Quality Requirements
- 9.3 Government Policies, Incentives and Subsidies
- 9.4 Imports, Exports and Trade Barriers
- 9.5 Public Procurement and Local Content Requirements
- 9.6 Environmental and Sustainability Compliance
- 9.7 Upcoming Policy Changes and Market Implications
Chapter 10 U.S. Toy Market Hotspots and Opportunities
- 10.1 Market Opportunity Mapping and Growth Hotspots
- 10.2 High-Growth Applications and Customer Groups
- 10.3 Underserved Markets and White-Space Opportunities
- 10.4 Emerging Technology and Product Opportunities
- 10.5 New Capacity and Investment Hotspots
- 10.6 Market Entry and Expansion Opportunities
- 10.7 Distribution and Partnership Opportunities
- 10.8 Near-Term and Long-Term Commercial Potential
- 10.9 Opportunity Attractiveness and Execution Risks
Chapter 11 U.S. Toy Market Outlook, 2024-2032
- 11.1 Market Size and Analysis
- 11.1.1 Revenue (Market Measurement: 2024: USD 40,039.8 Million → 2032: USD 54,246.3 Million)
- 11.1.2 Market Volume and Quantity Sold
- 11.1.3 Historical Market Size
- 11.1.4 Base-Year Market Size, 2024
- 11.2 Market Forecast, 2024-2032
- 11.2.1 Revenue Forecast to 2032
- 11.2.2 Volume Forecast to 2032
- 11.2.3 CAGR and Year-on-Year Growth
- 11.2.4 Incremental Revenue Opportunity
- 11.3 Forecast Assumptions and Scenario Analysis
- 11.3.1 Base-Case Forecast
- 11.3.2 Optimistic and Conservative Scenarios
- 11.3.3 Technology, Pricing and Policy Sensitivities
- 11.4 Market Attractiveness and Growth Outlook
Chapter 12 U.S. Toy Market Segmentation and Outlook
- 12.1 Segmentation Summary and Market Shares, 2024
- 12.2 Largest and Fastest-Growing Segments
- 12.3 By Product - Market Size and Forecast, 2024-2032
- 12.3.1 Segment Definition and Scope
- 12.3.2 Historical Market Size
- 12.3.3 Revenue Forecast, 2024-2032
- 12.3.4 Volume Forecast, 2024-2032
- 12.3.5 Base-Year Market Share, 2024
- 12.3.6 Segment CAGR and Growth Drivers
- 12.3.7 Subsegment Market Size and Forecast
- 12.3.7.1 Building & Construction Set
- 12.3.7.2 Ride-on Toys
- 12.3.7.3 Games & Puzzles
- 12.3.7.4 Sports Toys
- 12.3.7.5 Soft Toys
- 12.3.7.6 Others
- 12.3.8 Subsegment Pricing and Adoption Trends
- 12.3.9 Leading Suppliers and Competition
- 12.3.10 Regional Demand and Opportunities
- 12.4 By Age Group - Market Size and Forecast, 2024-2032
- 12.4.1 Segment Definition and Scope
- 12.4.2 Historical Market Size
- 12.4.3 Revenue Forecast, 2024-2032
- 12.4.4 Volume Forecast, 2024-2032
- 12.4.5 Base-Year Market Share, 2024
- 12.4.6 Segment CAGR and Growth Drivers
- 12.4.7 Subsegment Market Size and Forecast
- 12.4.7.1 0 to Below 3 Years
- 12.4.7.2 3 to Below 5 Years
- 12.4.7.3 5 to Below 11 Years
- 12.4.7.4 12 to Below 20 Years
- 12.4.7.5 20+ Years
- 12.4.8 Subsegment Pricing and Adoption Trends
- 12.4.9 Leading Suppliers and Competition
- 12.4.10 Regional Demand and Opportunities
- 12.5 By Application - Market Size and Forecast, 2024-2032
- 12.5.1 Segment Definition and Scope
- 12.5.2 Historical Market Size
- 12.5.3 Revenue Forecast, 2024-2032
- 12.5.4 Volume Forecast, 2024-2032
- 12.5.5 Base-Year Market Share, 2024
- 12.5.6 Segment CAGR and Growth Drivers
- 12.5.7 Subsegment Market Size and Forecast
- 12.5.7.1 Educational
- 12.5.7.2 Entertainment
- 12.5.7.3 Physical Activity
- 12.5.7.4 Others
- 12.5.8 Subsegment Pricing and Adoption Trends
- 12.5.9 Leading Suppliers and Competition
- 12.5.10 Regional Demand and Opportunities
- 12.6 By Sales Channel - Market Size and Forecast, 2024-2032
- 12.6.1 Segment Definition and Scope
- 12.6.2 Historical Market Size
- 12.6.3 Revenue Forecast, 2024-2032
- 12.6.4 Volume Forecast, 2024-2032
- 12.6.5 Base-Year Market Share, 2024
- 12.6.6 Segment CAGR and Growth Drivers
- 12.6.7 Subsegment Market Size and Forecast
- 12.6.7.1 Hypermarkets / Supermarkets
- 12.6.7.2 Specialty Stores
- 12.6.7.3 Online Channels
- 12.6.7.4 Others
- 12.6.8 Subsegment Pricing and Adoption Trends
- 12.6.9 Leading Suppliers and Competition
- 12.6.10 Regional Demand and Opportunities
- 12.7 Segment Growth Comparison
- 12.8 Segment Attractiveness and Priority Matrix
Chapter 13 U.S. Toy End-Use and Application Market Outlook
- 13.1 End-Use Industry and Customer Demand Structure
- 13.2 Leading Applications and Customer Groups
- 13.3 End-Use Market Size, Share and Forecast
- 13.4 Major End-Use Industry Deep Dives
- 13.4.1 Customer Requirements and Use Cases
- 13.4.2 Demand and Replacement Cycles
- 13.4.3 Technical and Regulatory Considerations
- 13.4.4 Purchasing and Procurement Models
- 13.4.5 Leading Vendors and Distribution Channels
- 13.4.6 Forecast and Commercial Opportunities
- 13.5 Emerging Applications and Cross-Segment Demand
- 13.6 End-Use Industry Investment Priorities
Chapter 14 U.S. Toy Geographic Market Outlook, 2024-2032
- 14.1 Domestic Market Distribution and Demand Clusters
- 14.2 State- or Province-Wise Market Size and Forecast, 2024-2032
- 14.3 City and Metropolitan Market Outlook
- 14.4 Industrial, Manufacturing and Commercial Clusters
- 14.5 Geographic Concentration of Key End Users
- 14.6 Local Pricing and Purchasing Differences
- 14.7 Domestic Production Facilities and Capacity Map
- 14.8 Local Infrastructure and Project Pipeline
- 14.9 State-Level Policy and Incentive Differences
- 14.10 Subnational Investment Hotspots and Opportunities
- 14.11 Distribution and Logistics Networks
- 14.12 Domestic Competitive Footprint
Chapter 15 U.S. Toy Technology, Innovation and Sustainability Outlook
- 15.1 Technology Landscape and Maturity
- 15.2 Product, Process and Service Innovation
- 15.3 AI, Automation and Digital Tools in the Industry
- 15.4 Technology Adoption and Performance Benchmarking
- 15.5 Innovation Pipeline and R&D Investment
- 15.6 Patent and Intellectual Property Trends
- 15.7 Energy Efficiency and Resource Management
- 15.8 Sustainability, Recycling and Circularity
- 15.9 Technology Roadmap, 2024-2032
- 15.10 Risks of Obsolescence and Technology Substitution
Chapter 16 U.S. Toy Market Key Strategic Imperatives
- 16.1 Growth and Market Entry Priorities
- 16.2 High-Return Products and Segments
- 16.3 Pricing, Profitability and Cost Optimization
- 16.4 Technology Investment and Product Differentiation
- 16.5 Supply Chain Localization and Resilience
- 16.6 Distribution and Customer Acquisition
- 16.7 Partnership, Acquisition and Capacity Strategy
- 16.8 Regional Expansion Priorities
- 16.9 Short-, Medium- and Long-Term Actions
Chapter 17 Competition Outlook
- 17.1 Industry Competition Characteristics
- 17.2 Market Structure and Concentration
- 17.3 Market Share and Competitive Positioning, 2024
- 17.4 Company-Wise Revenue and Product Benchmarking
- 17.5 Production and Service Capacity Benchmarking
- 17.6 Technology, Pricing and Differentiation
- 17.7 Regional Footprint and Distribution Strength
- 17.8 Mergers, Acquisitions and Strategic Alliances
- 17.9 New Entrants and Competitive Threats
- 17.10 Porter's Five Forces and Industry Attractiveness
- 17.11 Competitive Outlook, 2024-2032
Chapter 18 Company Profiles
- 18.1 Company Coverage and Selection Criteria
- 18.2 Mattel Inc.
- 18.2.1 Business Description
- 18.2.2 Company Ownership and Geographic Presence
- 18.2.3 Product and Service Portfolio
- 18.2.4 Manufacturing and Operating Footprint
- 18.2.5 Production Capacity and Expansion Plans
- 18.2.6 Financial Performance and Investment
- 18.2.7 Market Share and Competitive Position
- 18.2.8 Technology and Innovation Capabilities
- 18.2.9 Strategic Alliances or Partnerships
- 18.2.10 Recent Developments
- 18.2.11 Growth Strategy and Outlook
- 18.3 Hasbro Inc.
- 18.4 LEGO Group
- 18.5 JAKKS Pacific Inc.
- 18.6 Bandai Namco
- 18.7 Funko Inc.
- 18.8 Clementoni S.p.A.
- 18.9 ROYBI
- 18.10 Sphero
- 18.11 Melissa & Doug
- 18.12 Other Relevant Market Participants
Note: Every listed company is profiled on the structure shown under the first company. The company list is preliminary and may change based on research findings, market developments, data availability and client requirements.
Chapter 19 Disclaimer
- 19.1 Research and Forecast Disclaimer
- 19.2 Data Source and Estimation Limitations
Note: The depth of individual sections depends on data availability for this market. Volume, capacity, trade and other unit-based metrics are included where applicable.

