Home » Consumer Goods » Ride-on Toys Market

Ride-on Toys Market By Type (Battery-Powered Ride-Ons, Pedal-Powered Ride-Ons, Push Ride-Ons, Walk-Behind Ride-Ons); By Price Range (Budget [under $50], Mid-Range [$50–$150], Premium [$150 and above]); By Age Group (Toddlers [1–3 years], Preschool [3–5 years], Early School Age [5–7 years], Middle Childhood [7–12 years]); By Material Type (Plastic Ride-Ons, Wooden Ride-Ons, Metal Ride-Ons, Combination Material Ride-Ons); By Gender (Boys, Girls, Unisex) – Growth, Share, Opportunities & Competitive Analysis, 2024 – 2032

Report ID: 95942 | Report Format : Excel, PDF

REPORT ATTRIBUTE DETAILS
Historical Period 2020-2023
Base Year 2024
Forecast Period 2025-2032
Ride-on Toys Market Size 2024 USD 5,665.37 million
Ride-on Toys Market, CAGR 5.79%
Ride-on Toys Market Size 2032  USD 8,887.07 million

Market Overview

The Global Ride-on Toys Market is projected to grow from USD 5,665.37 million in 2024 to an estimated USD 8,887.07 million by 2032, exhibiting a compound annual growth rate (CAGR) of 5.79% from 2025 to 2032.

Key drivers fueling the ride-on toys market include growing disposable incomes, heightened parental awareness of the benefits of physical activity for children, and the expanding e-commerce sector facilitating easy access to a wide range of products. Trends such as electric-powered ride-on toys and environmentally friendly, sustainable materials are gaining traction, responding to consumer demand for innovation and eco-consciousness. Additionally, collaborations between toy manufacturers and entertainment franchises enhance product appeal, further boosting market demand.

Geographically, North America dominates the ride-on toys market due to high consumer spending and well-established retail and e-commerce infrastructure. Europe follows closely, driven by strong demand for technologically advanced and safe ride-on toys. The Asia Pacific region is expected to witness the fastest growth, supported by increasing urbanization, rising middle-class income, and growing awareness of early childhood development. Leading companies in this market include Fisher-Price, Peg Perego, Razor, Little Tikes, and Kid Motorz, which continuously invest in product innovation and marketing to maintain competitive positions globally.

Ride-on Toys Market Size

Access crucial information at unmatched prices!

Request your sample report today & start making informed decisions powered by Credence Research Inc.!

Download Sample

Market Insights

  • The Global Ride-on Toys Market is projected to grow from USD 5,665.37 million in 2024 to USD 8,887.07 million by 2032, with a CAGR of 5.79% from 2025 to 2032.
  • Rising disposable incomes and increasing consumer spending on children’s entertainment products drive market growth.
  • Growing parental awareness of the benefits of physical activity for children encourages demand for ride-on toys that promote motor skill development.
  • Expansion of e-commerce platforms facilitates wider accessibility and variety, boosting sales globally.
  • Stringent safety regulations and high production costs challenge market expansion and product innovation.
  • North America dominates the market due to high consumer spending and well-established retail infrastructure, holding over 37% market share in 2024.
  • Asia Pacific is the fastest-growing region with a CAGR of 7.0%, supported by urbanization, rising middle-class income, and increasing awareness of early childhood development.

Market Drivers

Rising Disposable Income and Increasing Consumer Spending on Children’s Entertainment Products

The rise in disposable income globally drives greater consumer spending on children’s entertainment products, including ride-on toys. Families allocate more budget towards enhancing children’s recreational experiences, boosting demand for premium and innovative ride-on toys. The affordability of advanced toys improves due to cost-effective manufacturing and wider distribution networks. Increasing urbanization and dual-income households further contribute to higher expenditure on quality toys that provide educational and physical benefits. This shift encourages manufacturers to diversify their product portfolios to meet evolving consumer preferences. The Global Ride-on Toys Market benefits significantly from this economic factor, supporting steady revenue growth.

  • For instance, in India, more than 800,000 toy retailers operate across the country, contributing to the rapid expansion of ride-on toys among urban households.

Growing Awareness of Physical Activity Benefits and Child Development

Parents increasingly recognize the importance of physical activity for healthy child development, prompting higher demand for ride-on toys that promote movement and coordination. It helps children develop motor skills, balance, and spatial awareness through active play. Educational institutions and pediatric experts often recommend outdoor and interactive toys, influencing parental purchasing decisions. This awareness encourages manufacturers to design ride-on toys that combine entertainment with developmental advantages. The focus on health-conscious parenting drives sustained interest in this market segment. By emphasizing physical and cognitive development, ride-on toys maintain their relevance in the competitive toy industry.

  • For instance, 72 million children in India actively engage in outdoor play, driving interest in ride-on toys that enhance mobility and coordination.

Technological Advancements and Innovation in Ride-On Toys

The incorporation of technology enhances the appeal of ride-on toys by improving safety features, functionality, and user experience. Electric-powered models, remote controls, and interactive elements such as lights and sounds attract both children and parents. It expands the age range and versatility of ride-on toys, increasing market penetration. Manufacturers invest heavily in research and development to introduce cutting-edge designs that meet safety standards and consumer expectations. Innovation also helps differentiate brands in a crowded marketplace, fostering customer loyalty. These advancements drive continuous product refreshment, fueling market expansion.

Expansion of E-Commerce Platforms Facilitating Wider Market Reach

The growth of e-commerce platforms accelerates the distribution and accessibility of ride-on toys to a broader consumer base worldwide. Online retail offers convenience, competitive pricing, and extensive product variety, encouraging more consumers to purchase ride-on toys digitally. It enables smaller brands to reach global audiences without relying solely on physical retail presence. Customer reviews and detailed product information on e-commerce sites enhance buyer confidence and decision-making. The online channel complements traditional retail, supporting sustained sales growth. This distribution evolution plays a critical role in the Global Ride-on Toys Market’s expansion.

Market Trends

Increasing Popularity of Electric and Battery-Powered Ride-On Toys

The Global Ride-on Toys Market experiences significant growth driven by the rising popularity of electric and battery-powered models. These toys offer enhanced speed, realistic driving experiences, and ease of use, appealing to both children and parents. It provides an alternative to traditional pedal-powered options, making playtime more engaging and dynamic. Manufacturers continuously improve battery life and charging efficiency to meet consumer expectations. The integration of advanced motor technology also enhances safety features and performance. This trend expands the market’s product range and attracts tech-savvy consumers seeking innovative play solutions.

  • For instance, the U.S. Consumer Product Safety Commission reported 13,000 emergency room visits in 2020 related to ride-on toys, highlighting the importance of safety innovations.

Growing Consumer Preference for Eco-Friendly and Sustainable Materials

Consumers increasingly demand environmentally responsible products, prompting manufacturers to adopt sustainable and non-toxic materials in ride-on toy production. It helps reduce the environmental impact and addresses health concerns related to harmful chemicals. The Global Ride-on Toys Market reflects this shift through the introduction of biodegradable plastics, recycled materials, and low-emission manufacturing processes. Brands emphasize transparency and eco-certifications to build trust and appeal to eco-conscious buyers. This trend supports long-term market sustainability and aligns with global environmental initiatives. It also creates opportunities for product differentiation and premium pricing.

  • For instance, according to the World Economic Forum, 90% of children’s toys are still made of plastic, but major brands like Mattel aim to transition to 100% recycled or bio-based plastics by 2030.

Rising Collaboration Between Toy Manufacturers and Entertainment Franchises

Collaborations between ride-on toy manufacturers and popular entertainment franchises gain traction, boosting product appeal through licensed characters and themed designs. It leverages children’s familiarity with movies, cartoons, and video games to enhance engagement and brand loyalty. The Global Ride-on Toys Market benefits from strategic partnerships that expand product offerings and improve market penetration. These collaborations increase marketing reach and create cross-promotional opportunities, driving sales. Consumers often prefer branded toys, perceiving higher value and quality. This trend influences product innovation and marketing strategies across the industry.

Expansion of Online Retail Channels and Digital Marketing Strategies

The rise of online retail channels significantly transforms the distribution landscape for ride-on toys. E-commerce platforms offer wide product selections, competitive pricing, and convenient shopping experiences, attracting diverse consumer segments. It enables brands to reach global audiences efficiently without relying exclusively on physical stores. The Global Ride-on Toys Market sees increased investment in digital marketing, including social media campaigns, influencer partnerships, and targeted advertising to boost brand awareness. This approach improves customer engagement and drives direct sales. Online retail and digital promotion form integral components of modern market growth strategies.

Market Challenges

Stringent Safety Regulations and Compliance Requirements Impacting Product Development

The Global Ride-on Toys Market faces significant challenges due to stringent safety regulations imposed by various countries. Manufacturers must ensure that their products comply with rigorous safety standards related to battery performance, electrical components, and physical design. It increases production costs and extends the time required for product development and certification. Non-compliance risks product recalls, legal penalties, and damage to brand reputation. Companies invest substantial resources to test and certify ride-on toys to meet these evolving standards. Navigating diverse regulatory environments across regions further complicates market entry and expansion. This challenge limits the speed of innovation and product launches in the market.

  • For instance, toy safety regulations in the European Union require compliance with over 50 distinct safety criteria, including mechanical, chemical, and flammability standards

High Production Costs and Supply Chain Disruptions Affecting Market Growth

Rising raw material prices and supply chain disruptions pose ongoing challenges for the Global Ride-on Toys Market. Costs for plastics, metals, and electronic components increase manufacturing expenses, squeezing profit margins. It forces companies to either absorb higher costs or pass them on to consumers, potentially reducing demand. Supply chain interruptions caused by geopolitical tensions, transportation delays, or labor shortages create uncertainty in production schedules. Manufacturers face difficulties maintaining consistent inventory levels, impacting product availability and sales. These challenges necessitate strategic sourcing and efficient supply chain management. They restrict market growth by limiting scalability and responsiveness to changing consumer demand.

Ride-on Toys Market Segmentation

Market Opportunities

Expanding Urbanization and Rising Middle-Class Income Levels Driving Market Demand

The Global Ride-on Toys Market benefits from rapid urbanization and increasing disposable income among the middle class in emerging economies. Growing urban populations create higher demand for recreational products that support children’s physical activity within limited living spaces. It opens opportunities for manufacturers to introduce compact, versatile ride-on toys tailored to urban environments. Rising household incomes enable consumers to invest in premium and innovative toys, boosting overall market revenue. Companies that focus on affordability without compromising quality can capture a larger share in these regions. This demographic shift supports long-term market expansion and product diversification. Targeting emerging markets remains a key growth strategy.

Integration of Smart Technologies and Interactive Features Enhancing Consumer Appeal

Incorporating smart technologies and interactive features in ride-on toys creates substantial growth opportunities for the Global Ride-on Toys Market. It allows manufacturers to differentiate products through enhanced safety, connectivity, and user engagement. Features such as app-controlled functions, voice commands, and educational elements attract tech-savvy parents and children. Developing customizable ride-on toys caters to personalized play experiences, increasing consumer satisfaction. The trend toward digital integration aligns with broader shifts in the toy industry toward connected and interactive products. Companies that innovate in this area can expand their customer base and command premium pricing. This opportunity fuels ongoing product development and market competitiveness.

Market Segmentation Analysis

By Type

The Global Ride-on Toys Market segments by type include battery-powered ride-ons, pedal-powered ride-ons, push ride-ons, and walk-behind ride-ons. Battery-powered ride-ons dominate the market due to their enhanced features, ease of use, and growing consumer preference for electric models. Pedal-powered ride-ons hold a steady share driven by affordability and physical engagement benefits. Push ride-ons and walk-behind ride-ons cater primarily to younger children and offer safety and simplicity. Each type addresses distinct consumer needs, enabling manufacturers to target diverse age groups and preferences effectively.

By Price Range

The market categorizes products into budget (under \$50), mid-range (\$50–\$150), and premium (above \$150) price segments. Mid-range ride-on toys generate significant revenue, balancing affordability and advanced features. Budget products attract cost-conscious consumers seeking basic functionality, while premium models appeal to buyers looking for innovative designs, durability, and brand value. The varied price range allows companies to capture a broad customer base across different income levels and geographies.

By Age Group

Ride-on toys serve distinct age groups: toddlers (1-3 years), preschool (3-5 years), early school age (5-7 years), and middle childhood (7-12 years). The preschool segment holds a substantial share due to the high demand for developmental toys in this stage. Early school-age children increasingly prefer sophisticated and battery-powered ride-ons. Manufacturers tailor products to developmental needs and safety requirements of each age group, driving targeted marketing and product innovation.

By Material Type

The market divides ride-on toys into plastic, wooden, metal, and combination material types. Plastic ride-ons dominate for their cost-effectiveness, lightweight nature, and design flexibility. Wooden ride-ons appeal to consumers seeking eco-friendly and durable options. Metal and combination materials offer enhanced strength and aesthetics, targeting premium buyers. Material selection influences product durability, safety, and price, shaping consumer choice.

By Gender

Ride-on toys segment into boys, girls, and unisex categories. Unisex products command a growing market share due to increasing demand for gender-neutral toys and parental preference for versatile options. Boys’ and girls’ segments remain relevant, featuring gender-targeted designs and themes. Brands adapt marketing strategies to appeal to specific genders while expanding unisex offerings to capture wider audiences.

Segments

Based on Type

  • Battery-Powered Ride-Ons
  • Pedal-Powered Ride-Ons
  • Push Ride-Ons
  • Walk-Behind Ride-Ons

Based on Price Range

  • Budget (under $50)
  • Mid-Range ($50-$150)
  • Premium ($150 and above)

Based on Age Group

  • Toddlers (1-3 years)
  • Preschool (3-5 years)
  • Early School Age (5-7 years)
  • Middle Childhood (7-12 years )

Based on Material Type

  • Plastic Ride-Ons
  • Wooden Ride-Ons
  • Metal Ride-Ons
  • Combination Material Ride-Ons

Based on Gender

  • Boys
  • Girls
  • Unisex

Based on Region

  • North America
    • U.S.
    • Canada
    • Mexico
  • Europe
    • UK
    • France
    • Germany
    • Italy
    • Spain
    • Russia
    • Belgium
    • Netherlands
    • Austria
    • Sweden
    • Poland
    • Denmark
    • Switzerland
    • Rest of Europe
  • Asia Pacific
    • China
    • Japan
    • South Korea
    • India
    • Australia
    • Thailand
    • Indonesia
    • Vietnam
    • Malaysia
    • Philippines
    • Taiwan
    • Rest of Asia Pacific
  • Latin America
    • Brazil
    • Argentina
    • Peru
    • Chile
    • Colombia
    • Rest of Latin America
  • Middle East
    • UAE
    • KSA
    • Israel
    • Turkey
    • Iran
    • Rest of Middle East
  • Africa
    • Egypt
    • Nigeria
    • Algeria
    • Morocco
    • Rest of Africa

Regional Analysis

North America Ride-on Toys Market

The North America Ride-on Toys Market holds the largest regional share, with a market size of USD 2,100.29 million in 2024, projected to reach USD 3,310.92 million by 2032. It is expected to grow at a CAGR of 5.9% during this period. High disposable income, advanced retail infrastructure, and widespread adoption of electric ride-on toys drive demand in this region. The United States and Canada lead the market due to strong consumer spending on premium and innovative children’s products. Growing awareness of the developmental benefits of ride-on toys further supports growth. North America accounts for approximately 37.1% of the global market share in 2024, maintaining its dominant position through continuous innovation and strong brand presence.

Europe Ride-on Toys Market

Europe ranks second in market size, valued at USD 1,081.93 million in 2024 and forecast to reach USD 1,554.99 million by 2032, growing at a CAGR of 4.7%. It represents nearly 19.1% of the global market share in 2024. The region benefits from stringent safety regulations and consumer preference for high-quality, safe ride-on toys. Countries such as Germany, the UK, and France contribute significantly to the market, supported by well-established retail and e-commerce channels. Demand for eco-friendly and educational ride-on toys increases in response to rising environmental awareness. Manufacturers emphasize compliance and product innovation to sustain growth in this region.

Asia Pacific Ride-on Toys Market

The Asia Pacific Ride-on Toys Market shows the fastest growth with a CAGR of 7.0%, expanding from USD 1,469.79 million in 2024 to USD 2,521.54 million by 2032. It holds approximately 25.9% of the global market share in 2024. Rapid urbanization, rising middle-class income, and increasing awareness of child development propel market expansion in China, India, Japan, and Southeast Asia. The region witnesses growing demand for affordable yet technologically advanced ride-on toys. Expansion of online retail and improved distribution networks enable wider market reach. Asia Pacific emerges as a key focus area for manufacturers seeking growth opportunities

Latin America Ride-on Toys Market

The Latin America Ride-on Toys Market accounts for about 7.4% of the global market in 2024, with a market size of USD 418.61 million. It is expected to grow to USD 609.03 million by 2032 at a CAGR of 4.9%. Brazil, Mexico, and Argentina dominate the regional market due to increasing urbanization and expanding retail infrastructure. Rising disposable income among the middle class supports demand for recreational and educational toys. Challenges such as import duties and logistical constraints influence pricing and availability. Market players invest in localized marketing strategies to capture growth in this region.

Middle East Ride-on Toys Market

The Middle East Ride-on Toys Market holds around 5.2% of the global market share in 2024, with a size of USD 295.13 million, projected to reach USD 427.41 million by 2032. It grows at a CAGR of 4.8%. Wealth concentration in countries like the UAE and Saudi Arabia drives demand for premium ride-on toys. Consumer preference leans towards innovative and branded products, supported by modern retail formats and e-commerce expansion. The region’s young population creates consistent demand for children’s toys. Manufacturers focus on customization and high safety standards to meet market expectations.

Africa Ride-on Toys Market

Africa’s Ride-on Toys Market stands at USD 299.61 million in 2024, expected to grow to USD 463.17 million by 2032 at a CAGR of 5.8%. It contributes approximately 5.3% to the global market share. Increasing urbanization, growing middle-class population, and improving retail infrastructure support market growth across countries like South Africa, Nigeria, and Kenya. Affordability and durability remain key factors influencing purchase decisions. The market faces challenges due to limited distribution channels and import restrictions. Companies explore partnerships with local distributors to enhance market penetration and brand visibility.

Shape Your Report to Specific Countries or Regions & Enjoy 30% Off!

Key players

  • Adventure Force
  • Alex Brands
  • Basic Fun, Inc.
  • Buzz Bee Toys
  • Hasbro, Inc.
  • JT SplatMaster
  • Les Jeux MGA
  • Marshmallow Fun Company
  • Mattel, Inc.
  • Prime Time Toys Ltd.
  • Skullduggery, Inc.
  • Umarex USA
  • ZING
  • ZURU, Inc.

Competitive Analysi

The Global Ride-on Toys Market remains highly competitive with numerous established and emerging players vying for market share. Leading companies such as Mattel, Hasbro, and Alex Brands focus heavily on innovation, product diversification, and strategic partnerships to strengthen their positions. It compels competitors to continuously enhance product quality, safety features, and design aesthetics to attract discerning consumers. The market favors companies that leverage advanced technology integration and expand their e-commerce presence. Brand recognition and extensive distribution networks provide key advantages in reaching global consumers. Smaller players often differentiate through niche product offerings and competitive pricing. Competitive dynamics in the market drive rapid product development cycles and marketing efforts, fostering an environment of continuous growth and evolution.

Recent Developments

  • In May 2025, Adventure Force released the 24V Thunder Tank ride-on toy, featuring a rotating turret and working cannon, available exclusively at Walmart.
  • In May 2025, Hasbro returned to the Las Vegas Licensing Expo, unveiling new franchise-defining products, including ride-on toys under its Tonka and Nerf brands.
  • In late 2025, Mattel Adventure Park is set to open in Glendale, Arizona, featuring immersive experiences based on its popular brands, including ride-on attractions.
  • In April 2025, ZURU expanded its global presence by establishing a new office and showroom in Warsaw, Poland, aiming to strengthen its market in Central and Eastern Europe.
  • In February 2025, Umarex USA announced a range of new products for the year, focusing on innovation in airgun technology, though no specific ride-on toys were highlighted.
  • In May 2025, Basic Fun! CEO Jay Foreman discussed the company’s initiatives to revitalize classic toy brands and adapt to changing market dynamics.

Market Concentration and Characteristics 

The Global Ride-on Toys Market exhibits a moderately concentrated competitive landscape, dominated by a few key players with significant market shares alongside numerous smaller manufacturers. It features strong brand loyalty driven by innovation, product quality, and safety compliance. Leading companies invest in research and development to introduce technologically advanced and differentiated products, maintaining their competitive edge. The market values product customization and diverse offerings across various price ranges and age groups. It also shows increasing fragmentation due to the entry of regional and niche players catering to specific consumer preferences. Distribution channels include traditional retail, e-commerce, and specialty stores, enhancing market reach. This combination of established global brands and agile smaller companies shapes a dynamic and evolving market environment.

Report Coverage

The research report offers an in-depth analysis based on Type, Price Range, Age Group, Material Type, Gender and Region. It details leading market players, providing an overview of their business, product offerings, investments, revenue streams, and key applications. Additionally, the report includes insights into the competitive environment, SWOT analysis, current market trends, as well as the primary drivers and constraints. Furthermore, it discusses various factors that have driven market expansion in recent years. The report also explores market dynamics, regulatory scenarios, and technological advancements that are shaping the industry. It assesses the impact of external factors and global economic changes on market growth. Lastly, it provides strategic recommendations for new entrants and established companies to navigate the complexities of the market.

Future Outlook

  1. The Global Ride-on Toys Market will continue to expand steadily, driven by rising disposable incomes and increased parental focus on child development through play.
  2. Electric and battery-powered ride-on toys will dominate future product launches due to growing consumer preference for enhanced features and realistic play experiences.
  3. Technological integration such as app-controlled functionalities and smart safety systems will become standard, enhancing user engagement and parental control.
  4. Sustainable and eco-friendly materials will gain prominence, with manufacturers prioritizing environmentally responsible production to meet evolving consumer expectations.
  5. Emerging markets in Asia Pacific and Latin America will present significant growth opportunities, fueled by urbanization, rising middle-class populations, and improved retail infrastructure.
  6. E-commerce platforms will play a critical role in expanding market reach, offering consumers convenience and access to a wider variety of ride-on toy options.
  7. Collaboration between toy manufacturers and entertainment franchises will increase, leveraging popular characters to boost product appeal and drive sales.
  8. Customizable and personalized ride-on toys will become more popular, allowing consumers to tailor products to specific preferences and developmental needs.
  9. Regulatory focus on safety standards will tighten globally, prompting manufacturers to enhance quality assurance and compliance measures.
  10. Innovation in design and features will remain a key competitive driver, with companies investing in research and development to differentiate offerings and sustain market leadership.

CHAPTER NO. 1 : GENESIS OF THE MARKET

1.1 Market Prelude – Introduction & Scope

1.2 The Big Picture – Objectives & Vision

1.3 Strategic Edge – Unique Value Proposition

1.4 Stakeholder Compass – Key Beneficiaries

CHAPTER NO. 2 : EXECUTIVE LENS

2.1 Pulse of the Industry – Market Snapshot

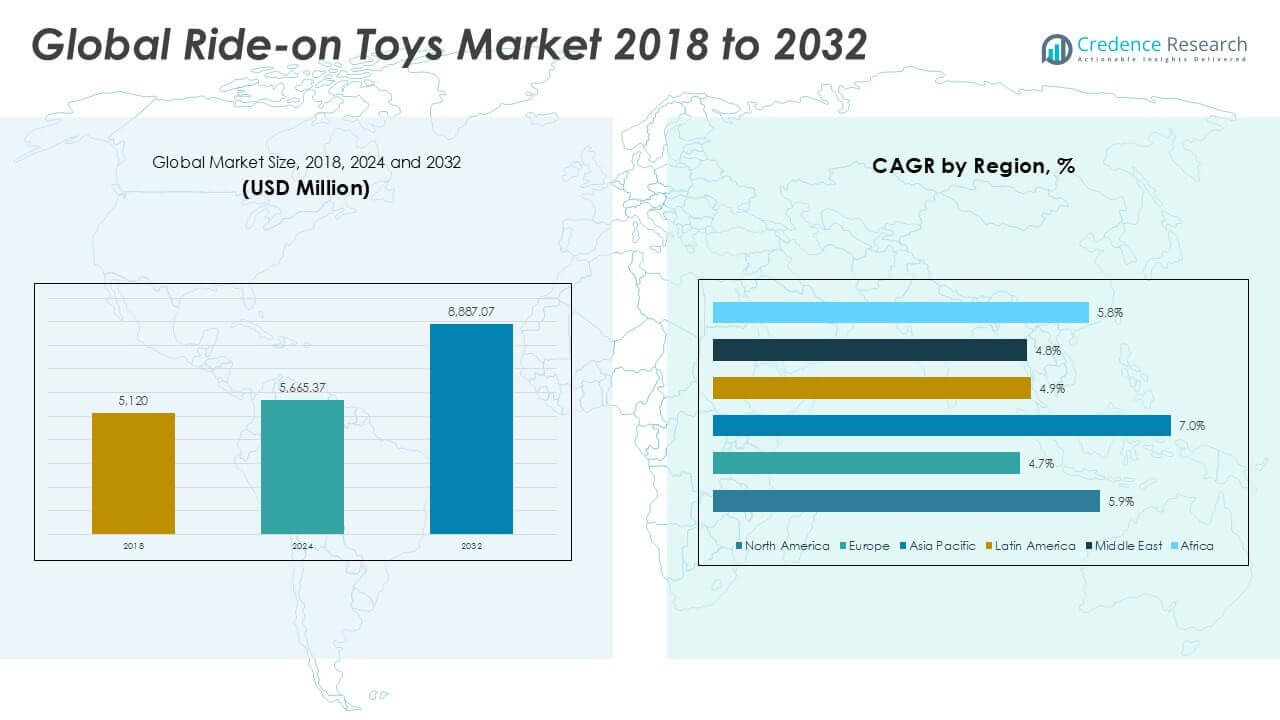
2.2 Growth Arc – Revenue Projections (USD Million)

2.3. Premium Insights – Based on Primary Interviews

CHAPTER NO. 3 : RIDE-ON TOYS MARKET FORCES & INDUSTRY PULSE

3.1 Foundations of Change – Market Overview

3.2 Catalysts of Expansion – Key Market Drivers

3.2.1 Momentum Boosters – Growth Triggers

3.2.2 Innovation Fuel – Disruptive Technologies

3.3 Headwinds & Crosswinds – Market Restraints

3.3.1 Regulatory Tides – Compliance Challenges

3.3.2 Economic Frictions – Inflationary Pressures

3.4 Untapped Horizons – Growth Potential & Opportunities

3.5 Strategic Navigation – Industry Frameworks

3.5.1 Market Equilibrium – Porter’s Five Forces

3.5.2 Ecosystem Dynamics – Value Chain Analysis

3.5.3 Macro Forces – PESTEL Breakdown

3.6 Price Trend Analysis

3.6.1 Regional Price Trend

3.6.2 Price Trend by product

CHAPTER NO. 4 : KEY INVESTMENT EPICENTER

4.1 Regional Goldmines – High-Growth Geographies

4.2 Product Frontiers – Lucrative Product Categories

4.3 Price Range Sweet Spots – Emerging Demand Segments

CHAPTER NO. 5: REVENUE TRAJECTORY & WEALTH MAPPING

5.1 Momentum Metrics – Forecast & Growth Curves

5.2 Regional Revenue Footprint – Market Share Insights

5.3 Segmental Wealth Flow – Type of Ride-On Toys & Price Range Revenue

CHAPTER NO. 6 : TRADE & COMMERCE ANALYSIS

6.1.Import Analysis by Region

6.1.1. Global Ride-on Toys Market Import Revenue By Region

6.2.Export Analysis by Region

6.2.1. Global Ride-on Toys Market Export Revenue By Region

CHAPTER NO. 7 : COMPETITION ANALYSIS

7.1.Company Market Share Analysis

7.1.1. Global Ride-on Toys Market: Company Market Share

7.2. Global Ride-on Toys Market Company Revenue Market Share

7.3.Strategic Developments

7.3.1.Acquisitions & Mergers

7.3.2. New Product Launch

7.3.3. Regional Expansion

7.4. Competitive Dashboard

7.5.    Company Assessment Metrics, 2024

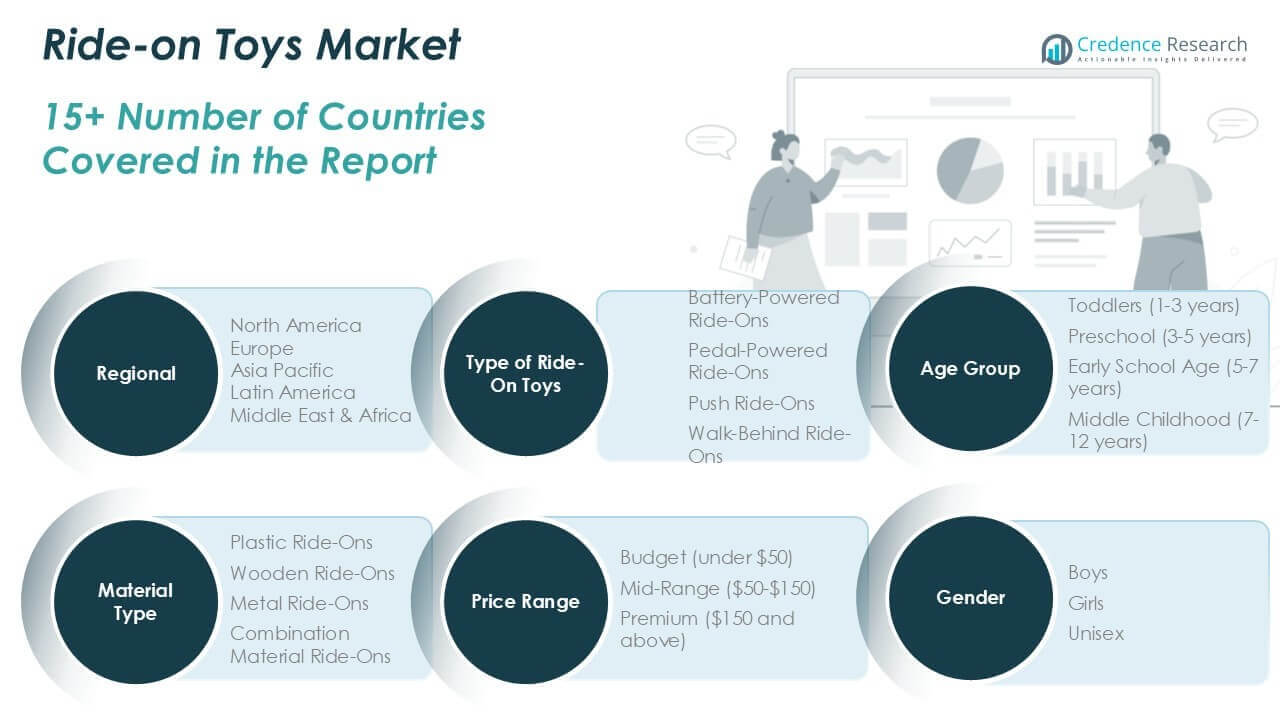
CHAPTER NO. 8 : RIDE-ON TOYS MARKET – BY TYPE OF RIDE-ON TOYS SEGMENT ANALYSIS

8.1.Ride-on Toys Market Overview by Type of Ride-On Toys Segment

8.1.1. Ride-on Toys Market Revenue Share By Type of Ride-On Toys

8.2.Battery-Powered Ride-Ons

8.3. Pedal-Powered Ride-Ons

8.4.Push Ride-Ons

8.5. Walk-Behind Ride-Ons

CHAPTER NO. 9 : RIDE-ON TOYS MARKET – BY PRICE RANGE SEGMENT ANALYSIS

9.1.Ride-on Toys Market Overview by Price Range Segment

9.1.1. Ride-on Toys Market Revenue Share By Price Range

9.3. Budget (under $50)

9.4. Mid-Range ($50-$150)

9.5. Premium ($150 and above)

CHAPTER NO. 10 : RIDE-ON TOYS MARKET – BY AGE GROUP SEGMENT ANALYSIS

10.1.Ride-on Toys Market Overview by Age Group Segment

10.1.1. Ride-on Toys Market Revenue Share By Age Group

10.2. Toddlers (1-3 years)

10.3. Preschool (3-5 years)

10.4. Early School Age (5-7 years)

10.5. Middle Childhood (7-12 years )

CHAPTER NO. 11 :RIDE-ON TOYS MARKET – BY MATERIAL TYPE SEGMENT ANALYSIS

11.1.Ride-on Toys Market Overview by Material Type Segment

11.1.1. Ride-on Toys Market Revenue Share By Material Type

11.2. Plastic Ride-Ons

11.3. Wooden Ride-Ons

11.4. Metal Ride-Ons

11.5. Combination Material Ride-Ons

CHAPTER NO. 12 : RIDE-ON TOYS MARKET – BY GENDER SEGMENT ANALYSIS

12.1.Ride-on Toys Market Overview by Gender Segment

12.1.1. Ride-on Toys Market Revenue Share By Gender

12.2. Boys

12.3.Girls

12.4. Unisex

CHAPTER NO. 13 : RIDE-ON TOYS MARKET – REGIONAL ANALYSIS

13.1.Ride-on Toys Market Overview by Region Segment

13.1.1. Global Ride-on Toys Market Revenue Share By Region

13.1.2.Regions

13.1.3.Global Ride-on Toys Market Revenue By Region

13.1.4.Type of Ride-On Toys

13.1.5.Global Ride-on Toys Market Revenue By Type of Ride-On Toys

13.1.6.Price Range

13.1.7. Global Ride-on Toys Market Revenue By Price Range

13.1.8.Age Group

13.1.9. Global Ride-on Toys Market Revenue By Age Group

13.1.10. Material Type

13.1.12. Global Ride-on Toys Market Revenue By Material Type

13.1.13. Gender

13.1.14. Global Ride-on Toys Market Revenue By Gender

CHAPTER NO. 14 : NORTH AMERICA RIDE-ON TOYS MARKET – COUNTRY ANALYSIS

14.1.North America Ride-on Toys Market Overview by Country Segment

14.1.1.North America Ride-on Toys Market Revenue Share By Region

14.2.North America

14.2.1.North America Ride-on Toys Market Revenue By Country

14.2.2.Type of Ride-On Toys

14.2.3.North America Ride-on Toys Market Revenue By Type of Ride-On Toys

14.2.4.Price Range

14.2.5.North America Ride-on Toys Market Revenue By Price Range

14.2.6.Age Group

14.2.7.North America Ride-on Toys Market Revenue By Age Group

14.2.8.Material Type

14.2.9.North America Ride-on Toys Market Revenue By Material Type

14.2.10.Sales Channel

14.2.11.North America Ride-on Toys Market Revenue By Gender

14.3.U.S.

14.4.Canada

14.5.Mexico

CHAPTER NO. 15 : EUROPE RIDE-ON TOYS MARKET – COUNTRY ANALYSIS

15.1. Europe Ride-on Toys Market Overview by Country Segment

15.1.1. Europe Ride-on Toys Market Revenue Share By Region

15.2.Europe

15.2.1.Europe Ride-on Toys Market Revenue By Country

15.2.2.Type of Ride-On Toys

15.2.3.Europe Ride-on Toys Market Revenue By Type of Ride-On Toys

15.2.4.Price Range

15.2.5. Europe Ride-on Toys Market Revenue By Price Range

15.2.6.Age Group

15.2.7. Europe Ride-on Toys Market Revenue By Age Group

15.2.8.Material Type

15.2.9. Europe Ride-on Toys Market Revenue By Material Type

15.2.10.Sales Channel

15.2.11. Europe Ride-on Toys Market Revenue By Gender

15.3.UK

15.4.France

15.5.Germany

15.6.Italy

15.7.Spain

15.8.Russia

15.9.   Rest of Europe

CHAPTER NO. 16 : ASIA PACIFIC RIDE-ON TOYS MARKET – COUNTRY ANALYSIS

16.1.Asia Pacific Ride-on Toys Market Overview by Country Segment

16.1.1.Asia Pacific Ride-on Toys Market Revenue Share By Region

16.2.Asia Pacific

16.2.1. Asia Pacific Ride-on Toys Market Revenue By Country

16.2.2.Type of Ride-On Toys

16.2.3.Asia Pacific Ride-on Toys Market Revenue By Type of Ride-On Toys

16.2.4.Price Range

16.2.5.Asia Pacific Ride-on Toys Market Revenue By Price Range

16.2.6.Age Group

16.2.7.Asia Pacific Ride-on Toys Market Revenue By Age Group

16.2.8.Material Type

16.2.9.Asia Pacific Ride-on Toys Market Revenue By Material Type

16.2.10.Sales Channel

16.2.11.Asia Pacific Ride-on Toys Market Revenue By Gender

16.3.China

16.4.Japan

16.5.South Korea

16.6.India

16.7.Australia

16.8.Southeast Asia

16.9. Rest of Asia Pacific

CHAPTER NO. 17 : LATIN AMERICA RIDE-ON TOYS MARKET – COUNTRY ANALYSIS

17.1.Latin America Ride-on Toys Market Overview by Country Segment

17.1.1.Latin America Ride-on Toys Market Revenue Share By Region

17.2. Latin America

17.2.1. Latin America Ride-on Toys Market Revenue By Country

17.2.2.Type of Ride-On Toys

17.2.3. Latin America Ride-on Toys Market Revenue By Type of Ride-On Toys

17.2.4.Price Range

17.2.5.Latin America Ride-on Toys Market Revenue By Price Range

17.2.6.Age Group

17.2.7.Latin America Ride-on Toys Market Revenue By Age Group

17.2.8.Material Type

17.2.9.Latin America Ride-on Toys Market Revenue By Material Type

17.2.10.Sales Channel

17.2.11.Latin America Ride-on Toys Market Revenue By Gender

17.3.Brazil

17.4.Argentina

17.5.Rest of Latin America

CHAPTER NO. 18 : MIDDLE EAST RIDE-ON TOYS MARKET – COUNTRY ANALYSIS

18.1.Middle East Ride-on Toys Market Overview by Country Segment

18.1.1.Middle East Ride-on Toys Market Revenue Share By Region

18.2.Middle East

18.2.1. Middle East Ride-on Toys Market Revenue By Country

18.2.2.Type of Ride-On Toys

18.2.3.Middle East Ride-on Toys Market Revenue By Type of Ride-On Toys

18.2.4.Price Range

18.2.5.Middle East Ride-on Toys Market Revenue By Price Range

18.2.6. Age Group

18.2.7.Middle East Ride-on Toys Market Revenue By Age Group

18.2.8. Material Type

18.2.9.Middle East Ride-on Toys Market Revenue By Material Type

18.2.10. Sales Channel

18.2.11.Middle East Ride-on Toys Market Revenue By Gender

18.3.GCC Countries

18.4. Israel

18.5. Turkey

18.6.Rest of Middle East

CHAPTER NO. 19 : AFRICA RIDE-ON TOYS MARKET – COUNTRY ANALYSIS

19.1. Africa Ride-on Toys Market Overview by Country Segment

19.1.1.Africa Ride-on Toys Market Revenue Share By Region

19.2. Africa

19.2.1.Africa Ride-on Toys Market Revenue By Country

19.2.2.Type of Ride-On Toys

19.2.3.Africa Ride-on Toys Market Revenue By Type of Ride-On Toys

19.2.4.Price Range

19.2.5. Africa Ride-on Toys Market Revenue By Price Range

19.2.6.Age Group

19.2.7. Africa Ride-on Toys Market Revenue By Age Group

19.2.8.Material Type

19.2.9. Africa Ride-on Toys Market Revenue By Material Type

19.2.10.Sales Channel

19.2.11. Africa Ride-on Toys Market Revenue By Gender

19.3. South Africa

19.4.Egypt

19.5.Rest of Africa

CHAPTER NO. 20 : COMPANY PROFILES

20.1. Adventure Force

20.1.1.Company Overview

20.1.2.Product Portfolio

20.1.3.Financial Overview

20.1.4.Recent Developments

20.1.5.Growth Strategy

20.1.6.SWOT Analysis

20.2.Alex Brands

20.3.Basic Fun, Inc.

20.4.Buzz Bee Toys

20.5.Hasbro, Inc.

20.6.JT SplatMaster

20.7.Les Jeux MGA

20.8. Marshmallow Fun Company

20.9. Mattel, Inc.

20.10. Prime Time Toys Ltd.

20.11.Skullduggery, Inc.

20.12. Umarex USA

20.13.ZING

20.14.ZURU, Inc.


Request Free Sample

Ready to Transform Data into Decisions?

Request Your Sample Report and Start Your Journey of Informed Choices


Providing the strategic compass for industry titans.

cr-clients-logos

Frequently Asked Questions

What was the market size of the Global Ride-on Toys Market in 2023, and what is its expected size by 2032?

The market was valued at approximately USD 5,665.37 million in 2024 and is projected to reach USD 8,887.07 million by 2032, growing at a CAGR of 5.79% from 2025 to 2032.

What are the primary factors driving growth in the Global Ride-on Toys Market?

Rising disposable incomes, increased parental awareness of physical activity benefits for children, and the growth of e-commerce platforms drive market expansion.

Which product trends are currently shaping the Global Ride-on Toys Market?

Electric-powered ride-on toys and eco-friendly, sustainable materials are gaining popularity due to consumer demand for innovation and environmental responsibility.

Who are the key companies competing in the Global Ride-on Toys Market?

Leading players include Fisher-Price, Peg Perego, Razor, Little Tikes, and Kid Motorz, focusing on innovation and marketing to sustain competitive advantages globally.

About Author

Rajdeep Kumar Deb

Rajdeep Kumar Deb

Lead Analyst – Consumer & Finance

Rajdeep brings a decade of consumer goods and financial services insight to strategic market analysis.

View Profile

Propane Powered Lawn Mowers Market

The global propane powered lawn mowers market is anticipated to grow at a substantial CAGR of 5.2% in the upcoming years. 1. Preface
1.1. Report Description
1.1.1. Purpose of the Report
1.1.2. Target Audience
1.1.3. USP and Key Offerings
1.2. Research Scope
1.3. Research Methodology
1.3.1. Phase I – Secondary Research
1.3.2. Phase II – Data Modelling
1.3.2.1. Company Share Analysis Model
1.3.2.2. Revenue Based Modelling
1.3.3. Phase III – Primary Research
1.3.4. Research Limitations
1.3.5. Assumptions
1.4. Market Introduction
1.5. Market Research Scope
2. Executive Summary
2.1. Market Snapshot: Global Propane Powered Lawn Mowers Market
2.2. Global Propane Powered Lawn Mowers Market, By Product
2.3. Global Propane Powered Lawn Mowers Market, By End-User
2.4. Global Propane Powered Lawn Mowers Market, By Start Type
2.5. Global Propane Powered Lawn Mowers Market, By Blade Type
2.6. Global Propane Powered Lawn Mowers Market, By Distribution Channel
2.7. Global Propane Powered Lawn Mowers Market, By Region
3. Market Dynamics & Factors Analysis
3.1. Introduction
3.1.1. Global Propane Powered Lawn Mowers Market Value, 2017-2030, (US$ Mn)
3.1.2. Y-o-Y Growth Trend Analysis
3.2. Market Dynamics
3.2.1. Market Drivers
3.2.1.1. Driver 1
3.2.1.2. Driver 2
3.2.1.3. Driver 3
3.2.2. Market Restraints
3.2.2.1. Restraint 1
3.2.2.2. Restraint 2
3.2.3. Market Opportunities
3.2.3.1. Opportunity 1
3.2.3.2. Opportunity 2
3.2.4. Major Industry Challenges
3.2.4.1. Challenge 1
3.2.4.2. Challenge 2
3.3. Growth and Development Patterns
3.4. Investment Feasibility Analysis
3.5. Market Opportunity Analysis
3.5.1. End-User
3.5.2. Product
3.5.3. Start Type
3.5.4. Blade Type
3.5.5. Distribution Channel
3.5.6. Geography
4. Premium Insights
4.1. STAR (Situation, Task, Action, Results) Analysis
4.2. Porter’s Five Forces Analysis
4.2.1. Threat of New Entrants
4.2.2. Bargaining Power of Buyers/Consumers
4.2.3. Bargaining Power of Suppliers
4.2.4. Threat of Substitute Types
4.2.5. Intensity of Competitive Rivalry
4.3. Key Market Trends
4.3.1. Demand Side Trends
4.3.2. Supply Side Trends
4.4. Value Chain Analysis
4.5. Technology Analysis
4.6. Analysis and Recommendations
4.7. Marketing Strategy Analysis
4.7.1. Direct Marketing
4.7.2. Indirect Marketing
4.7.3. Marketing Channel Development Trend
5. Market Positioning of Key Players, 2022
5.1. Company market share of key players, 2022
5.2. Competitive Benchmarking
5.3. Market Positioning of Key Vendors
5.4. Geographical Presence Analysis
5.5. Major Strategies Adopted by Key Players
5.5.1. Key Strategies Analysis
5.5.2. Mergers and Acquisitions
5.5.3. Partnerships
5.5.4. Product Launch
5.5.5. Geographical Expansion
5.5.6. Others
6. Economic Impact Analysis
6.1. Recession Impact
6.1.1. North America
6.1.2. Europe
6.1.3. Asia Pacific
6.1.4. Latin America
6.1.5. Middle East and Africa
6.2. Ukraine-Russia War Impact
6.2.1. North America
6.2.2. Europe
6.2.3. Asia Pacific
6.2.4. Latin America
6.2.5. Middle East and Africa
6.3. COVID-19 Impact Analysis
6.3.1. North America
6.3.2. Europe
6.3.3. Asia Pacific
6.3.4. Latin America
6.3.5. Middle East and Africa
7. Global Propane Powered Lawn Mowers Market, By Blade Type
7.1. Global Propane Powered Lawn Mowers Market Overview, By Blade Type
7.1.1. Global Propane Powered Lawn Mowers Market Revenue Share, By Blade Type, 2022 Vs 2030 (in %)
7.2. Standard Blades
7.2.1. Global Propane Powered Lawn Mowers Market, By Region, 2017-2030 (US$ Mn)
7.3. Mulching Blades
7.3.1. Global Propane Powered Lawn Mowers Market, By Region, 2017-2030 (US$ Mn)
7.4. Lifting Blades
7.4.1. Global Propane Powered Lawn Mowers Market, By Region, 2017-2030 (US$ Mn)
8. Global Propane Powered Lawn Mowers Market, by Start Type, 2017-2030 (US$ Mn)
8.1. Global Propane Powered Lawn Mowers Market Overview, by Start Type
8.1.1. Global Propane Powered Lawn Mowers Market, By Start Type, 2022 vs 2030 (in%)
8.2. Key Start
8.2.1. Global Propane Powered Lawn Mowers Market, By Region, 2017-2030 (US$ Mn)
8.3. Push Start
8.3.1. Global Propane Powered Lawn Mowers Market, By Region, 2017-2030 (US$ Mn)
8.4. Recoil Start
8.4.1. Global Propane Powered Lawn Mowers Market, By Region, 2017-2030 (US$ Mn)
9. Global Propane Powered Lawn Mowers Market, by End-User, 2017-2030 (US$ Mn)
9.1. Global Propane Powered Lawn Mowers Market Overview, by End-User
9.1.1. Global Propane Powered Lawn Mowers Market, By End-User, 2022 vs 2030 (in%)
9.2. Professional Landscaping Services
9.2.1. Global Propane Powered Lawn Mowers Market, By Region, 2017-2030 (US$ Mn)
9.3. Golf Courses & Other Sports Arenas
9.3.1. Global Propane Powered Lawn Mowers Market, By Region, 2017-2030 (US$ Mn)
9.4. Residential
9.4.1. Global Propane Powered Lawn Mowers Market, By Region, 2017-2030 (US$ Mn)
9.5. Government
9.5.1. Global Propane Powered Lawn Mowers Market, By Region, 2017-2030 (US$ Mn)
9.6. Others
9.6.1. Global Propane Powered Lawn Mowers Market, By Region, 2017-2030 (US$ Mn)
10. Global Propane Powered Lawn Mowers Market, by Product, 2017-2030 (US$ Mn)
10.1. Global Propane Powered Lawn Mowers Market Overview, by Product
10.1.1. Global Propane Powered Lawn Mowers Market, By Product, 2022 vs 2030 (in%)
10.2. Ride-On
10.2.1. Global Propane Powered Lawn Mowers Market, By Region, 2017-2030 (US$ Mn)
10.3. Walk-Behind
10.3.1. Global Propane Powered Lawn Mowers Market, By Region, 2017-2030 (US$ Mn)
11. Global Propane Powered Lawn Mowers Market, by Distribution Channel, 2017-2030 (US$ Mn)
11.1. Global Propane Powered Lawn Mowers Market Overview, by Distribution Channel
11.1.1. Global Propane Powered Lawn Mowers Market, By Distribution Channel, 2022 vs 2030 (in%)
11.2. Offline
11.2.1. Global Propane Powered Lawn Mowers Market, By Region, 2017-2030 (US$ Mn)
11.3. Online
11.3.1. Global Propane Powered Lawn Mowers Market, By Region, 2017-2030 (US$ Mn)
12. Global Propane Powered Lawn Mowers Market, By Region
12.1. Global Propane Powered Lawn Mowers Market Overview, by Region
12.1.1. Global Propane Powered Lawn Mowers Market, By Region, 2022 vs 2030 (in%)
12.2. Blade Type
12.2.1. Global Propane Powered Lawn Mowers Market, By Blade Type, 2017-2030 (US$ Mn)
12.3. End-User
12.3.1. Global Propane Powered Lawn Mowers Market, By End-User, 2017-2030 (US$ Mn)
12.4. Product
12.4.1. Global Propane Powered Lawn Mowers Market, By Product, 2017-2030 (US$ Mn)
12.5. Distribution Channel
12.5.1. Global Propane Powered Lawn Mowers Market, By Distribution Channel, 2017-2030 (US$ Mn)
12.6. Start Type
12.6.1. Global Propane Powered Lawn Mowers Market, By Start Type, 2017-2030 (US$ Mn)
13. North America Propane Powered Lawn Mowers Market Analysis
13.1. North America Propane Powered Lawn Mowers Market, By Blade Type, 2017-2030(US$ Mn)
13.1.1. Overview
13.1.2. SRC Analysis
13.2. North America Propane Powered Lawn Mowers Market, by Start Type, 2017-2030(US$ Mn)
13.2.1. Overview
13.2.2. SRC Analysis
13.3. North America Propane Powered Lawn Mowers Market, by End-User, 2017-2030(US$ Mn)
13.3.1. Overview
13.3.2. SRC Analysis
13.4. North America Propane Powered Lawn Mowers Market, by Product, 2017-2030(US$ Mn)
13.4.1. Overview
13.4.2. SRC Analysis
13.5. North America Propane Powered Lawn Mowers Market, by Distribution Channel, 2017-2030(US$ Mn)
13.5.1. Overview
13.5.2. SRC Analysis
13.6. North America Propane Powered Lawn Mowers Market, by Country, 2017-2030 (US$ Mn)
13.6.1. North America Propane Powered Lawn Mowers Market, by Country, 2022 Vs 2030 (in%)
13.6.2. U.S.
13.6.2.1. U.S. Propane Powered Lawn Mowers Market Estimates and Forecast, 2017-2030 (US$ Mn)
13.6.2.2. U.S. Propane Powered Lawn Mowers, By Blade Type, 2017-2030 (US$ Mn)
13.6.2.3. U.S. Propane Powered Lawn Mowers, By Start Type, 2017-2030 (US$ Mn)
13.6.2.4. U.S. Propane Powered Lawn Mowers, By Product, 2017-2030 (US$ Mn)
13.6.2.5. U.S. Propane Powered Lawn Mowers, By End-User, 2017-2030 (US$ Mn)
13.6.2.6. U.S. Propane Powered Lawn Mowers, By Distribution Channel, 2017-2030 (US$ Mn)
13.6.3. Canada
13.6.3.1. Canada Propane Powered Lawn Mowers Market Estimates and Forecast, 2017-2030 (US$ Mn)
13.6.3.2. Canada Propane Powered Lawn Mowers, By Blade Type, 2017-2030 (US$ Mn)
13.6.3.3. Canada Propane Powered Lawn Mowers, By Start Type, 2017-2030 (US$ Mn)
13.6.3.4. Canada Propane Powered Lawn Mowers, By Product, 2017-2030 (US$ Mn)
13.6.3.5. Canada Propane Powered Lawn Mowers, By End-User, 2017-2030 (US$ Mn)
13.6.3.6. Canada Propane Powered Lawn Mowers, By Distribution Channel, 2017-2030 (US$ Mn)
13.6.4. Mexico
13.6.4.1. Mexico Propane Powered Lawn Mowers Market Estimates and Forecast, 2017-2030 (US$ Mn)
13.6.4.2. Mexico Propane Powered Lawn Mowers, By Blade Type, 2017-2030 (US$ Mn)
13.6.4.3. Mexico Propane Powered Lawn Mowers, By Start Type, 2017-2030 (US$ Mn)
13.6.4.4. Mexico Propane Powered Lawn Mowers, By Product, 2017-2030 (US$ Mn)
13.6.4.5. Mexico Propane Powered Lawn Mowers, By End-User, 2017-2030 (US$ Mn)
13.6.4.6. Mexico Propane Powered Lawn Mowers, By Distribution Channel, 2017-2030 (US$ Mn)
14. Europe Propane Powered Lawn Mowers Market Analysis
14.1. Europe Propane Powered Lawn Mowers Market, By Blade Type, 2017-2030(US$ Mn)
14.1.1. Overview
14.1.2. SRC Analysis
14.2. Europe Propane Powered Lawn Mowers Market, by Start Type, 2017-2030(US$ Mn)
14.2.1. Overview
14.2.2. SRC Analysis
14.3. Europe Propane Powered Lawn Mowers Market, by End-User, 2017-2030(US$ Mn)
14.3.1. Overview
14.3.2. SRC Analysis
14.4. Europe Propane Powered Lawn Mowers Market, by Product, 2017-2030(US$ Mn)
14.4.1. Overview
14.4.2. SRC Analysis
14.5. Europe Propane Powered Lawn Mowers Market, by Distribution Channel, 2017-2030(US$ Mn)
14.5.1. Overview
14.5.2. SRC Analysis
14.6. Europe Propane Powered Lawn Mowers Market, by Country, 2017-2030 (US$ Mn)
14.6.1. Europe Propane Powered Lawn Mowers Market, by Country, 2022 Vs 2030 (in%)
14.6.2. Germany
14.6.2.1. Germany Propane Powered Lawn Mowers Market Estimates and Forecast, 2017-2030 (US$ Mn)
14.6.2.2. Germany Propane Powered Lawn Mowers, By Blade Type, 2017-2030 (US$ Mn)
14.6.2.3. Germany Propane Powered Lawn Mowers, By Start Type, 2017-2030 (US$ Mn)
14.6.2.4. Germany Propane Powered Lawn Mowers, By End-User, 2017-2030 (US$ Mn)
14.6.2.5. Germany Propane Powered Lawn Mowers, By Product, 2017-2030 (US$ Mn)
14.6.2.6. Germany Propane Powered Lawn Mowers, By Distribution Channel, 2017-2030 (US$ Mn)
14.6.3. France
14.6.3.1. France Propane Powered Lawn Mowers Market Estimates and Forecast, 2017-2030 (US$ Mn)
14.6.3.2. France Propane Powered Lawn Mowers, By Blade Type, 2017-2030 (US$ Mn)
14.6.3.3. France Propane Powered Lawn Mowers, By Start Type, 2017-2030 (US$ Mn)
14.6.3.4. France Propane Powered Lawn Mowers, By End-User, 2017-2030 (US$ Mn)
14.6.3.5. France Propane Powered Lawn Mowers, By Product, 2017-2030 (US$ Mn)
14.6.3.6. France Propane Powered Lawn Mowers, By Distribution Channel, 2017-2030 (US$ Mn)
14.6.4. UK
14.6.4.1. UK Propane Powered Lawn Mowers Market Estimates and Forecast, 2017-2030 (US$ Mn)
14.6.4.2. UK Propane Powered Lawn Mowers, By Blade Type, 2017-2030 (US$ Mn)
14.6.4.3. UK Propane Powered Lawn Mowers, By Start Type, 2017-2030 (US$ Mn)
14.6.4.4. UK Propane Powered Lawn Mowers, By End-User, 2017-2030 (US$ Mn)
14.6.4.5. UK Propane Powered Lawn Mowers, By Product, 2017-2030 (US$ Mn)
14.6.4.6. UK Propane Powered Lawn Mowers, By Distribution Channel, 2017-2030 (US$ Mn)
14.6.5. Italy
14.6.5.1. Italy Propane Powered Lawn Mowers Market Estimates and Forecast, 2017-2030 (US$ Mn)
14.6.5.2. Italy Propane Powered Lawn Mowers, By Blade Type, 2017-2030 (US$ Mn)
14.6.5.3. Italy Propane Powered Lawn Mowers, By Start Type, 2017-2030 (US$ Mn)
14.6.5.4. Italy Propane Powered Lawn Mowers, By End-User, 2017-2030 (US$ Mn)
14.6.5.5. Italy Propane Powered Lawn Mowers, By Product, 2017-2030 (US$ Mn)
14.6.5.6. Italy Propane Powered Lawn Mowers, By Distribution Channel, 2017-2030 (US$ Mn)
14.6.6. Spain
14.6.6.1. Spain Propane Powered Lawn Mowers Market Estimates and Forecast, 2017-2030 (US$ Mn)
14.6.6.2. Spain Propane Powered Lawn Mowers, By Blade Type, 2017-2030 (US$ Mn)
14.6.6.3. Spain Propane Powered Lawn Mowers, By Start Type, 2017-2030 (US$ Mn)
14.6.6.4. Spain Propane Powered Lawn Mowers, By End-User, 2017-2030 (US$ Mn)
14.6.6.5. Spain Propane Powered Lawn Mowers, By Product, 2017-2030 (US$ Mn)
14.6.6.6. Spain Propane Powered Lawn Mowers, By Distribution Channel, 2017-2030 (US$ Mn)
14.6.7. Rest of Europe
14.6.7.1. Rest of Europe Propane Powered Lawn Mowers Market Estimates and Forecast, 2017-2030 (US$ Mn)
14.6.7.2. Rest of Europe Propane Powered Lawn Mowers, By Blade Type, 2017-2030 (US$ Mn)
14.6.7.3. Rest of Europe Propane Powered Lawn Mowers, By Start Type, 2017-2030 (US$ Mn)
14.6.7.4. Rest of Europe Propane Powered Lawn Mowers, By End-User, 2017-2030 (US$ Mn)
14.6.7.5. Rest of Europe Propane Powered Lawn Mowers, By Product, 2017-2030 (US$ Mn)
14.6.7.6. Rest of Europe Propane Powered Lawn Mowers, By Distribution Channel, 2017-2030 (US$ Mn)
15. Asia Pacific Propane Powered Lawn Mowers Market Analysis
15.1. Asia Pacific Propane Powered Lawn Mowers Market, By Blade Type, 2017-2030(US$ Mn)
15.1.1. Overview
15.1.2. SRC Analysis
15.2. Asia Pacific Propane Powered Lawn Mowers Market, by Start Type, 2017-2030(US$ Mn)
15.2.1. Overview
15.2.2. SRC Analysis
15.3. Asia Pacific Propane Powered Lawn Mowers Market, by End-User, 2017-2030(US$ Mn)
15.3.1. Overview
15.3.2. SRC Analysis
15.4. Asia Pacific Propane Powered Lawn Mowers Market, by Product, 2017-2030(US$ Mn)
15.4.1. Overview
15.4.2. SRC Analysis
15.5. Asia Pacific Propane Powered Lawn Mowers Market, by Distribution Channel, 2017-2030(US$ Mn)
15.5.1. Overview
15.5.2. SRC Analysis
15.6. Asia Pacific Propane Powered Lawn Mowers Market, by Country, 2017-2030 (US$ Mn)
15.6.1. Asia Pacific Propane Powered Lawn Mowers Market, by Country, 2022 Vs 2030 (in%)
15.6.2. China
15.6.2.1. China Propane Powered Lawn Mowers Market Estimates and Forecast, 2017-2030 (US$ Mn)
15.6.2.2. China Propane Powered Lawn Mowers, By Blade Type, 2017-2030 (US$ Mn)
15.6.2.3. China Propane Powered Lawn Mowers, By Start Type, 2017-2030 (US$ Mn)
15.6.2.4. China Propane Powered Lawn Mowers, By End-User, 2017-2030 (US$ Mn)
15.6.2.5. China Propane Powered Lawn Mowers, By Product, 2017-2030 (US$ Mn)
15.6.2.6. China Propane Powered Lawn Mowers, By Distribution Channel, 2017-2030 (US$ Mn)
15.6.3. Japan
15.6.3.1. Japan Propane Powered Lawn Mowers Market Estimates and Forecast, 2017-2030 (US$ Mn)
15.6.3.2. Japan Propane Powered Lawn Mowers, By Blade Type, 2017-2030 (US$ Mn)
15.6.3.3. Japan Propane Powered Lawn Mowers, By Start Type, 2017-2030 (US$ Mn)
15.6.3.4. Japan Propane Powered Lawn Mowers, By End-User, 2017-2030 (US$ Mn)
15.6.3.5. Japan Propane Powered Lawn Mowers, By Product, 2017-2030 (US$ Mn)
15.6.3.6. Japan Propane Powered Lawn Mowers, By Distribution Channel, 2017-2030 (US$ Mn)
15.6.4. India
15.6.4.1. India Propane Powered Lawn Mowers Market Estimates and Forecast, 2017-2030 (US$ Mn)
15.6.4.2. India Propane Powered Lawn Mowers, By Blade Type, 2017-2030 (US$ Mn)
15.6.4.3. India Propane Powered Lawn Mowers, By Start Type, 2017-2030 (US$ Mn)
15.6.4.4. India Propane Powered Lawn Mowers, By End-User, 2017-2030 (US$ Mn)
15.6.4.5. India Propane Powered Lawn Mowers, By Product, 2017-2030 (US$ Mn)
15.6.4.6. India Propane Powered Lawn Mowers, By Distribution Channel, 2017-2030 (US$ Mn)
15.6.5. South Korea
15.6.5.1. South Korea Propane Powered Lawn Mowers Market Estimates and Forecast, 2017-2030 (US$ Mn)
15.6.5.2. South Korea Propane Powered Lawn Mowers, By Blade Type, 2017-2030 (US$ Mn)
15.6.5.3. South Korea Propane Powered Lawn Mowers, By Start Type, 2017-2030 (US$ Mn)
15.6.5.4. South Korea Propane Powered Lawn Mowers, By End-User, 2017-2030 (US$ Mn)
15.6.5.5. South Korea Propane Powered Lawn Mowers, By Product, 2017-2030 (US$ Mn)
15.6.5.6. South Korea Propane Powered Lawn Mowers, By Distribution Channel, 2017-2030 (US$ Mn)
15.6.6. South-East Asia
15.6.6.1. South-East Asia Propane Powered Lawn Mowers Market Estimates and Forecast, 2017-2030 (US$ Mn)
15.6.6.2. South-East Asia Propane Powered Lawn Mowers, By Blade Type, 2017-2030 (US$ Mn)
15.6.6.3. South-East Asia Propane Powered Lawn Mowers, By Start Type, 2017-2030 (US$ Mn)
15.6.6.4. South-East Asia Propane Powered Lawn Mowers, By End-User, 2017-2030 (US$ Mn)
15.6.6.5. South-East Asia Propane Powered Lawn Mowers, By Product, 2017-2030 (US$ Mn)
15.6.6.6. South-East Asia Propane Powered Lawn Mowers, By Distribution Channel, 2017-2030 (US$ Mn)
15.6.7. Rest of Asia Pacific
15.6.7.1. Rest of Asia Pacific Propane Powered Lawn Mowers Market Estimates and Forecast, 2017-2030 (US$ Mn)
15.6.7.2. Rest of Asia Pacific Propane Powered Lawn Mowers, By Blade Type, 2017-2030 (US$ Mn)
15.6.7.3. Rest of Asia Pacific Propane Powered Lawn Mowers, By Start Type, 2017-2030 (US$ Mn)
15.6.7.4. Rest of Asia Pacific Propane Powered Lawn Mowers, By End-User, 2017-2030 (US$ Mn)
15.6.7.5. Rest of Asia Pacific Propane Powered Lawn Mowers, By Product, 2017-2030 (US$ Mn)
15.6.7.6. Rest of Asia Pacific Propane Powered Lawn Mowers, By Distribution Channel, 2017-2030 (US$ Mn)
16. Latin America Propane Powered Lawn Mowers Market Analysis
16.1. Latin America Propane Powered Lawn Mowers Market, By Blade Type, 2017-2030(US$ Mn)
16.1.1. Overview
16.1.2. SRC Analysis
16.2. Latin America Propane Powered Lawn Mowers Market, by Start Type, 2017-2030(US$ Mn)
16.2.1. Overview
16.2.2. SRC Analysis
16.3. Latin America Propane Powered Lawn Mowers Market, by End-User, 2017-2030(US$ Mn)
16.3.1. Overview
16.3.2. SRC Analysis
16.4. Latin America Propane Powered Lawn Mowers Market, by Product, 2017-2030(US$ Mn)
16.4.1. Overview
16.4.2. SRC Analysis
16.5. Latin America Propane Powered Lawn Mowers Market, by Distribution Channel, 2017-2030(US$ Mn)
16.5.1. Overview
16.5.2. SRC Analysis
16.6. Latin America Propane Powered Lawn Mowers Market, by Country, 2017-2030 (US$ Mn)
16.6.1. Latin America Propane Powered Lawn Mowers Market, by Country, 2022 Vs 2030 (in%)
16.6.2. Brazil
16.6.2.1. Brazil Propane Powered Lawn Mowers Market Estimates and Forecast, 2017-2030 (US$ Mn)
16.6.2.2. Brazil Propane Powered Lawn Mowers, By Blade Type, 2017-2030 (US$ Mn)
16.6.2.3. Brazil Propane Powered Lawn Mowers, By Start Type, 2017-2030 (US$ Mn)
16.6.2.4. Brazil Propane Powered Lawn Mowers, By End-User, 2017-2030 (US$ Mn)
16.6.2.5. Brazil Propane Powered Lawn Mowers, By Product, 2017-2030 (US$ Mn)
16.6.2.6. Brazil Propane Powered Lawn Mowers, By Distribution Channel, 2017-2030 (US$ Mn)
16.6.3. Argentina
16.6.3.1. Argentina Propane Powered Lawn Mowers Market Estimates and Forecast, 2017-2030 (US$ Mn)
16.6.3.2. Argentina Propane Powered Lawn Mowers, By Blade Type, 2017-2030 (US$ Mn)
16.6.3.3. Argentina Propane Powered Lawn Mowers, By Start Type, 2017-2030 (US$ Mn)
16.6.3.4. Argentina Propane Powered Lawn Mowers, By End-User, 2017-2030 (US$ Mn)
16.6.3.5. Argentina Propane Powered Lawn Mowers, By Product, 2017-2030 (US$ Mn)
16.6.3.6. Argentina Propane Powered Lawn Mowers, By Distribution Channel, 2017-2030 (US$ Mn)
16.6.4. Rest of Latin America
16.6.4.1. Rest of Latin America Propane Powered Lawn Mowers Market Estimates and Forecast, 2017-2030 (US$ Mn)
16.6.4.2. Rest of Latin America Propane Powered Lawn Mowers, By Blade Type, 2017-2030 (US$ Mn)
16.6.4.3. Rest of Latin America Propane Powered Lawn Mowers, By Start Type, 2017-2030 (US$ Mn)
16.6.4.4. Rest of Latin America Propane Powered Lawn Mowers, By End-User, 2017-2030 (US$ Mn)
16.6.4.5. Rest of Latin America Propane Powered Lawn Mowers, By Product, 2017-2030 (US$ Mn)
16.6.4.6. Rest of Latin America Propane Powered Lawn Mowers, By Distribution Channel, 2017-2030 (US$ Mn)
17. Middle East and Africa Propane Powered Lawn Mowers Market Analysis
17.1. Middle East and Africa Propane Powered Lawn Mowers Market, By Blade Type, 2017-2030(US$ Mn)
17.1.1. Overview
17.1.2. SRC Analysis
17.2. Middle East and Africa Propane Powered Lawn Mowers Market, by Start Type, 2017-2030(US$ Mn)
17.2.1. Overview
17.2.2. SRC Analysis
17.3. Middle East and Africa Propane Powered Lawn Mowers Market, by End-User, 2017-2030(US$ Mn)
17.3.1. Overview
17.3.2. SRC Analysis
17.4. Middle East and Africa Propane Powered Lawn Mowers Market, by Product, 2017-2030(US$ Mn)
17.4.1. Overview
17.4.2. SRC Analysis
17.5. Middle East and Africa Propane Powered Lawn Mowers Market, by Distribution Channel, 2017-2030(US$ Mn)
17.5.1. Overview
17.5.2. SRC Analysis
17.6. Middle East and Africa Propane Powered Lawn Mowers Market, by Country, 2017-2030 (US$ Mn)
17.6.1. Middle East and Africa Propane Powered Lawn Mowers Market, by Country, 2022 Vs 2030 (in%)
17.6.2. GCC Countries
17.6.2.1. GCC Countries Propane Powered Lawn Mowers Market Estimates and Forecast, 2017-2030 (US$ Mn)
17.6.2.2. GCC Countries Propane Powered Lawn Mowers, By Blade Type, 2017-2030 (US$ Mn)
17.6.2.3. GCC Countries Propane Powered Lawn Mowers, By Start Type, 2017-2030 (US$ Mn)
17.6.2.4. GCC Countries Propane Powered Lawn Mowers, By End-User, 2017-2030 (US$ Mn)
17.6.2.5. GCC Countries Propane Powered Lawn Mowers, By Product, 2017-2030 (US$ Mn)
17.6.2.6. GCC Countries Propane Powered Lawn Mowers, By Distribution Channel, 2017-2030 (US$ Mn)
17.6.3. South Africa
17.6.3.1. South Africa Propane Powered Lawn Mowers Market Estimates and Forecast, 2017-2030 (US$ Mn)
17.6.3.2. South Africa Propane Powered Lawn Mowers, By Blade Type, 2017-2030 (US$ Mn)
17.6.3.3. South Africa Propane Powered Lawn Mowers, By Start Type, 2017-2030 (US$ Mn)
17.6.3.4. South Africa Propane Powered Lawn Mowers, By End-User, 2017-2030 (US$ Mn)
17.6.3.5. South Africa Propane Powered Lawn Mowers, By Product, 2017-2030 (US$ Mn)
17.6.3.6. South Africa Propane Powered Lawn Mowers, By Distribution Channel, 2017-2030 (US$ Mn)
17.6.4. Rest of Middle East and Africa
17.6.4.1. Rest of Middle East and Africa Propane Powered Lawn Mowers Market Estimates and Forecast, 2017-2030 (US$ Mn)
17.6.4.2. Rest of Middle East and Africa Propane Powered Lawn Mowers, By Blade Type, 2017-2030 (US$ Mn)
17.6.4.3. Rest of Middle East and Africa Propane Powered Lawn Mowers, By Start Type, 2017-2030 (US$ Mn)
17.6.4.4. Rest of Middle East and Africa Propane Powered Lawn Mowers, By End-User, 2017-2030 (US$ Mn)
17.6.4.5. Rest of Middle East and Africa Propane Powered Lawn Mowers, By Product, 2017-2030 (US$ Mn)
17.6.4.6. Rest of Middle East and Africa Propane Powered Lawn Mowers, By Distribution Channel, 2017-2030 (US$ Mn)
18. Company Profiles
18.1. AriensCo
18.1.1. Company Overview
18.1.2. Products/Services Portfolio
18.1.3. Geographical Presence
18.1.4. Financial Summary
18.1.4.1. Market Revenue and Net Profit (2019-2022)
18.1.4.2. Business Segment Revenue Analysis
18.1.4.3. Geographical Revenue Analysis
18.2. Husqvarna Group
18.3. Kubota Corporation
18.4. Stanley Black & Decker
18.5. The Toro Company

List of Figures
FIG. 1 Global Propane Powered Lawn Mowers Market: Research Methodology
FIG. 2 Market Size Estimation – Top Down & Bottom up Approach
FIG. 3 Global Propane Powered Lawn Mowers Market Segmentation
FIG. 4 Global Propane Powered Lawn Mowers Market, By Blade Type, 2022 (US$ Mn)
FIG. 5 Global Propane Powered Lawn Mowers Market, by Start Type, 2022 (US$ Mn)
FIG. 6 Global Propane Powered Lawn Mowers Market, by End-User, 2022 (US$ Mn)
FIG. 7 Global Propane Powered Lawn Mowers Market, by Product, 2022 (US$ Mn)
FIG. 8 Global Propane Powered Lawn Mowers Market, by Distribution Channel, 2022 (US$ Mn)
FIG. 9 Global Propane Powered Lawn Mowers Market, by Geography, 2022 (US$ Mn)
FIG. 10 Attractive Investment Proposition, By Blade Type, 2022
FIG. 11 Attractive Investment Proposition, by Start Type, 2022
FIG. 12 Attractive Investment Proposition, by End-User, 2022
FIG. 13 Attractive Investment Proposition, by Product, 2022
FIG. 14 Attractive Investment Proposition, by Distribution Channel, 2022
FIG. 15 Attractive Investment Proposition, by Geography, 2022
FIG. 16 Global Market Share Analysis of Key Propane Powered Lawn Mowers Market Manufacturers, 2022
FIG. 17 Global Market Positioning of Key Propane Powered Lawn Mowers Market Manufacturers, 2022
FIG. 18 Global Propane Powered Lawn Mowers Market Value Contribution, By Blade Type, 2022 & 2030 (Value %)
FIG. 19 Global Propane Powered Lawn Mowers Market, by Standard Blades Propane Powered Lawn Mowers, Value, 2017-2030 (US$ Mn)
FIG. 20 Global Propane Powered Lawn Mowers Market, by Mulching Blades Propane Powered Lawn Mowers, Value, 2017-2030 (US$ Mn)
FIG. 21 Global Propane Powered Lawn Mowers Market, by Lifting Blades , Value, 2017-2030 (US$ Mn)
FIG. 22 Global Propane Powered Lawn Mowers Market Value Contribution, By Start Type, 2022 & 2030 (Value %)
FIG. 23 Global Propane Powered Lawn Mowers Market, by Key Start, Value, 2017-2030 (US$ Mn)
FIG. 24 Global Propane Powered Lawn Mowers Market, by Push Start, 2017-2030 (US$ Mn)
FIG. 25 Global Propane Powered Lawn Mowers Market, by Recoil Start, 2017-2030 (US$ Mn)
FIG. 26 Global Propane Powered Lawn Mowers Market Value Contribution, By End-User, 2022 & 2030 (Value %)
FIG. 27 Global Propane Powered Lawn Mowers Market, by Professional Landscaping Services, Value, 2017-2030 (US$ Mn)
FIG. 28 Global Propane Powered Lawn Mowers Market, by Golf Courses & Other Sports Arenas, 2017-2030 (US$ Mn)
FIG. 29 Global Propane Powered Lawn Mowers Market, by Residential, 2017-2030 (US$ Mn)
FIG. 30 Global Propane Powered Lawn Mowers Market, by Government, 2017-2030 (US$ Mn)
FIG. 31 Global Propane Powered Lawn Mowers Market, by Others, 2017-2030 (US$ Mn)
FIG. 32 Global Propane Powered Lawn Mowers Market Value Contribution, By Product, 2022 & 2030 (Value %)
FIG. 33 Global Propane Powered Lawn Mowers Market, by Ride-On, Value, 2017-2030 (US$ Mn)
FIG. 34 Global Propane Powered Lawn Mowers Market, by Walk-Behind, 2017-2030 (US$ Mn)
FIG. 35 Global Propane Powered Lawn Mowers Market Value Contribution, By Distribution Channel, 2022 & 2030 (Value %)
FIG. 36 Global Propane Powered Lawn Mowers Market, by Offline, Value, 2017-2030 (US$ Mn)
FIG. 37 Global Propane Powered Lawn Mowers Market, by Online, 2017-2030 (US$ Mn)
FIG. 38 North America Propane Powered Lawn Mowers Market, 2017-2030 (US$ Mn)
FIG. 39 U.S. Propane Powered Lawn Mowers Market, 2017-2030 (US$ Mn)
FIG. 40 Canada Propane Powered Lawn Mowers Market, 2017-2030 (US$ Mn)
FIG. 41 Europe Propane Powered Lawn Mowers Market, 2017-2030 (US$ Mn)
FIG. 42 Germany Propane Powered Lawn Mowers Market, 2017-2030 (US$ Mn)
FIG. 43 France Propane Powered Lawn Mowers Market, 2017-2030 (US$ Mn)
FIG. 44 U.K. Propane Powered Lawn Mowers Market, 2017-2030 (US$ Mn)
FIG. 45 Italy Propane Powered Lawn Mowers Market, 2017-2030 (US$ Mn)
FIG. 46 Spain Propane Powered Lawn Mowers Market, 2017-2030 (US$ Mn)
FIG. 47 Rest of Europe Propane Powered Lawn Mowers Market, 2017-2030 (US$ Mn)
FIG. 48 Asia Pacific Propane Powered Lawn Mowers Market, 2017-2030 (US$ Mn)
FIG. 49 China Propane Powered Lawn Mowers Market, 2017-2030 (US$ Mn)
FIG. 50 Japan Propane Powered Lawn Mowers Market, 2017-2030 (US$ Mn)
FIG. 51 India Propane Powered Lawn Mowers Market, 2017-2030 (US$ Mn)
FIG. 52 South Korea Propane Powered Lawn Mowers Market, 2017-2030 (US$ Mn)
FIG. 53 South-East Asia Propane Powered Lawn Mowers Market, 2017-2030 (US$ Mn)
FIG. 54 Rest of Asia Pacific Propane Powered Lawn Mowers Market, 2017-2030 (US$ Mn)
FIG. 55 Latin America Propane Powered Lawn Mowers Market, 2017-2030 (US$ Mn)
FIG. 56 Brazil Propane Powered Lawn Mowers Market, 2017-2030 (US$ Mn)
FIG. 57 Mexico Propane Powered Lawn Mowers Market, 2017-2030 (US$ Mn)
FIG. 58 Rest of Latin America Propane Powered Lawn Mowers Market, 2017-2030 (US$ Mn)
FIG. 59 Middle East & Africa Propane Powered Lawn Mowers Market, 2017-2030 (US$ Mn)
FIG. 60 GCC Countries Propane Powered Lawn Mowers Market, 2017-2030 (US$ Mn)
FIG. 61 South Africa Propane Powered Lawn Mowers Market, 2017-2030 (US$ Mn)
FIG. 62 Rest of Middle East and Africa Propane Powered Lawn Mowers Market, 2017-2030 (US$ Mn)

List of Tables
TABLE 1 Market Snapshot: Global Propane Powered Lawn Mowers Market
TABLE 2 Global Propane Powered Lawn Mowers Market: Market Drivers Impact Analysis
TABLE 3 Global Propane Powered Lawn Mowers Market: Market Restraints Impact Analysis
TABLE 4 Global Propane Powered Lawn Mowers Market, by Competitive Benchmarking, 2022
TABLE 5 Global Propane Powered Lawn Mowers Market, by Geographical Presence Analysis, 2022
TABLE 6 Global Propane Powered Lawn Mowers Market, by Key Strategies Analysis, 2022
TABLE 7 Global Propane Powered Lawn Mowers Market, by Standard Blades Propane Powered Lawn Mowers, By Region, 2017-2022 (US$ Mn)
TABLE 8 Global Propane Powered Lawn Mowers Market, by Standard Blades Propane Powered Lawn Mowers, By Region, 2023-2030 (US$ Mn)
TABLE 9 Global Propane Powered Lawn Mowers Market, by Mulching Blades Propane Powered Lawn Mowers, By Region, 2017-2022 (US$ Mn)
TABLE 10 Global Propane Powered Lawn Mowers Market, by Mulching Blades Propane Powered Lawn Mowers, By Region, 2023-2030 (US$ Mn)
TABLE 11 Global Propane Powered Lawn Mowers Market, by Lifting Blades, By Region, 2017-2022 (US$ Mn)
TABLE 12 Global Propane Powered Lawn Mowers Market, by Lifting Blades, By Region, 2023-2030 (US$ Mn)
TABLE 13 Global Propane Powered Lawn Mowers Market, by Key Start, By Region, 2017-2022 (US$ Mn)
TABLE 14 Global Propane Powered Lawn Mowers Market, by Key Start, By Region, 2023-2030 (US$ Mn)
TABLE 15 Global Propane Powered Lawn Mowers Market, by Push Start, By Region, 2017-2022 (US$ Mn)
TABLE 16 Global Propane Powered Lawn Mowers Market, by Push Start, By Region, 2023-2030 (US$ Mn)
TABLE 17 Global Propane Powered Lawn Mowers Market, by Recoil Start, By Region, 2017-2022 (US$ Mn)
TABLE 18 Global Propane Powered Lawn Mowers Market, by Recoil Start, By Region, 2023-2030 (US$ Mn)
TABLE 19 Global Propane Powered Lawn Mowers Market, by Professional Landscaping Services, By Region, 2017-2022 (US$ Mn)
TABLE 20 Global Propane Powered Lawn Mowers Market, by Professional Landscaping Services, By Region, 2023-2030 (US$ Mn)
TABLE 21 Global Propane Powered Lawn Mowers Market, by Golf Courses & Other Sports Arenas, By Region, 2017-2022 (US$ Mn)
TABLE 22 Global Propane Powered Lawn Mowers Market, by Golf Courses & Other Sports Arenas, By Region, 2023-2030 (US$ Mn)
TABLE 23 Global Propane Powered Lawn Mowers Market, by Residential, By Region, 2017-2022 (US$ Mn)
TABLE 24 Global Propane Powered Lawn Mowers Market, by Residential, By Region, 2023-2030 (US$ Mn)
TABLE 25 Global Propane Powered Lawn Mowers Market, by Government, By Region, 2017-2022 (US$ Mn)
TABLE 26 Global Propane Powered Lawn Mowers Market, by Government, By Region, 2023-2030 (US$ Mn)
TABLE 27 Global Propane Powered Lawn Mowers Market, by Others, By Region, 2017-2022 (US$ Mn)
TABLE 28 Global Propane Powered Lawn Mowers Market, by Others, By Region, 2023-2030 (US$ Mn)
TABLE 29 Global Propane Powered Lawn Mowers Market, by Ride-On, By Region, 2017-2022 (US$ Mn)
TABLE 30 Global Propane Powered Lawn Mowers Market, by Ride-On, By Region, 2023-2030 (US$ Mn)
TABLE 31 Global Propane Powered Lawn Mowers Market, by Walk-Behind, By Region, 2017-2022 (US$ Mn)
TABLE 32 Global Propane Powered Lawn Mowers Market, by Walk-Behind, By Region, 2023-2030 (US$ Mn)
TABLE 33 Global Propane Powered Lawn Mowers Market, by Offline, By Region, 2017-2022 (US$ Mn)
TABLE 34 Global Propane Powered Lawn Mowers Market, by Offline, By Region, 2023-2030 (US$ Mn)
TABLE 35 Global Propane Powered Lawn Mowers Market, by Online, By Region, 2017-2022 (US$ Mn)
TABLE 36 Global Propane Powered Lawn Mowers Market, by Online, By Region, 2023-2030 (US$ Mn)
TABLE 37 Global Propane Powered Lawn Mowers Market, By Blade Type, 2017-2022 (US$ Mn)
TABLE 38 Global Propane Powered Lawn Mowers Market, By Blade Type, 2023-2030 (US$ Mn)
TABLE 39 Global Propane Powered Lawn Mowers Market, by Start Type, 2017-2022 (US$ Mn)
TABLE 40 Global Propane Powered Lawn Mowers Market, by Start Type, 2023-2030 (US$ Mn)
TABLE 41 Global Propane Powered Lawn Mowers Market, by End-User, 2017-2022 (US$ Mn)
TABLE 42 Global Propane Powered Lawn Mowers Market, by End-User, 2023-2030 (US$ Mn)
TABLE 43 Global Propane Powered Lawn Mowers Market, by Product, 2017-2022 (US$ Mn)
TABLE 44 Global Propane Powered Lawn Mowers Market, by Product, 2023-2030 (US$ Mn)
TABLE 45 Global Propane Powered Lawn Mowers Market, by Distribution Channel, 2017-2022 (US$ Mn)
TABLE 46 Global Propane Powered Lawn Mowers Market, by Distribution Channel, 2023-2030 (US$ Mn)
TABLE 47 Global Propane Powered Lawn Mowers Market, by Region, 2017-2022 (US$ Mn)
TABLE 48 Global Propane Powered Lawn Mowers Market, by Region, 2023-2030 (US$ Mn)
TABLE 49 North America Propane Powered Lawn Mowers Market, By Blade Type, 2017-2022 (US$ Mn)
TABLE 50 North America Propane Powered Lawn Mowers Market, By Blade Type, 2023-2030 (US$ Mn)
TABLE 51 North America Propane Powered Lawn Mowers Market, by Start Type, 2017-2022 (US$ Mn)
TABLE 52 North America Propane Powered Lawn Mowers Market, by Start Type, 2023-2030 (US$ Mn)
TABLE 53 North America Propane Powered Lawn Mowers Market, by End-User, 2017-2022 (US$ Mn)
TABLE 54 North America Propane Powered Lawn Mowers Market, by End-User, 2023-2030 (US$ Mn)
TABLE 55 North America Propane Powered Lawn Mowers Market, by Product, 2017-2022 (US$ Mn)
TABLE 56 North America Propane Powered Lawn Mowers Market, by Product, 2023-2030 (US$ Mn)
TABLE 57 North America Propane Powered Lawn Mowers Market, by Distribution Channel, 2017-2022 (US$ Mn)
TABLE 58 North America Propane Powered Lawn Mowers Market, by Distribution Channel, 2023-2030 (US$ Mn)
TABLE 59 North America Propane Powered Lawn Mowers Market, by Country, 2017-2022 (US$ Mn)
TABLE 60 North America Propane Powered Lawn Mowers Market, by Country, 2023-2030 (US$ Mn)
TABLE 61 United States Propane Powered Lawn Mowers Market, By Blade Type, 2017-2022 (US$ Mn)
TABLE 62 United States Propane Powered Lawn Mowers Market, By Blade Type, 2023-2030 (US$ Mn)
TABLE 63 United States Propane Powered Lawn Mowers Market, by Start Type, 2017-2022 (US$ Mn)
TABLE 64 United States Propane Powered Lawn Mowers Market, by Start Type, 2023-2030 (US$ Mn)
TABLE 65 United States Propane Powered Lawn Mowers Market, by End-User, 2017-2022 (US$ Mn)
TABLE 66 United States Propane Powered Lawn Mowers Market, by End-User, 2023-2030 (US$ Mn)
TABLE 67 United States Propane Powered Lawn Mowers Market, by Product, 2017-2022 (US$ Mn)
TABLE 68 United States Propane Powered Lawn Mowers Market, by Product, 2023-2030 (US$ Mn)
TABLE 69 United States Propane Powered Lawn Mowers Market, by Distribution Channel, 2017-2022 (US$ Mn)
TABLE 70 United States Propane Powered Lawn Mowers Market, by Distribution Channel, 2023-2030 (US$ Mn)
TABLE 71 Canada Propane Powered Lawn Mowers Market, By Blade Type, 2017-2022 (US$ Mn)
TABLE 72 Canada Propane Powered Lawn Mowers Market, By Blade Type, 2023-2030 (US$ Mn)
TABLE 73 Canada Propane Powered Lawn Mowers Market, by Start Type, 2017-2022 (US$ Mn)
TABLE 74 Canada Propane Powered Lawn Mowers Market, by Start Type, 2023-2030 (US$ Mn)
TABLE 75 Canada Propane Powered Lawn Mowers Market, by End-User, 2017-2022 (US$ Mn)
TABLE 76 Canada Propane Powered Lawn Mowers Market, by End-User, 2023-2030 (US$ Mn)
TABLE 77 Canada Propane Powered Lawn Mowers Market, by Product, 2017-2022 (US$ Mn)
TABLE 78 Canada Propane Powered Lawn Mowers Market, by Product, 2023-2030 (US$ Mn)
TABLE 79 Canada Propane Powered Lawn Mowers Market, by Distribution Channel, 2017-2022 (US$ Mn)
TABLE 80 Canada Propane Powered Lawn Mowers Market, by Distribution Channel, 2023-2030 (US$ Mn)
TABLE 81 Mexico Propane Powered Lawn Mowers Market, By Blade Type, 2017-2022 (US$ Mn)
TABLE 82 Mexico Propane Powered Lawn Mowers Market, By Blade Type, 2023-2030 (US$ Mn)
TABLE 83 Mexico Propane Powered Lawn Mowers Market, by Start Type, 2017-2022 (US$ Mn)
TABLE 84 Mexico Propane Powered Lawn Mowers Market, by Start Type, 2023-2030 (US$ Mn)
TABLE 85 Mexico Propane Powered Lawn Mowers Market, by End-User, 2017-2022 (US$ Mn)
TABLE 86 Mexico Propane Powered Lawn Mowers Market, by End-User, 2023-2030 (US$ Mn)
TABLE 87 Mexico Propane Powered Lawn Mowers Market, by Product, 2017-2022 (US$ Mn)
TABLE 88 Mexico Propane Powered Lawn Mowers Market, by Product, 2023-2030 (US$ Mn)
TABLE 89 Mexico Propane Powered Lawn Mowers Market, by Distribution Channel, 2017-2022 (US$ Mn)
TABLE 90 Mexico Propane Powered Lawn Mowers Market, by Distribution Channel, 2023-2030 (US$ Mn)
TABLE 91 Europe Propane Powered Lawn Mowers Market, By Blade Type, 2017-2022 (US$ Mn)
TABLE 92 Europe Propane Powered Lawn Mowers Market, By Blade Type, 2023-2030 (US$ Mn)
TABLE 93 Europe Propane Powered Lawn Mowers Market, by Start Type, 2017-2022 (US$ Mn)
TABLE 94 Europe Propane Powered Lawn Mowers Market, by Start Type, 2023-2030 (US$ Mn)
TABLE 95 Europe Propane Powered Lawn Mowers Market, by End-User, 2017-2022 (US$ Mn)
TABLE 96 Europe Propane Powered Lawn Mowers Market, by End-User, 2023-2030 (US$ Mn)
TABLE 97 Europe Propane Powered Lawn Mowers Market, by Product, 2017-2022 (US$ Mn)
TABLE 98 Europe Propane Powered Lawn Mowers Market, by Product, 2023-2030 (US$ Mn)
TABLE 99 Europe Propane Powered Lawn Mowers Market, by Distribution Channel, 2017-2022 (US$ Mn)
TABLE 100 Europe Propane Powered Lawn Mowers Market, by Distribution Channel, 2023-2030 (US$ Mn)
TABLE 101 Europe Propane Powered Lawn Mowers Market, by Country, 2017-2022 (US$ Mn)
TABLE 102 Europe Propane Powered Lawn Mowers Market, by Country, 2023-2030 (US$ Mn)
TABLE 103 Germany Propane Powered Lawn Mowers Market, By Blade Type, 2017-2022 (US$ Mn)
TABLE 104 Germany Propane Powered Lawn Mowers Market, By Blade Type, 2023-2030 (US$ Mn)
TABLE 105 Germany Propane Powered Lawn Mowers Market, by Start Type, 2017-2022 (US$ Mn)
TABLE 106 Germany Propane Powered Lawn Mowers Market, by Start Type, 2023-2030 (US$ Mn)
TABLE 107 Germany Propane Powered Lawn Mowers Market, by End-User, 2017-2022 (US$ Mn)
TABLE 108 Germany Propane Powered Lawn Mowers Market, by End-User, 2023-2030 (US$ Mn)
TABLE 109 Germany Propane Powered Lawn Mowers Market, by Product, 2017-2022 (US$ Mn)
TABLE 110 Germany Propane Powered Lawn Mowers Market, by Product, 2023-2030 (US$ Mn)
TABLE 111 Germany Propane Powered Lawn Mowers Market, by Distribution Channel, 2017-2022 (US$ Mn)
TABLE 112 Germany Propane Powered Lawn Mowers Market, by Distribution Channel, 2023-2030 (US$ Mn)
TABLE 113 France Propane Powered Lawn Mowers Market, By Blade Type, 2017-2022 (US$ Mn)
TABLE 114 France Propane Powered Lawn Mowers Market, By Blade Type, 2023-2030 (US$ Mn)
TABLE 115 France Propane Powered Lawn Mowers Market, by Start Type, 2017-2022 (US$ Mn)
TABLE 116 France Propane Powered Lawn Mowers Market, by Start Type, 2023-2030 (US$ Mn)
TABLE 117 France Propane Powered Lawn Mowers Market, by End-User, 2017-2022 (US$ Mn)
TABLE 118 France Propane Powered Lawn Mowers Market, by End-User, 2023-2030 (US$ Mn)
TABLE 119 France Propane Powered Lawn Mowers Market, by Product, 2017-2022 (US$ Mn)
TABLE 120 France Propane Powered Lawn Mowers Market, by Product, 2023-2030 (US$ Mn)
TABLE 121 France Propane Powered Lawn Mowers Market, by Distribution Channel, 2017-2022 (US$ Mn)
TABLE 122 France Propane Powered Lawn Mowers Market, by Distribution Channel, 2023-2030 (US$ Mn)
TABLE 123 United Kingdom Propane Powered Lawn Mowers Market, By Blade Type, 2017-2022 (US$ Mn)
TABLE 124 United Kingdom Propane Powered Lawn Mowers Market, By Blade Type, 2023-2030 (US$ Mn)
TABLE 125 United Kingdom Propane Powered Lawn Mowers Market, by Start Type, 2017-2022 (US$ Mn)
TABLE 126 United Kingdom Propane Powered Lawn Mowers Market, by Start Type, 2023-2030 (US$ Mn)
TABLE 127 United Kingdom Propane Powered Lawn Mowers Market, by End-User, 2017-2022 (US$ Mn)
TABLE 128 United Kingdom Propane Powered Lawn Mowers Market, by End-User, 2023-2030 (US$ Mn)
TABLE 129 United Kingdom Propane Powered Lawn Mowers Market, by Product, 2017-2022 (US$ Mn)
TABLE 130 United Kingdom Propane Powered Lawn Mowers Market, by Product, 2023-2030 (US$ Mn)
TABLE 131 United Kingdom Propane Powered Lawn Mowers Market, by Distribution Channel, 2017-2022 (US$ Mn)
TABLE 132 United Kingdom Propane Powered Lawn Mowers Market, by Distribution Channel, 2023-2030 (US$ Mn)
TABLE 133 Italy Propane Powered Lawn Mowers Market, By Blade Type, 2017-2022 (US$ Mn)
TABLE 134 Italy Propane Powered Lawn Mowers Market, By Blade Type, 2023-2030 (US$ Mn)
TABLE 135 Italy Propane Powered Lawn Mowers Market, by Start Type, 2017-2022 (US$ Mn)
TABLE 136 Italy Propane Powered Lawn Mowers Market, by Start Type, 2023-2030 (US$ Mn)
TABLE 137 Italy Propane Powered Lawn Mowers Market, by End-User, 2017-2022 (US$ Mn)
TABLE 138 Italy Propane Powered Lawn Mowers Market, by End-User, 2023-2030 (US$ Mn)
TABLE 139 Italy Propane Powered Lawn Mowers Market, by Product, 2017-2022 (US$ Mn)
TABLE 140 Italy Propane Powered Lawn Mowers Market, by Product, 2023-2030 (US$ Mn)
TABLE 141 Italy Propane Powered Lawn Mowers Market, by Distribution Channel, 2017-2022 (US$ Mn)
TABLE 142 Italy Propane Powered Lawn Mowers Market, by Distribution Channel, 2023-2030 (US$ Mn)
TABLE 143 Spain Propane Powered Lawn Mowers Market, By Blade Type, 2017-2022 (US$ Mn)
TABLE 144 Spain Propane Powered Lawn Mowers Market, By Blade Type, 2023-2030 (US$ Mn)
TABLE 145 Spain Propane Powered Lawn Mowers Market, by Start Type, 2017-2022 (US$ Mn)
TABLE 146 Spain Propane Powered Lawn Mowers Market, by Start Type, 2023-2030 (US$ Mn)
TABLE 147 Spain Propane Powered Lawn Mowers Market, by End-User, 2017-2022 (US$ Mn)
TABLE 148 Spain Propane Powered Lawn Mowers Market, by End-User, 2023-2030 (US$ Mn)
TABLE 149 Spain Propane Powered Lawn Mowers Market, by Product, 2017-2022 (US$ Mn)
TABLE 150 Spain Propane Powered Lawn Mowers Market, by Product, 2023-2030 (US$ Mn)
TABLE 151 Spain Propane Powered Lawn Mowers Market, by Distribution Channel, 2017-2022 (US$ Mn)
TABLE 152 Spain Propane Powered Lawn Mowers Market, by Distribution Channel, 2023-2030 (US$ Mn)
TABLE 153 Rest of Europe Propane Powered Lawn Mowers Market, By Blade Type, 2017-2022 (US$ Mn)
TABLE 154 Rest of Europe Propane Powered Lawn Mowers Market, By Blade Type, 2023-2030 (US$ Mn)
TABLE 155 Rest of Europe Propane Powered Lawn Mowers Market, by Start Type, 2017-2022 (US$ Mn)
TABLE 156 Rest of Europe Propane Powered Lawn Mowers Market, by Start Type, 2023-2030 (US$ Mn)
TABLE 157 Rest of Europe Propane Powered Lawn Mowers Market, by End-User, 2017-2022 (US$ Mn)
TABLE 158 Rest of Europe Propane Powered Lawn Mowers Market, by End-User, 2023-2030 (US$ Mn)
TABLE 159 Rest of Europe Propane Powered Lawn Mowers Market, by Product, 2017-2022 (US$ Mn)
TABLE 160 Rest of Europe Propane Powered Lawn Mowers Market, by Product, 2023-2030 (US$ Mn)
TABLE 161 Rest of Europe Propane Powered Lawn Mowers Market, by Distribution Channel, 2017-2022 (US$ Mn)
TABLE 162 Rest of Europe Propane Powered Lawn Mowers Market, by Distribution Channel, 2023-2030 (US$ Mn)
TABLE 163 Asia Pacific Propane Powered Lawn Mowers Market, By Blade Type, 2017-2022 (US$ Mn)
TABLE 164 Asia Pacific Propane Powered Lawn Mowers Market, By Blade Type, 2023-2030 (US$ Mn)
TABLE 165 Asia Pacific Propane Powered Lawn Mowers Market, by Start Type, 2017-2022 (US$ Mn)
TABLE 166 Asia Pacific Propane Powered Lawn Mowers Market, by Start Type, 2023-2030 (US$ Mn)
TABLE 167 Asia Pacific Propane Powered Lawn Mowers Market, by End-User, 2017-2022 (US$ Mn)
TABLE 168 Asia Pacific Propane Powered Lawn Mowers Market, by End-User, 2023-2030 (US$ Mn)
TABLE 169 Asia Pacific Propane Powered Lawn Mowers Market, by Product, 2017-2022 (US$ Mn)
TABLE 170 Asia Pacific Propane Powered Lawn Mowers Market, by Product, 2023-2030 (US$ Mn)
TABLE 171 Asia Pacific Propane Powered Lawn Mowers Market, by Distribution Channel, 2017-2022 (US$ Mn)
TABLE 172 Asia Pacific Propane Powered Lawn Mowers Market, by Distribution Channel, 2023-2030 (US$ Mn)
TABLE 173 China Propane Powered Lawn Mowers Market, By Blade Type, 2017-2022 (US$ Mn)
TABLE 174 China Propane Powered Lawn Mowers Market, By Blade Type, 2023-2030 (US$ Mn)
TABLE 175 China Propane Powered Lawn Mowers Market, by Start Type, 2017-2022 (US$ Mn)
TABLE 176 China Propane Powered Lawn Mowers Market, by Start Type, 2023-2030 (US$ Mn)
TABLE 177 China Propane Powered Lawn Mowers Market, by End-User, 2017-2022 (US$ Mn)
TABLE 178 China Propane Powered Lawn Mowers Market, by End-User, 2023-2030 (US$ Mn)
TABLE 179 China Propane Powered Lawn Mowers Market, by Product, 2017-2022 (US$ Mn)
TABLE 180 China Propane Powered Lawn Mowers Market, by Product, 2023-2030 (US$ Mn)
TABLE 181 China Propane Powered Lawn Mowers Market, by Distribution Channel, 2017-2022 (US$ Mn)
TABLE 182 China Propane Powered Lawn Mowers Market, by Distribution Channel, 2023-2030 (US$ Mn)
TABLE 183 Japan Propane Powered Lawn Mowers Market, By Blade Type, 2017-2022 (US$ Mn)
TABLE 184 Japan Propane Powered Lawn Mowers Market, By Blade Type, 2023-2030 (US$ Mn)
TABLE 185 Japan Propane Powered Lawn Mowers Market, by Start Type, 2017-2022 (US$ Mn)
TABLE 186 Japan Propane Powered Lawn Mowers Market, by Start Type, 2023-2030 (US$ Mn)
TABLE 187 Japan Propane Powered Lawn Mowers Market, by End-User, 2017-2022 (US$ Mn)
TABLE 188 Japan Propane Powered Lawn Mowers Market, by End-User, 2023-2030 (US$ Mn)
TABLE 189 Japan Propane Powered Lawn Mowers Market, by Product, 2017-2022 (US$ Mn)
TABLE 190 Japan Propane Powered Lawn Mowers Market, by Product, 2023-2030 (US$ Mn)
TABLE 191 Japan Propane Powered Lawn Mowers Market, by Distribution Channel, 2017-2022 (US$ Mn)
TABLE 192 Japan Propane Powered Lawn Mowers Market, by Distribution Channel, 2023-2030 (US$ Mn)
TABLE 193 India Propane Powered Lawn Mowers Market, By Blade Type, 2017-2022 (US$ Mn)
TABLE 194 India Propane Powered Lawn Mowers Market, By Blade Type, 2023-2030 (US$ Mn)
TABLE 195 India Propane Powered Lawn Mowers Market, by Start Type, 2017-2022 (US$ Mn)
TABLE 196 India Propane Powered Lawn Mowers Market, by Start Type, 2023-2030 (US$ Mn)
TABLE 197 India Propane Powered Lawn Mowers Market, by End-User, 2017-2022 (US$ Mn)
TABLE 198 India Propane Powered Lawn Mowers Market, by End-User, 2023-2030 (US$ Mn)
TABLE 199 India Propane Powered Lawn Mowers Market, by Product, 2017-2022 (US$ Mn)
TABLE 200 India Propane Powered Lawn Mowers Market, by Product, 2023-2030 (US$ Mn)
TABLE 201 India Propane Powered Lawn Mowers Market, by Distribution Channel, 2017-2022 (US$ Mn)
TABLE 202 India Propane Powered Lawn Mowers Market, by Distribution Channel, 2023-2030 (US$ Mn)
TABLE 203 South Korea Propane Powered Lawn Mowers Market, By Blade Type, 2017-2022 (US$ Mn)
TABLE 204 South Korea Propane Powered Lawn Mowers Market, By Blade Type, 2023-2030 (US$ Mn)
TABLE 205 South Korea Propane Powered Lawn Mowers Market, by Start Type, 2017-2022 (US$ Mn)
TABLE 206 South Korea Propane Powered Lawn Mowers Market, by Start Type, 2023-2030 (US$ Mn)
TABLE 207 South Korea Propane Powered Lawn Mowers Market, by End-User, 2017-2022 (US$ Mn)
TABLE 208 South Korea Propane Powered Lawn Mowers Market, by End-User, 2023-2030 (US$ Mn)
TABLE 209 South Korea Propane Powered Lawn Mowers Market, by Product, 2017-2022 (US$ Mn)
TABLE 210 South Korea Propane Powered Lawn Mowers Market, by Product, 2023-2030 (US$ Mn)
TABLE 211 South Korea Propane Powered Lawn Mowers Market, by Distribution Channel, 2017-2022 (US$ Mn)
TABLE 212 South Korea Propane Powered Lawn Mowers Market, by Distribution Channel, 2023-2030 (US$ Mn)
TABLE 213 South-East Asia Propane Powered Lawn Mowers Market, By Blade Type, 2017-2022 (US$ Mn)
TABLE 214 South-East Asia Propane Powered Lawn Mowers Market, By Blade Type, 2023-2030 (US$ Mn)
TABLE 215 South-East Asia Propane Powered Lawn Mowers Market, by Start Type, 2017-2022 (US$ Mn)
TABLE 216 South-East Asia Propane Powered Lawn Mowers Market, by Start Type, 2023-2030 (US$ Mn)
TABLE 217 South-East Asia Propane Powered Lawn Mowers Market, by End-User, 2017-2022 (US$ Mn)
TABLE 218 South-East Asia Propane Powered Lawn Mowers Market, by End-User, 2023-2030 (US$ Mn)
TABLE 219 South-East Asia Propane Powered Lawn Mowers Market, by Product, 2017-2022 (US$ Mn)
TABLE 220 South-East Asia Propane Powered Lawn Mowers Market, by Product, 2023-2030 (US$ Mn)
TABLE 221 South-East Asia Propane Powered Lawn Mowers Market, by Distribution Channel, 2017-2022 (US$ Mn)
TABLE 222 South-East Asia Propane Powered Lawn Mowers Market, by Distribution Channel, 2023-2030 (US$ Mn)
TABLE 223 Rest of Asia Pacific Propane Powered Lawn Mowers Market, By Blade Type, 2017-2022 (US$ Mn)
TABLE 224 Rest of Asia Pacific Propane Powered Lawn Mowers Market, By Blade Type, 2023-2030 (US$ Mn)
TABLE 225 Rest of Asia Pacific Propane Powered Lawn Mowers Market, by Start Type, 2017-2022 (US$ Mn)
TABLE 226 Rest of Asia Pacific Propane Powered Lawn Mowers Market, by Start Type, 2023-2030 (US$ Mn)
TABLE 227 Rest of Asia Pacific Propane Powered Lawn Mowers Market, by End-User, 2017-2022 (US$ Mn)
TABLE 228 Rest of Asia Pacific Propane Powered Lawn Mowers Market, by End-User, 2023-2030 (US$ Mn)
TABLE 229 Rest of Asia Pacific Propane Powered Lawn Mowers Market, by Product, 2017-2022 (US$ Mn)
TABLE 230 Rest of Asia Pacific Propane Powered Lawn Mowers Market, by Product, 2023-2030 (US$ Mn)
TABLE 231 Rest of Asia Pacific Propane Powered Lawn Mowers Market, by Distribution Channel, 2017-2022 (US$ Mn)
TABLE 232 Rest of Asia Pacific Propane Powered Lawn Mowers Market, by Distribution Channel, 2023-2030 (US$ Mn)
TABLE 233 Latin America Propane Powered Lawn Mowers Market, By Blade Type, 2017-2022 (US$ Mn)
TABLE 234 Latin America Propane Powered Lawn Mowers Market, By Blade Type, 2023-2030 (US$ Mn)
TABLE 235 Latin America Propane Powered Lawn Mowers Market, by Start Type, 2017-2022 (US$ Mn)
TABLE 236 Latin America Propane Powered Lawn Mowers Market, by Start Type, 2023-2030 (US$ Mn)
TABLE 237 Latin America Propane Powered Lawn Mowers Market, by End-User, 2017-2022 (US$ Mn)
TABLE 238 Latin America Propane Powered Lawn Mowers Market, by End-User, 2023-2030 (US$ Mn)
TABLE 239 Latin America Propane Powered Lawn Mowers Market, by Product, 2017-2022 (US$ Mn)
TABLE 240 Latin America Propane Powered Lawn Mowers Market, by Product, 2023-2030 (US$ Mn)
TABLE 241 Latin America Propane Powered Lawn Mowers Market, by Distribution Channel, 2017-2022 (US$ Mn)
TABLE 242 Latin America Propane Powered Lawn Mowers Market, by Distribution Channel, 2023-2030 (US$ Mn)
TABLE 243 Brazil Propane Powered Lawn Mowers Market, By Blade Type, 2017-2022 (US$ Mn)
TABLE 244 Brazil Propane Powered Lawn Mowers Market, By Blade Type, 2023-2030 (US$ Mn)
TABLE 245 Brazil Propane Powered Lawn Mowers Market, by Start Type, 2017-2022 (US$ Mn)
TABLE 246 Brazil Propane Powered Lawn Mowers Market, by Start Type, 2023-2030 (US$ Mn)
TABLE 247 Brazil Propane Powered Lawn Mowers Market, by End-User, 2017-2022 (US$ Mn)
TABLE 248 Brazil Propane Powered Lawn Mowers Market, by End-User, 2023-2030 (US$ Mn)
TABLE 249 Brazil Propane Powered Lawn Mowers Market, by Product, 2017-2022 (US$ Mn)
TABLE 250 Brazil Propane Powered Lawn Mowers Market, by Product, 2023-2030 (US$ Mn)
TABLE 251 Brazil Propane Powered Lawn Mowers Market, by Distribution Channel, 2017-2022 (US$ Mn)
TABLE 252 Brazil Propane Powered Lawn Mowers Market, by Distribution Channel, 2023-2030 (US$ Mn)
TABLE 253 Argentina Propane Powered Lawn Mowers Market, By Blade Type, 2017-2022 (US$ Mn)
TABLE 254 Argentina Propane Powered Lawn Mowers Market, By Blade Type, 2023-2030 (US$ Mn)
TABLE 255 Argentina Propane Powered Lawn Mowers Market, by Start Type, 2017-2022 (US$ Mn)
TABLE 256 Argentina Propane Powered Lawn Mowers Market, by Start Type, 2023-2030 (US$ Mn)
TABLE 257 Argentina Propane Powered Lawn Mowers Market, by End-User, 2017-2022 (US$ Mn)
TABLE 258 Argentina Propane Powered Lawn Mowers Market, by End-User, 2023-2030 (US$ Mn)
TABLE 259 Argentina Propane Powered Lawn Mowers Market, by Product, 2017-2022 (US$ Mn)
TABLE 260 Argentina Propane Powered Lawn Mowers Market, by Product, 2023-2030 (US$ Mn)
TABLE 261 Argentina Propane Powered Lawn Mowers Market, by Distribution Channel, 2017-2022 (US$ Mn)
TABLE 262 Argentina Propane Powered Lawn Mowers Market, by Distribution Channel, 2023-2030 (US$ Mn)
TABLE 263 Rest of Latin America Propane Powered Lawn Mowers Market, By Blade Type, 2017-2022 (US$ Mn)
TABLE 264 Rest of Latin America Propane Powered Lawn Mowers Market, By Blade Type, 2023-2030 (US$ Mn)
TABLE 265 Rest of Latin America Propane Powered Lawn Mowers Market, by Start Type, 2017-2022 (US$ Mn)
TABLE 266 Rest of Latin America Propane Powered Lawn Mowers Market, by Start Type, 2023-2030 (US$ Mn)
TABLE 267 Rest of Latin America Propane Powered Lawn Mowers Market, by End-User, 2017-2022 (US$ Mn)
TABLE 268 Rest of Latin America Propane Powered Lawn Mowers Market, by End-User, 2023-2030 (US$ Mn)
TABLE 269 Rest of Latin America Propane Powered Lawn Mowers Market, by Product, 2017-2022 (US$ Mn)
TABLE 270 Rest of Latin America Propane Powered Lawn Mowers Market, by Product, 2023-2030 (US$ Mn)
TABLE 271 Rest of Latin America Propane Powered Lawn Mowers Market, by Distribution Channel, 2017-2022 (US$ Mn)
TABLE 272 Rest of Latin America Propane Powered Lawn Mowers Market, by Distribution Channel, 2023-2030 (US$ Mn)
TABLE 273 Middle East and Africa Propane Powered Lawn Mowers Market, By Blade Type, 2017-2022 (US$ Mn)
TABLE 274 Middle East and Africa Propane Powered Lawn Mowers Market, By Blade Type, 2023-2030 (US$ Mn)
TABLE 275 Middle East and Africa Propane Powered Lawn Mowers Market, by Start Type, 2017-2022 (US$ Mn)
TABLE 276 Middle East and Africa Propane Powered Lawn Mowers Market, by Start Type, 2023-2030 (US$ Mn)
TABLE 277 Middle East and Africa Propane Powered Lawn Mowers Market, by End-User, 2017-2022 (US$ Mn)
TABLE 278 Middle East and Africa Propane Powered Lawn Mowers Market, by End-User, 2023-2030 (US$ Mn)
TABLE 279 Middle East and Africa Propane Powered Lawn Mowers Market, by Product, 2017-2022 (US$ Mn)
TABLE 280 Middle East and Africa Propane Powered Lawn Mowers Market, by Product, 2023-2030 (US$ Mn)
TABLE 281 Middle East and Africa Propane Powered Lawn Mowers Market, by Distribution Channel, 2017-2022 (US$ Mn)
TABLE 282 Middle East and Africa Propane Powered Lawn Mowers Market, by Distribution Channel, 2023-2030 (US$ Mn)
TABLE 283 GCC Countries Propane Powered Lawn Mowers Market, By Blade Type, 2017-2022 (US$ Mn)
TABLE 284 GCC Countries Propane Powered Lawn Mowers Market, By Blade Type, 2023-2030 (US$ Mn)
TABLE 285 GCC Countries Propane Powered Lawn Mowers Market, by Start Type, 2017-2022 (US$ Mn)
TABLE 286 GCC Countries Propane Powered Lawn Mowers Market, by Start Type, 2023-2030 (US$ Mn)
TABLE 287 GCC Countries Propane Powered Lawn Mowers Market, by End-User, 2017-2022 (US$ Mn)
TABLE 288 GCC Countries Propane Powered Lawn Mowers Market, by End-User, 2023-2030 (US$ Mn)
TABLE 289 GCC Countries Propane Powered Lawn Mowers Market, by Product, 2017-2022 (US$ Mn)
TABLE 290 GCC Countries Propane Powered Lawn Mowers Market, by Product, 2023-2030 (US$ Mn)
TABLE 291 GCC Countries Propane Powered Lawn Mowers Market, by Distribution Channel, 2017-2022 (US$ Mn)
TABLE 292 GCC Countries Propane Powered Lawn Mowers Market, by Distribution Channel, 2023-2030 (US$ Mn)
TABLE 293 South Africa Propane Powered Lawn Mowers Market, By Blade Type, 2017-2022 (US$ Mn)
TABLE 294 South Africa Propane Powered Lawn Mowers Market, By Blade Type, 2023-2030 (US$ Mn)
TABLE 295 South Africa Propane Powered Lawn Mowers Market, by Start Type, 2017-2022 (US$ Mn)
TABLE 296 South Africa Propane Powered Lawn Mowers Market, by Start Type, 2023-2030 (US$ Mn)
TABLE 297 South Africa Propane Powered Lawn Mowers Market, by End-User, 2017-2022 (US$ Mn)
TABLE 298 South Africa Propane Powered Lawn Mowers Market, by End-User, 2023-2030 (US$ Mn)
TABLE 299 South Africa Propane Powered Lawn Mowers Market, by Product, 2017-2022 (US$ Mn)
TABLE 300 South Africa Propane Powered Lawn Mowers Market, by Product, 2023-2030 (US$ Mn)
TABLE 301 South Africa Propane Powered Lawn Mowers Market, by Distribution Channel, 2017-2022 (US$ Mn)
TABLE 302 South Africa Propane Powered Lawn Mowers Market, by Distribution Channel, 2023-2030 (US$ Mn)
TABLE 303 Rest of Middle East and Africa Propane Powered Lawn Mowers Market, By Blade Type, 2017-2022 (US$ Mn)
TABLE 304 Rest of Middle East and Africa Propane Powered Lawn Mowers Market, By Blade Type, 2023-2030 (US$ Mn)
TABLE 305 Rest of Middle East and Africa Propane Powered Lawn Mowers Market, by Start Type, 2017-2022 (US$ Mn)
TABLE 306 Rest of Middle East and Africa Propane Powered Lawn Mowers Market, by Start Type, 2023-2030 (US$ Mn)
TABLE 307 Rest of Middle East and Africa Propane Powered Lawn Mowers Market, by End-User, 2017-2022 (US$ Mn)
TABLE 308 Rest of Middle East and Africa Propane Powered Lawn Mowers Market, by End-User, 2023-2030 (US$ Mn)
TABLE 309 Rest of Middle East and Africa Propane Powered Lawn Mowers Market, by Product, 2017-2022 (US$ Mn)
TABLE 310 Rest of Middle East and Africa Propane Powered Lawn Mowers Market, by Product, 2023-2030 (US$ Mn)
TABLE 311 Rest of Middle East and Africa Propane Powered Lawn Mowers Market, by Distribution Channel, 2017-2022 (US$ Mn)
TABLE 312 Rest of Middle East and Africa Propane Powered Lawn Mowers Market, by Distribution Channel, 2023-2030 (US$ Mn)

Aged Care Market

Aged Care Market size was valued at USD 2823.5 million in 2024 and is anticipated to reach USD 4333.2 million by 2032, at a CAGR of 5.5% during the forecast period.

Fiber Reinforced Polymer (FRP) Rebars Market

The fiber reinforced polymer (FRP) rebars market is projected to grow from USD 859.8 million in 2024 to USD 1,925 million by 2032, registering a CAGR of 10.6% during the forecast period.

Commercial Pizza Ovens Market

The Global Commercial Pizza Ovens Market size was valued at USD 2,563.05 million in 2018 to USD 3,286.27 million in 2024 and is anticipated to reach USD 4,483.44 million by 2032, at a CAGR of 3.68% during the forecast period.

Fertility Supplements Market

Fertility Supplements Market size was valued at USD 2884 million in 2024 and is anticipated to reach USD 5377.8 million by 2032, at a CAGR of 8.1% during the forecast period.

Hand Cream Market

The Hand cream market is projected to grow from USD 854.3 million in 2024 to USD 1,382.3 million by 2032, registering a CAGR of 6.2% during the forecast period.

Dairy Market

The Global Dairy Market size was valued at USD 472.9 million in 2018 to USD 665.6 million in 2024 and is anticipated to reach USD 1,105.6 million by 2032, at a CAGR of 6.61% during the forecast period.

Pre-Owned Golf Equipment Market

The Global Pre-Owned Golf Equipment Market size was valued at USD 915.7 million in 2018 to USD 1,149.1 million in 2024 and is anticipated to reach USD 1,645.7 million by 2032, at a CAGR of 4.65% during the forecast period.

Confectionery Fillings Market

The Global Confectionery Fillings Market size was valued at USD 896.81 million in 2018 to USD 1,209.15 million in 2024 and is anticipated to reach USD 1,820.09 million by 2032, at a CAGR of 4.88% during the forecast period.

Women’s Golf Market

The Global Women’s Golf Market size was valued at USD 2,883.2 million in 2018 to USD 4,057.6 million in 2024 and is anticipated to reach USD 6,740.2 million by 2032, at a CAGR of 6.61% during the forecast period.

Marine Derived Protein Market

The Marine Derived Proteins Market size was valued at USD 9690.8 million in 2024 and is anticipated to reach USD 19027.9 million by 2032, at a CAGR of 8.8% during the forecast period (2024-2032).

Concentrated Tomatoes Market

The Global Concentrated Tomatoes Market size was valued at USD 2,977.78 million in 2018 to USD 3,933.66 million in 2024 and is anticipated to reach USD 5,741.38 million by 2032, at a CAGR of 4.51% during the forecast period.

Hot Beverages Market

The hot beverages market size was valued at USD 287815 million in 2024 and is anticipated to reach USD 358970.2 million by 2032, at a CAGR of 2.8 % during the forecast period (2024-2032).

Purchase Options

The report comes as a view-only PDF document, optimized for individual clients. This version is recommended for personal digital use and does not allow printing.
$4699

To meet the needs of modern corporate teams, our report comes in two formats: a printable PDF and a data-rich Excel sheet. This package is optimized for internal analysis and multi-location access, making it an excellent choice for organizations with distributed workforce.
$5699

The report will be delivered in printable PDF format along with the report’s data Excel sheet. This license offers 100 Free Analyst hours where the client can utilize Credence Research Inc.’s research team. It is highly recommended for organizations seeking to execute short, customized research projects related to the scope of the purchased report.
$12699

Credence Staff 3

WILLIAM, North America

Support Staff at Credence Research

KEITH PHILLIPS, Europe

Lee - CR Sales Staff

LEE VALLANCE, Asia Pacific

Kieran Jameson

KIERAN JAMESON, Australia

Report delivery within 24 to 48 hours

User Review

Thank you for the data! The numbers are exactly what we asked for and what we need to build our business case.

Materials Scientist
(privacy requested)

User Review

The report was an excellent overview of the Industrial Burners market. This report does a great job of breaking everything down into manageable chunks.

Imre Hof
Management Assistant, Bekaert

cr-clients-logos

Request Sample