
Utility Scale Transmission Substation Market Overview:
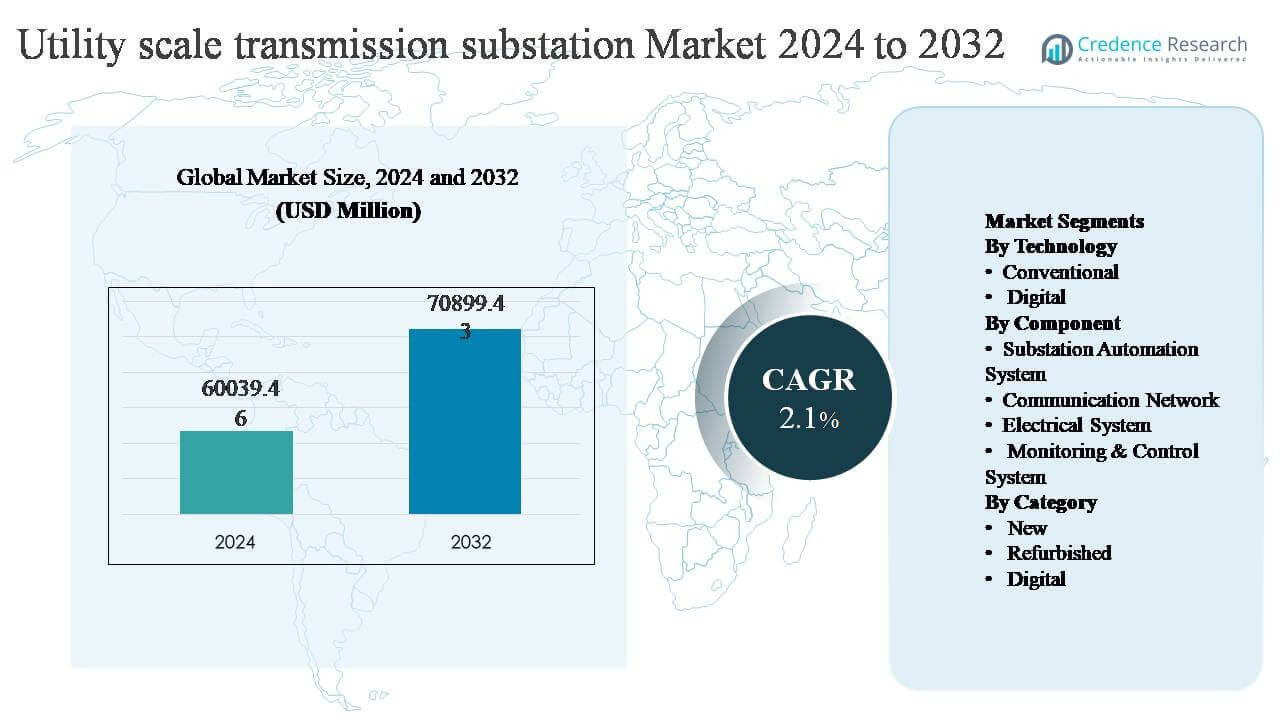
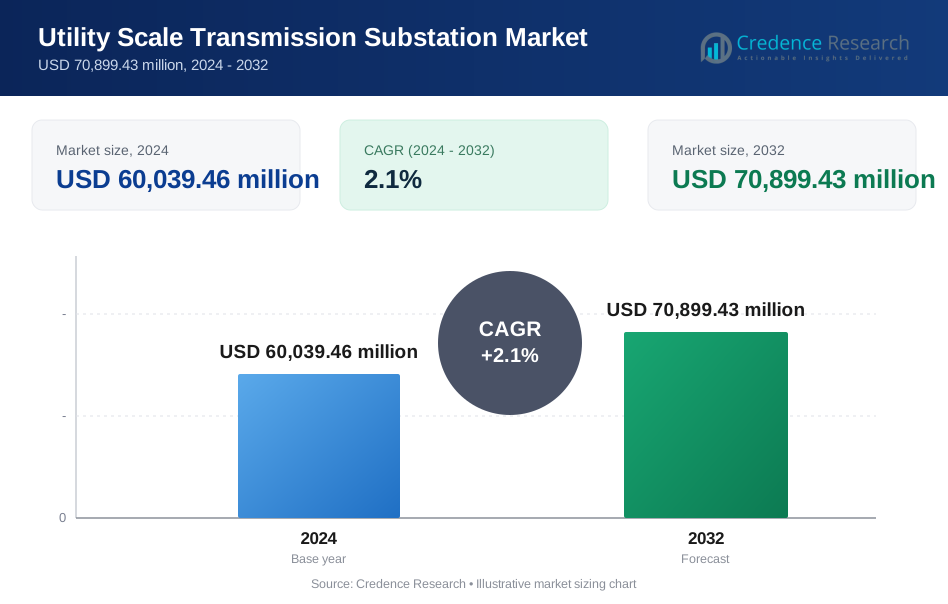
The utility-scale transmission substation market was valued at USD 60,039.46 million in 2024 and is anticipated to reach USD 70,899.43 million by 2032, expanding at a compound annual growth rate (CAGR) of 2.1% during the forecast period.
| REPORT ATTRIBUTE | DETAILS |
|---|---|
| Historical Period | 2020-2024 |
| Base Year | 2025 |
| Forecast Period | 2026-2032 |
| Utility Scale Transmission Substation Market Size 2024 | USD 60,039.46 million |
| Utility Scale Transmission Substation Market, CAGR | 2.1% |
| Utility Scale Transmission Substation Market Size 2032 | USD 70,899.43 million |
Utility Scale Transmission Substation Market Insights
- Market growth is primarily driven by rising electricity demand, large-scale renewable energy integration, and long-distance power evacuation requirements, with new substations representing the dominant category due to ongoing grid expansion and interconnection projects.
- Key market trends include increasing adoption of digital substations, growing deployment of automation and monitoring systems, and modernization of aging transmission assets, while electrical systems remain the dominant component segment due to their high capital intensity and critical grid function.
- The competitive landscape is led by global players offering integrated EPC, high-voltage equipment, and digital control solutions, with competition centered on reliability, lifecycle services, and advanced substation architectures.
- Regionally, Asia Pacific holds ~34% market share, followed by North America (~26%), Europe (~23%), Latin America (~9%), and Middle East & Africa (~8%), reflecting varied stages of grid expansion and modernization.
Utility Scale Transmission Substation Market Segmentation Analysis:
By Technology:
The utility-scale transmission substation market, by technology, is primarily driven by the conventional segment, which continues to hold the dominant share due to its extensive installed base, proven reliability, and lower upfront deployment complexity. Conventional substations remain widely adopted in legacy transmission networks where utilities prioritize long asset lifecycles and compatibility with existing equipment. However, the digital sub-segment is gaining momentum, supported by increasing grid digitalization initiatives, integration of intelligent electronic devices (IEDs), and the need for real-time data visibility. Utilities are progressively adopting digital technologies to enhance asset management, diagnostics, and grid resilience.
- For instance, Hitachi Energy’s conventional air-insulated and gas-insulated substation solutions are designed for service lives exceeding 40 years, with its high-voltage circuit breakers tested for more than 10,000 mechanical operating cycles, supporting long-term operation in bulk power transmission environments.
By Component:
By component, the electrical system segment represents the dominant sub-segment, supported by its fundamental role in transmission substations, including transformers, switchgear, busbars, and protection equipment. These components account for the largest share due to their high capital intensity and critical function in voltage transformation and power flow control. The substation automation system segment is experiencing strong growth as utilities invest in automation to improve operational efficiency, reduce manual intervention, and enhance system reliability. Communication networks and monitoring & control systems further support advanced grid management through real-time supervision and fault detection.
- For instance, Siemens Energy’s SIPROTEC 5 protection and control devices support up to 20 protection functions within a single IED and can process fault events with time-stamping accuracy of 1 microsecond, enabling precise fault localization and faster restoration in high-voltage substations.
By Category:
In terms of category, the new substation segment dominates the market, driven by expanding transmission infrastructure, renewable energy integration, and cross-border interconnection projects. New substations are essential to support rising electricity demand and long-distance power evacuation from generation hubs. The refurbished segment plays a complementary role, particularly in mature grids, where utilities upgrade aging assets to extend operational life and improve performance. The digital category within refurbishment is gaining traction, as utilities retrofit existing substations with digital protection, control, and monitoring systems to meet modern grid performance and reliability standards.
Key Growth Drivers
Expansion of Transmission Infrastructure to Support Rising Power Demand
The continued expansion of transmission infrastructure is a primary growth driver for utility-scale transmission substations. Rapid urbanization, industrial development, and electrification of transport and heating systems are driving sustained growth in electricity demand, requiring higher-capacity and more resilient transmission networks. Governments and utilities are investing heavily in new high-voltage transmission corridors to reduce congestion, improve grid stability, and ensure reliable power delivery over long distances. Utility-scale substations play a critical role in voltage transformation, load balancing, and interconnection of regional grids. The increasing scale of grid expansion projects, particularly in fast-growing economies and energy-intensive regions, directly fuels demand for new transmission substations and associated equipment.
- For instance, Power Grid Corporation of India operates more than 176,000 circuit kilometers of transmission lines and manages substations with an aggregate transformation capacity exceeding 500,000 MVA, enabling bulk power transfer across multiple regional grids.
Integration of Renewable Energy and Long-Distance Power Evacuation
The accelerating deployment of large-scale renewable energy projects is significantly driving demand for utility-scale transmission substations. Wind and solar generation assets are often located far from demand centers, requiring robust transmission substations to enable long-distance power evacuation. Grid operators are deploying high-capacity substations to manage intermittent generation, stabilize voltage levels, and ensure seamless integration of renewables into existing networks. The transition toward low-carbon power systems has increased the need for flexible and scalable substation infrastructure capable of handling bidirectional power flows. This structural shift in generation mix continues to reinforce long-term investment in transmission substations.
- For instance, ABB’s HVDC converter substations have been deployed in renewable evacuation corridors with transmission capacities of 8,000 MW per link, utilizing converter transformers weighing more than 400 tons each to enable efficient long-distance transmission with reduced losses.
Modernization of Aging Grid Infrastructure
Aging transmission infrastructure across developed economies is another major growth driver. Many existing substations were commissioned decades ago and are nearing the end of their designed operational life. Utilities are increasingly prioritizing replacement and modernization programs to improve reliability, reduce outage risks, and comply with evolving grid performance standards. Utility-scale transmission substations are being upgraded with advanced equipment, improved insulation systems, and enhanced protection schemes. These modernization initiatives help utilities improve operational efficiency, minimize technical losses, and strengthen grid resilience against extreme weather events, directly contributing to sustained market growth.
Key Trends & Opportunities
Shift Toward Digital and Intelligent Substations
The growing adoption of digital substation technologies presents a significant opportunity in the utility-scale transmission substation market. Utilities are increasingly deploying intelligent electronic devices, digital protection relays, and software-based control systems to enhance real-time monitoring and decision-making. Digital substations reduce wiring complexity, improve data accuracy, and enable predictive maintenance through advanced analytics. This trend supports faster fault detection, reduced downtime, and improved asset utilization. As grid operators seek to optimize lifecycle costs and enhance system visibility, digital substation deployments are expected to expand steadily, creating long-term opportunities for technology providers and system integrators.
- For instance, GE Grid Solutions’ digital protection and control platforms achieve time synchronization accuracy of 1 microsecond using IEEE 1588 Precision Time Protocol, allowing utilities to correlate disturbance events across multiple substations with sub-millisecond resolution.
Growth of Cross-Border and Interregional Power Interconnections
Increasing cross-border and interregional power trading is creating new opportunities for utility-scale transmission substations. Governments and regional grid operators are investing in interconnection projects to improve energy security, balance supply-demand variations, and optimize generation resources across regions. These projects require high-capacity substations capable of managing complex power flows and ensuring synchronization between different grid systems. The expansion of regional power pools and international transmission links is driving demand for advanced substations with enhanced control, protection, and communication capabilities.
- For instance, CG Power & Industrial Solutions supplied single-phase and three-phase power transformers rated up to 765 kV for India’s interregional transmission corridors, including substations linked to the national grid backbone that transfer several thousand megavolt-amperes across regions, ensuring voltage stability and synchronized operation between distant load centers.
High Capital Investment and Long Project Execution Cycles
One of the key challenges in the utility-scale transmission substation market is the high capital investment required for project development. Transmission substations involve substantial costs related to land acquisition, equipment procurement, civil works, and grid integration. Additionally, long approval processes, complex regulatory requirements, and extended construction timelines can delay project execution. These factors place financial pressure on utilities and can limit the pace of new substation deployments, particularly in regions with constrained public funding or regulatory uncertainty.
Complexity of Grid Integration and Operational Risks
The increasing complexity of transmission networks poses another significant challenge. Integrating new substations into existing grids requires careful planning to ensure system stability, protection coordination, and compatibility with legacy infrastructure. The rising penetration of variable renewable energy further complicates grid operations, increasing the risk of voltage fluctuations and system instability. Utilities must invest in skilled personnel, advanced control systems, and robust testing procedures to mitigate these risks. Managing operational complexity while maintaining high reliability standards remains a critical challenge for transmission substation operators.
Regional Analysis
North America
North America represents approximately 26% of the utility-scale transmission substation market, supported by sustained investments in grid modernization and replacement of aging transmission assets. Utilities across the United States and Canada are upgrading and expanding substations to enhance reliability, reduce outage risks, and accommodate growing renewable energy penetration. Long-distance transmission projects connecting wind- and solar-rich regions to load centers are a key driver. The region also demonstrates strong adoption of advanced protection, control, and digital substation technologies, reflecting a mature regulatory environment and a continued focus on grid resilience and operational efficiency.
Europe
Europe accounts for around 23% of the utility-scale transmission substation market, driven by extensive cross-border interconnections and ambitious energy transition targets. Transmission system operators are investing in both new substations and refurbishment of existing assets to support offshore wind integration, regional power trading, and grid stability. A strong emphasis on digitalization, automation, and lifecycle optimization characterizes the regional market. Europe’s focus on decarbonization, energy security, and harmonized grid operations continues to sustain steady demand for advanced utility-scale transmission substation infrastructure.
Asia Pacific
Asia Pacific holds the largest share of the utility-scale transmission substation market at approximately 34%, reflecting rapid economic growth, urbanization, and large-scale power infrastructure expansion. Countries such as China, India, and several Southeast Asian nations are heavily investing in high-voltage transmission substations to meet rising electricity demand and support long-distance power evacuation. Massive renewable energy deployments and government-led grid expansion programs further strengthen regional demand. The dominance of new substation construction, rather than refurbishment, underscores the ongoing expansion and modernization of transmission networks across the region.
Latin America
Latin America accounts for roughly 9% of the utility-scale transmission substation market, supported by expanding power generation capacity and transmission network development. Countries such as Brazil, Chile, and Mexico are investing in substations to connect remote renewable and hydroelectric resources to urban and industrial demand centers. Grid reinforcement projects aimed at reducing transmission losses and improving system reliability drive market activity. While new substations represent the majority of investments, refurbishment and capacity upgrades are gaining importance as regional grids gradually mature.
Middle East & Africa
The Middle East & Africa region represents approximately 8% of the utility-scale transmission substation market, with growth driven by rising electricity demand and infrastructure development. Gulf countries continue to invest in large, high-capacity substations to support industrial expansion, urban growth, and grid interconnections. In Africa, transmission substations are critical to grid expansion, electrification initiatives, and integration of new generation projects. The market is largely dominated by new installations, reflecting the ongoing development of foundational transmission infrastructure across the region.
Utility Scale Transmission Substation Market Segmentations:
By Technology
- Conventional
- Digital
By Component
- Substation Automation System
- Communication Network
- Electrical System
- Monitoring & Control System
By Category
- New
- Refurbished
- Digital
By Geography
- North America
- U.S.
- Canada
- Mexico
- Europe
- Germany
- France
- U.K.
- Italy
- Spain
- Rest of Europe
- Asia Pacific
- China
- Japan
- India
- South Korea
- South-east Asia
- Rest of Asia Pacific
- Latin America
- Brazil
- Argentina
- Rest of Latin America
- Middle East & Africa
- GCC Countries
- South Africa
- Rest of the Middle East and Africa
Competitive Landscape
The competitive landscape of the utility-scale transmission substation market is characterized by the presence of globally established power equipment manufacturers with strong engineering, manufacturing, and project execution capabilities. Leading players compete on the basis of high-voltage equipment portfolios, turnkey EPC expertise, and long-term service offerings covering installation, commissioning, and lifecycle maintenance.
Companies focus on delivering integrated substation solutions that combine transformers, switchgear, protection systems, and digital control platforms. Strategic priorities include investments in advanced insulation technologies, compact substation designs, and digital substation architectures to improve reliability and operational efficiency.
Partnerships with transmission system operators and utilities, along with participation in large grid expansion and modernization projects, reinforce competitive positioning. Additionally, a strong regional presence, supply chain resilience, and the ability to meet stringent regulatory and grid code requirements play a critical role in differentiating leading market participants.
Key Player Analysis
- General Electric
- Hitachi Energy
- ABB
- Eaton
- CG Power & Industrial Solutions
- L&T Electrical and Automation
- Efacec
- Rockwell Automation
- Open System International
- Locamation
Recent Developments
- In May 2025, GE Vernova secures orders for high-capacity grid equipment including substations: GE Vernova’s Grid Solutions business secured orders from the Power Grid Corporation of India for supply of 765 kV shunt reactors and associated substation equipment to support large transmission loads for India’s grid modernization program. These orders include technologies used in utility-scale substations for high-voltage network stability.
- In January 2024, Hitachi Energy introduced the SAM600 3.0 process interface unit to accelerate digital substation adoption, enabling faster integration of protection, control, and monitoring for transmission substations.
Report Coverage
The research report offers an in-depth analysis based on Technology, Component, Category and Geography. It details leading market players, providing an overview of their business, product offerings, investments, revenue streams, and key applications. Additionally, the report includes insights into the competitive environment, SWOT analysis, current market trends, as well as the primary drivers and constraints. Furthermore, it discusses various factors that have driven market expansion in recent years. The report also explores market dynamics, regulatory scenarios, and technological advancements that are shaping the industry. It assesses the impact of external factors and global economic changes on market growth. Lastly, it provides strategic recommendations for new entrants and established companies to navigate the complexities of the market.
Request a Free Sample
Fill in your details and we'll send you a free sample report.
- Sample data tables & charts
- Research methodology
Need a Custom Version of This Report?
Tailor the scope, geography, or segments to your exact requirements.
- Custom geography or segment scope
- Direct access to our analyst team
Frequently Asked Questions
What is the current market size for the utility-scale transmission substation market, and what is its projected size in 2032?
At what Compound Annual Growth Rate is the utility-scale transmission substation market projected to grow between 2024 and 2032?
Which utility-scale transmission substation segment held the largest share in 2024?
What are the primary factors fueling the growth of the utility-scale transmission substation market?
Who are the leading companies in the utility-scale transmission substation market?
Which region commanded the largest share of the utility-scale transmission substation market in 2024?
Table of Content
Chapter 1. Report Introduction
- 1.1 Report Description & Purpose
- 1.1.1 Report Title & Market Definition
- 1.1.2 Unique Selling Propositions (USP) & Key Differentiators
- 1.1.3 Value Proposition for Stakeholders
- 1.2 Research Objectives
- 1.2.1 Market Sizing Objectives (Volume & Revenue)
- 1.2.2 Segmentation Objectives
- 1.2.3 Competitive Intelligence Objectives
- 1.2.4 Forecast & Scenario Objectives
- 1.3 Report Scope
- 1.3.1 Utility Scale Transmission Substation Scope – Types & Subtypes Covered
- 1.3.2 Geographic Scope – Regions & Countries Covered
- 1.3.3 Historical Period, Base Year & Forecast Period (2024; forecast to 2032)
- 1.3.4 Inclusions & Exclusions
- 1.4 HS Code & Classification Framework
- 1.5 Currency, Units & Pricing Basis
- 1.6 Target Stakeholders
- 1.7 Limitations & Assumptions
Chapter 2. Executive Summary
- 2.1 Global Utility Scale Transmission Substation Market Snapshot
- 2.1.1 Market Size – Historical (2024) & Forecast (2024-2032) (2024: USD 60,039.46 million → 2032: USD 70,899.43 million)
- 2.1.2 Volume & Revenue – Global Totals
- 2.1.3 Key Market Highlights – Top Five Facts
- 2.2 Utility Scale Transmission Substation Market Segmentation Snapshot
- 2.2.1 Market Split by Region – 2024 vs. 2032
- 2.3 Competitive Snapshot
- 2.3.1 Top 10 Players by Revenue Share – 2024
- 2.3.2 Top 10 Players by Volume Share – 2024
- 2.3.3 Recent Strategic Developments (18-Month Summary)
- 2.4 Key Investment Highlights & Strategic Conclusions
Chapter 3. Utility Scale Transmission Substation Market Dynamics & Industry Analysis
- 3.1 Market Overview & Context
- 3.1.1 Utility Scale Transmission Substation Market Position in the Broader Automotive Value Chain
- 3.1.2 OEM vs. Replacement Market Dynamics
- 3.1.3 Market Maturity & Development Stage by Region
- 3.2 Utility Scale Transmission Substation Market Drivers
- 3.3 Utility Scale Transmission Substation Market Restraints & Challenges
- 3.4 Utility Scale Transmission Substation Market Opportunities
- 3.5 Porter's Five Forces Analysis
- 3.5.1 Threat of New Entrants
- 3.5.2 Bargaining Power of Suppliers
- 3.5.3 Bargaining Power of Buyers
- 3.5.4 Threat of Substitutes
- 3.5.5 Competitive Rivalry – Intensity Assessment
- 3.6 Utility Scale Transmission Substation Value Chain Analysis
- 3.6.1 Upstream – Raw Material/Input Suppliers
- 3.6.1.1 Raw Material/Input 1
- 3.6.1.2 Raw Material/Input 2
- 3.6.1.3 Raw Material/Input 3
- 3.6.2 Midstream – Production/Manufacturing/Service Delivery
- 3.6.2.1 Production/Process Overview
- 3.6.2.2 Key Facility Locations & Capacity by Manufacturer
- 3.6.3 Downstream – Distribution & End Consumer
- 3.6.3.1 Primary Channel – B2B/OEM
- 3.6.3.2 Secondary Channels – Dealer, Retail, Online, Direct
- 3.6.4 Value Chain Profitability Analysis
- 3.6.1 Upstream – Raw Material/Input Suppliers
- 3.7 PESTEL Analysis
- 3.7.1 Political Factors
- 3.7.2 Economic Factors
- 3.7.3 Social Factors
- 3.7.4 Technological Factors
- 3.7.5 Environmental Factors
- 3.7.6 Legal Factors
- 3.8 Utility Scale Transmission Substation Supply Chain Analysis
- 3.8.1 Raw Material/Input Supply Risk Assessment
- 3.8.2 Manufacturing Concentration Risk (Geographic Exposure)
- 3.8.3 Trade Disruption Impact Analysis
- 3.9 Regulatory & Policy Landscape
Note: The regulatory and policy landscape section covers regulations based on their applicability to the market, Utility Scale Transmission Substation category, geography, and scope of the study. Only regulatory frameworks with a material impact on operations, compliance, trade, sustainability, or market access are analyzed in detail.
Chapter 4. Key Investment Pockets & Opportunity Analysis
- 4.1 Utility Scale Transmission Substation Market Attractiveness Analysis
- 4.1.1 By Region – Investment Attractiveness Matrix (Volume × CAGR)
- 4.2 Absolute Revenue Growth Opportunity
- 4.2.1 By Region – Absolute USD Growth Through 2032
- 4.3 Incremental Volume Opportunity
- 4.3.1 By Region – Incremental Volume Through 2032
- 4.3.2 Segment – Incremental Volume
- 4.4 Emerging Submarket Opportunity Deep Dive (Subject to Applicability)
- 4.5 Emerging Market Opportunity Scorecards
- 4.5.1 United States
- 4.5.2 Europe
- 4.5.3 Asia
- 4.5.4 Middle East & Africa
Note: Emerging Market Opportunity Scorecards will be included based on relevance and strategic importance. Regions listed are indicative and may vary depending on data availability and market dynamics.
Chapter 5. Utility Scale Transmission Substation Import-Export Analysis & Trade Flows
- 5.1 Global Trade Overview
- 5.1.1 Global Export Value by Country (2024)
- 5.1.2 Global Export Volume by Country (2024)
- 5.1.3 Global Import Value by Country (2024)
- 5.1.4 Global Import Volume by Country (2024)
- 5.1.5 Net Trade Balance by Country (2024)
- 5.2 Export Analysis – Segment
- 5.2.1 Type 1 (HS Code)
- 5.2.2 Type 2 (HS Code)
- 5.2.3 Type 3 (HS Code)
- 5.2.4 Type 4 (HS Code)
- 5.2.5 Type 5 (HS Code)
- 5.3 Import Analysis – Segment
- 5.3.1 Type 1 (HS Code)
- 5.3.2 Type 2 (HS Code)
- 5.3.3 Type 3 (HS Code)
- 5.3.4 Type 4 (HS Code)
- 5.3.5 Type 5 (HS Code)
- 5.4 Average Unit Trade Prices
- 5.4.1 Average Export Price – Segment & Country
- 5.4.2 Average Import Price – Segment & Source Country
- 5.4.3 Price Trends (2024)
- 5.5 Key Trade Route Analysis
- 5.5.1 Trade Route 1
- 5.5.2 Trade Route 2
- 5.5.3 Trade Route 3
- 5.5.4 Trade Route 4
- 5.5.5 Trade Route 5
- 5.6 Trade Policy Impact Assessment
- 5.6.1 US Anti-Dumping & Section 301 Tariffs
- 5.6.2 EU Customs Union Impact
- 5.6.3 Major Free Trade Agreements
- 5.6.4 USMCA Rules of Origin
Note: Trade policy analysis will be included only where relevant to the Utility Scale Transmission Substation market.
Chapter 6. Competitive Landscape & Company Benchmarking
- 6.1 Utility Scale Transmission Substation Market Concentration & Structure
- 6.1.1 Herfindahl-Hirschman Index (HHI) – vs. 2024
- 6.1.2 Tier 1, Tier 2 & Tier 3 Market Structure
- 6.1.3 Global, Regional & Local Player Dynamics
- 6.2 Utility Scale Transmission Substation Market Share Analysis – 2024
- 6.2.1 Global Revenue Share by Company
- 6.2.2 Global Volume Share by Company
- 6.2.3 Regional Revenue Share
- 6.2.4 Market Share Evolution ( vs. 2024)
- 6.2.5 OEM Segment Share by Company
- 6.2.6 Replacement Segment Share by Company
- 6.3 Production/Delivery Capacity & Facility Analysis
- 6.3.1 Global Installed Capacity
- 6.3.2 Capacity Utilization Rates
- 6.3.3 Production/Output Volume
- 6.3.4 Facility Locations & Capacity Map
- 6.3.5 Planned Capacity Additions
- 6.4 Utility Scale Transmission Substation Competitive Benchmarking Matrix
- 6.4.1 Revenue, Volume, CAGR & Profitability Comparison
- 6.4.2 Channel Revenue Mix
- 6.4.3 Geographic Revenue Exposure
- 6.4.4 R&D Intensity
- 6.4.5 Sustainability Maturity
- 6.5 Strategic Developments in Utility Scale Transmission Substation (Last 24 Months)
- 6.5.1 Mergers, Acquisitions & Divestments
- 6.5.2 New Utility Scale Transmission Substation Launches
- 6.5.3 Facility Expansions
- 6.5.4 Strategic Alliances, Joint Ventures & Partnerships
- 6.5.5 Distribution Expansion & Market Entry
- 6.5.6 Sustainability & ESG Initiatives
- 6.6 Competitive Strategy Mapping
- 6.6.1 Leader, Challenger, Follower & Niche Classification
- 6.6.2 Pricing Strategy Comparison
- 6.6.3 Channel Strategy Matrix
Note: Strategic developments are included based on their materiality and the availability of reliable information.
Chapter 7. Global Utility Scale Transmission Substation Market – By Distribution Channel
- 7.1 Segment Overview
- 7.1.1 Volume & Revenue Split by Channel (2024 & 2032)
- 7.1.2 Channel Mix Evolution (2024-2032)
Chapter 8. Regional Market Analysis – Global Overview
- 8.1 Global Regional Overview
- 8.1.1 Regional Volume Share
- 8.1.2 Regional Revenue Share
- 8.1.3 Regional Volume by Region
- 8.1.4 Regional Revenue by Region
- 8.1.5 Regional Forecast Through 2032
- 8.2 Cross-Regional Segment Analysis
- 8.2.1 By Distribution Channel
- 8.2.2 By Brand/Price Tier
Chapter 9. North America Utility Scale Transmission Substation Market
- 9.1 United States
- 9.2 Canada
- 9.3 Mexico
Chapter 10. Europe Utility Scale Transmission Substation Market
- 10.1 Germany
- 10.2 France
- 10.3 Italy
- 10.4 United Kingdom
- 10.5 Spain
- 10.6 Poland
- 10.7 Russia
- 10.8 Netherlands
- 10.9 Belgium
- 10.10 Sweden
- 10.11 Denmark
- 10.12 Norway
- 10.13 Rest of Europe
Chapter 11. Asia Pacific Utility Scale Transmission Substation Market
- 11.1 China
- 11.2 India
- 11.3 Japan
- 11.4 South Korea
- 11.5 Thailand
- 11.6 Indonesia
- 11.7 Vietnam
- 11.8 Malaysia
- 11.9 Australia
- 11.10 Rest of Asia Pacific
Chapter 12. Latin America Utility Scale Transmission Substation Market
- 12.1 Brazil
- 12.2 Argentina
- 12.3 Colombia
- 12.4 Chile
- 12.5 Rest of Latin America
Chapter 13. Middle East Utility Scale Transmission Substation Market
- 13.1 Saudi Arabia
- 13.2 United Arab Emirates
- 13.3 Turkey
- 13.4 Israel
- 13.5 Iran
- 13.6 Rest of the Middle East
Chapter 14. Africa Utility Scale Transmission Substation Market
- 14.1 South Africa
- 14.2 Egypt
- 14.3 Nigeria
- 14.4 Morocco
- 14.5 Rest of Africa
Chapter 15. Utility Scale Transmission Substation Company Profiles
- 15.1 [Company 01]
- 15.1.1 Company Overview
- 15.1.2 Key Management Personnel
- 15.1.3 Products & Services Portfolio
- 15.1.4 Financial Performance
- 15.1.5 Key Market Focus & Geographic Presence
- 15.1.6 Recent Developments & Strategic Initiatives
Note: The company profile list is preliminary and may change based on research findings, market developments, data availability, and client requirements.
Chapter 16. Appendices
- Appendix A – List of Abbreviations & Acronyms
- Appendix B – Industry Classification Code Reference – Full Series
- Appendix C – Production & Capacity Data Tables
- Appendix D – End-Use & Demand Base Tables
- Appendix E – Consumption & Replacement Rate Assumptions
- Appendix F – ASP Reference Tables
- Appendix G – Manufacturing & Facility Database
- Appendix H – Import-Export Data Tables
- Appendix I – Regulatory Summary Tables
- Appendix J – Primary Research Participant List (Anonymized)
- Appendix K – Primary Research Questionnaire Framework
- Appendix L – Data Sources & Bibliography
- Appendix M – Market Size Divergence & Source Comparison
Chapter 17. Research Methodology
- 17.1 Research Framework & Philosophy
- 17.2 Secondary Research – Sources, Hierarchy & Data Extraction
- 17.3 Data Modeling – Bottom-Up & Top-Down Market Sizing
- 17.4 Primary Research – Stakeholder Framework, LOI & Sample Sizes
- 17.5 Forecast Methodology – Regression, Scenario & Sensitivity Analysis
- 17.6 Quality Control – Four-Layer Validation Framework
- 17.7 Limitations & Standard Assumptions
- 17.8 Disclaimer
